Future dollar liabilities
Whether you are planning an international vacation, sending your kids to grad school abroad or immigrating on a millionaire visa, you need dollars to fund them. Think of them as future dollar liabilities. As an investor in India, the biggest problem is that Rupee returns may not be enough to purse your Dollar dreams.
Recently, we took a look at how US midcaps have out-performed Indian midcaps the last decade (here.) The risk is not only that Indian midcaps will under-perform but also that the Indian Rupee (INR) will continue on its downward trajectory vs. the dollar (USD)
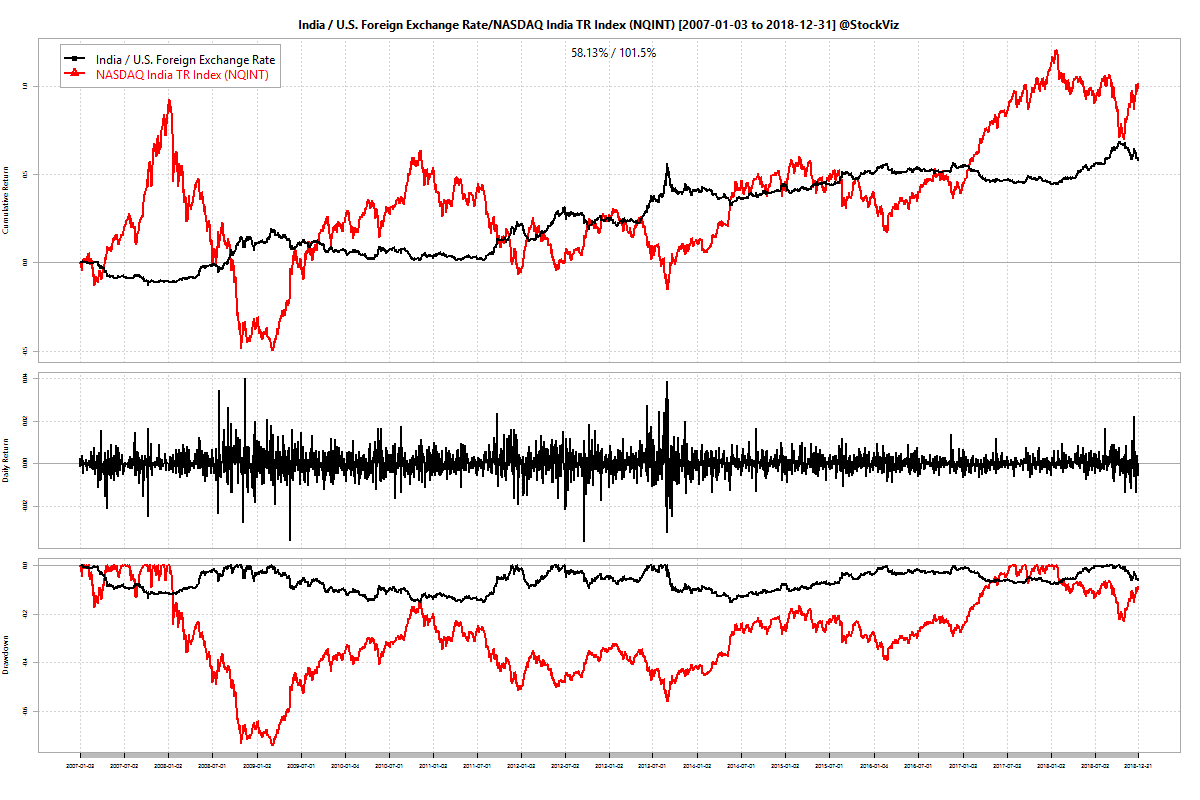
Here is a chart of USDINR (in black) and NASDAQ India TR Index (NQINT, in red.) The NQINT index is a broad-based Indian equity dollar index. Between 2007-01-03 and 2018-12-31, the rupee has depreciated by an annualized rate of 3.89%. And measured in dollars, Indian equities have returned an annualized 6.02%.
Even though some actively managed Indian midcap funds have given similar returns to US midcaps, they have done so with vastly higher volatility. Here’s a similar chart of VO (Vanguard Mid-Cap ETF, black) vs. SBI Magnum Midcap Fund (red, dollar adjusted) for the same time-period:
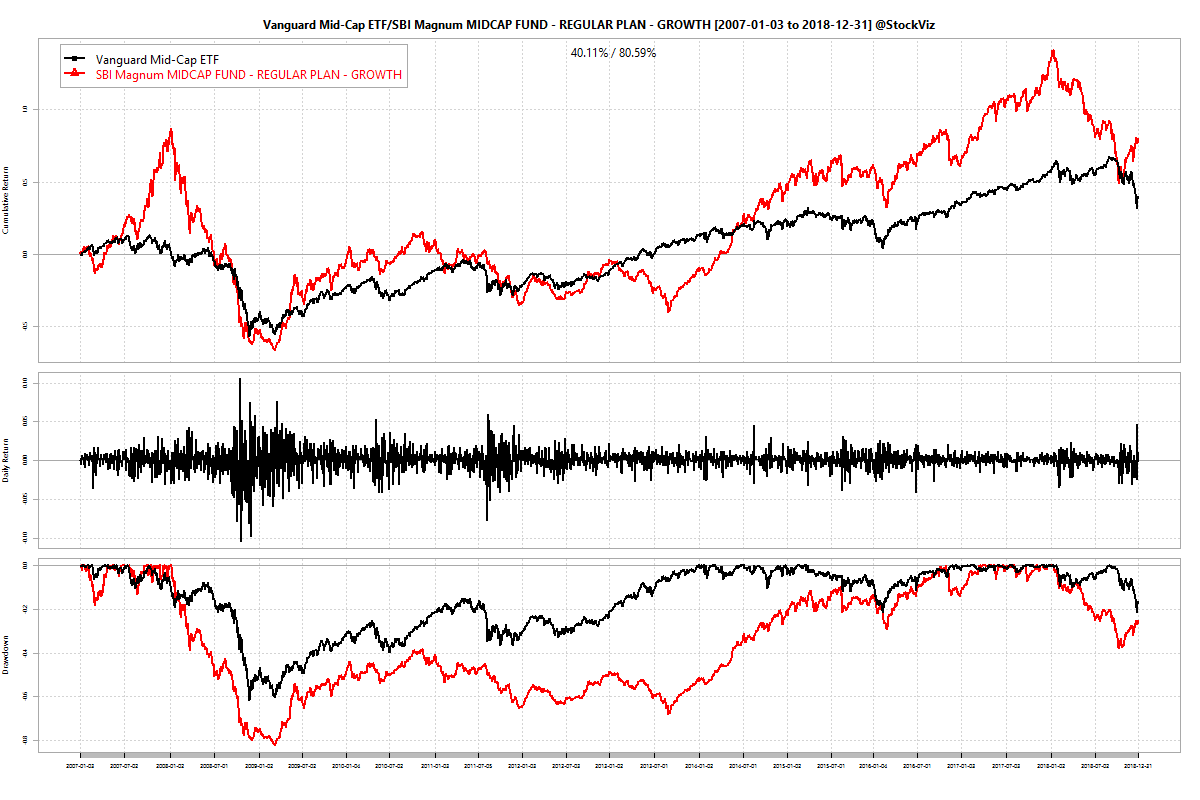
VO is slightly ahead with an annualized 7.06% return vs. Magnum’s 6.12%. However, note the steep drawdowns of Magnum vs. VO.
Taking care of business
Assuming you apply a bit of prudence and allocate more and more to bonds as your get closer to your target date to reduce volatility, you still end up with a mismatch between your dollar liabilities/expenses vs. rupee assets. One way the solve this is to invest directly into US equity funds. You can do this one of two ways:
- Buy Fund-of-Funds (FoFs) that invest in US equity.
- Open a US brokerage account and buy a target-date fund directly.
The problem with buying an FoF is that the acronym also stands for “Fees-over-Fees,” given how you pay both for the wrapper and the biscuit inside. For example, the Franklin India Feeder – Franklin U.S. Opportunities Fund has an expense ratio of 1.74% (0.92%, if direct) to buy a mutual fund (Franklin U.S. Opportunities Fund I(acc)USD) that charges another 0.85% on top (FTI, MS.) Whereas, IUSG, an ETF that tracks its benchmark (Russell 3000 Growth,) has an expense ratio of only 0.04%. To make matters worse, the mutual fund has under-performed its benchmark (see).
Most investors are not aware of option #2. Opening a brokerage account in the US is pretty straightforward. TD Ameritrade does a pretty decent job of onboarding new accounts. But the problem is in transferring funds. While Indian brokerage accounts can be funded through a mouse click, transferring funds abroad requires some paper-and-leg-work. You need to fill out a bunch of forms and take it to your bank. But the process is worth it given the cost savings throughout the life of the investment and the breadth of choices available through this channel.
Target date funds
Most investors save with a specific goal in mind. Say, your kid is 5 years old and you want to fund his grad school abroad – a good 20 years away. The easiest and cheapest way to go about this is through Vanguard’s target date funds.
From their website:
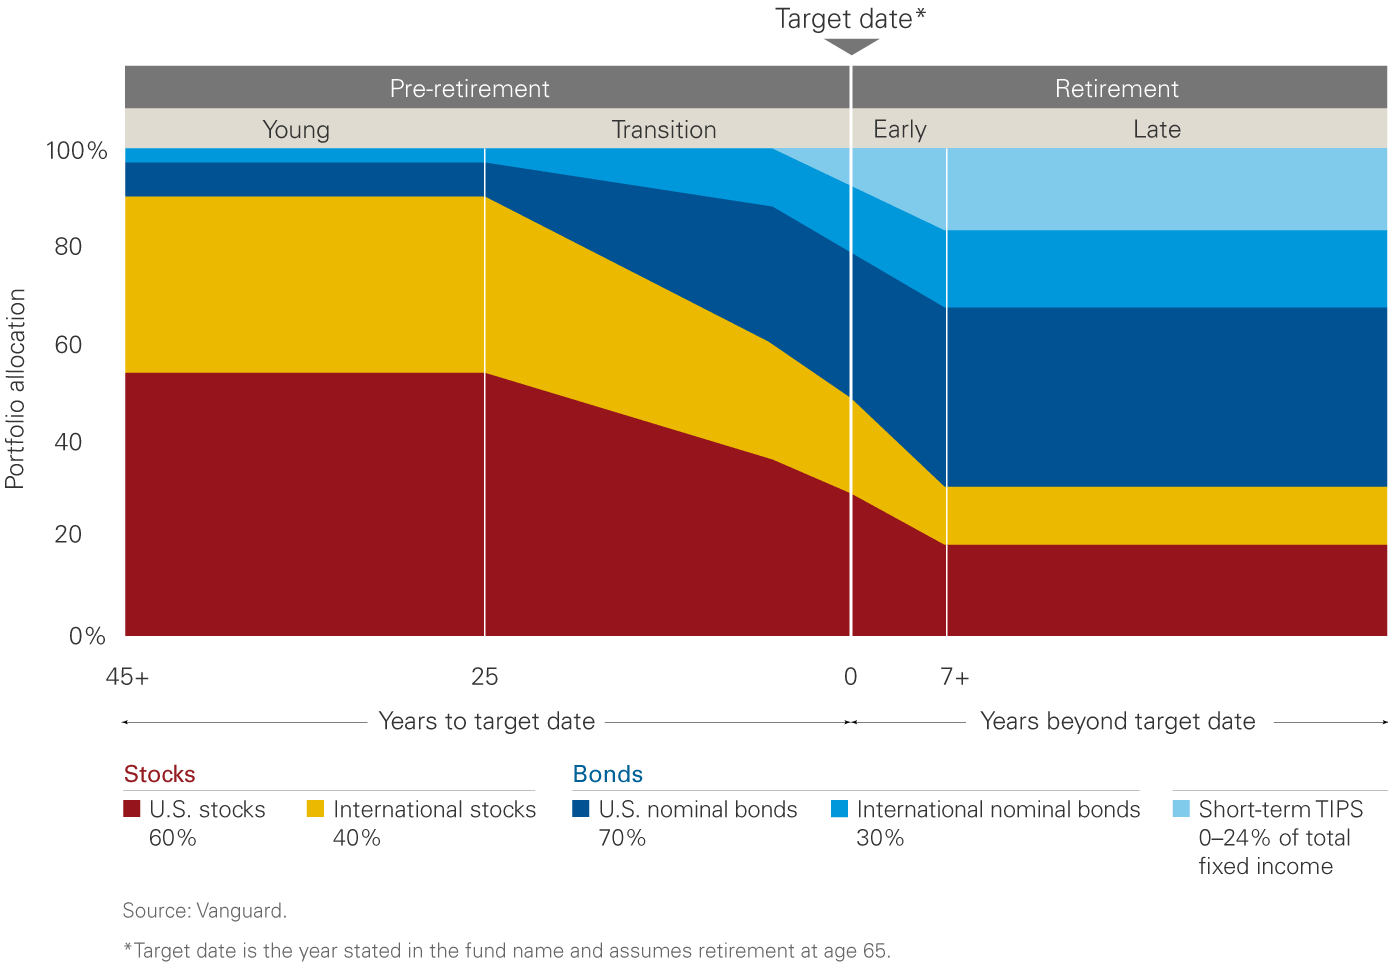
Each Target Retirement Trust invests in several low-cost Vanguard index funds to create a broadly diversified mix of stocks and bonds. The year in a Target Retirement Trust’s name is its target date, the approximate year in which an investor in the trust expects to retire and leave the workforce. A Target Retirement Trust will hold more stocks the further it is from its target date, seeking stocks’ higher potential growth. To reduce risk as the target date approaches, Vanguard’s investment managers will gradually decrease the trust’s stock holdings and increase its bond holdings.
Given that we are in 2019, you can just buy the Vanguard Target Retirement 2035 Trust and average into to it for the next 20 years to fund your kid’s education abroad.
Conclusion
Your dreams grow along with your income, if not faster. If those dreams involve international travel or studies, it makes sense to bite the bullet today and start saving for your dollar dreams in dollars. It is cheaper, over the long run, to do so through a US brokerage account.
Disclaimer: This blog post is for informational purposes alone. Do not treat this as investment advice.