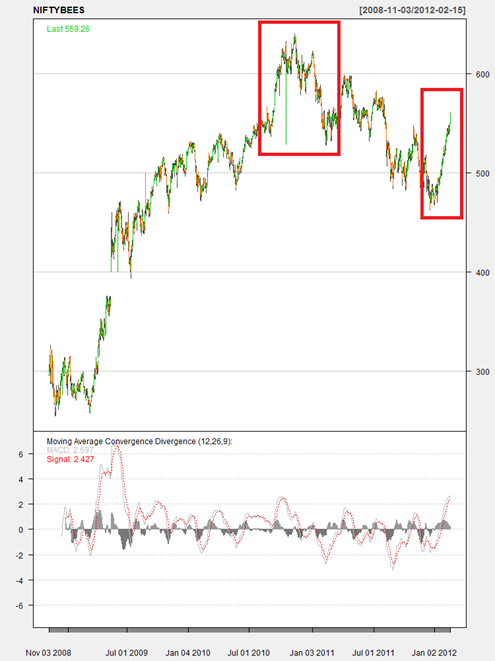
Risk Adjusted Returns

Mutual fund

Image via Wikipedia

In my intro to calculating returns I had touched upon how to compare returns on different investments, you need to first adjust it for risk. There are three such measures that I consider important: alpha, beta and the Sharpe Ratio.

Alpha measures the ability of an investor to beat the market, thereby generating returns in excess of what might be possible by taking the same amount of risk. Essentially, an investment manager should not only avoid losing money for the client and should make a certain amount of money, but in fact should make more money than the passive strategy of investing in everything equally. Basically, you are paying your mutual fund for the alpha, compared to just buying the Nifty50 ETF.

Beta is similar to correlation (see: The Reliance on Correlation.) An asset has a Beta of zero if its returns change independently of changes in the market’s returns. A positive beta means that the asset’s returns generally follow the market’s returns. By definition, the market itself has a beta of 1.0. A stock whose returns vary more than the market’s returns has a beta whose absolute value is greater than 1. A stock whose returns vary less than the market’s returns has a beta with an absolute value less than 1.

And finally, the Sharpe ratio. The Sharpe ratio tells us whether a portfolio’s returns are due to smart investment decisions or a result of excess risk. This measurement is very useful because although one portfolio or fund can reap higher returns than its peers, it is only a good investment if those higher returns do not come with too much additional risk. The greater a portfolio’s Sharpe ratio, the better its risk-adjusted performance has been. A negative Sharpe ratio indicates that a risk-less asset would perform better than the security being analyzed.

Read More:
Sharpe: http://www.investopedia.com/terms/s/sharperatio.asp#ixzz1lmQd5BEB
Beta: http://en.wikipedia.org/wiki/Beta_(finance)
Alpha: http://en.wikipedia.org/wiki/Alpha_(investment)

Questions? Email me: abhi@stockviz.biz

Real vs. Nominal Returns

The One Rupee Banknote.

Image via Wikipedia

In my previous post about calculating returns, I briefly touched upon the notion of “risk adjusting” any projected returns to see if it makes sense compared to different investment options available. Today I’m going to discuss the biggest unavoidable risk of all: inflation.

Inflation is the erosion of value of money over time. i.e., as time progresses, the same Rupee buys less goods or services. We have all seen its effects first hand – I can’t think of single thing that has become cheaper over the years in India. So how does inflation affect investment decisions?

If you just took all your money and kept it in a vault, over a period of a year, you’ll get only 90% of it back. Where did the 10% go? Inflation took it (assuming a 10% annual inflation rate). Now imagine what happens if you socked away your money in a vault over a period of 10 years? How much will you get back then?

The rate of inflation plays a crucial role in calculating returns on investments. So important, in fact, that the way we calculated returns yesterday is called “nominal returns”. When you adjust nominal returns for inflation over the same period of time, you get “real returns.”

There are various measures of inflation depending on who it affects, but the most popular of them is the CPI – the Consumer Price Index. A good rule of thumb is to subtract nominal returns with the CPI to see how much you really end up making.

Different investments react differently to changes in inflation. For example, real assets, like real estate are supposed to be immune to inflation since their value is expected to rise along with it. Bonds perform poorly in an inflationary scenario because you get a fixed return. Stocks fall somewhere in between.

So its almost always a poor investment to keep cash in a vault. At the very least, your returns should at least match the rate of inflation.

Calculating Returns The Correct Way

You often hear this whenever someone is trying to sell you something: “Don’t worry, this investment will double in 5 years” or “You will not lose money on this.” But how can you tell if it’s the right investment for you? When you look at any investment, be it real estate, gold or stocks, you need to consider two things: risk and reward.

So lets dissect the first statement: what does doubling in 5 years really mean? Your cashflow looks something like this:

imageSpend 100 now, get 200 back 5 years from now. If you run this through the XIRR function on Excel, it shows that your reward is a 19% Internal Rate of Return. Sound good? Would you take this rate of return on gold? Yes. How about teak plantations? Perpetual motion machine?

Here’s where risk plays a part in helping you gauge whether something is a good investment or not. Gold, at a 19% IRR is way better than land at the same IRR. Land at 19% is better than teak plantations at the same rate and so on. The way you figure out if you are being compensated for the risk you are taking is by comparing it with the risk-free rate for the same time period. For example, if you keep the same money in a bank fixed deposit, you’ll earn about 9% for 5 years. So the additional risk that you are taking to get to the 19% return is worth 10%.

Negative returns are those that grow less than the base rate. Getting 5% when the risk-free rate is 9% is losing money. If a stock goes up by 10% while the NIFTY 50 goes up the 12%, that’s a bad stock pick. You always need to compare the returns you get to a risk-free or passive investment in order to figure out if it makes sense. In order to compare investments across different areas, people smarter than me have come up with a variety of metrics (each of which are flawed in its own unique way) and the concept of “risk adjusted returns” which I will attempt to explain in layman terms in the future.

Tomorrow’s post will discuss the effect of inflation and transaction costs on real returns. If you have any questions, please email me: abhi@stockviz.biz

The Reliance on Correlation

Our previous discussion of correlation in the NSE looked at a years worth of data for the NIFTY 50 components to see how individual stocks correlated with the index. There are three ways to look at correlation:

  1. Highly correlated stocks can be substituted with each other. For example, if the price of stock A is highly correlated with the price of stock B (r approaching 1), then investors should be indifferent between owning A or B.
  2. Correlation can be used to expose relative value. For example, in the above example, if A pays more dividends than B, then owning A is better than owning B.
  3. Correlation as a trading tool. In the above example, say on a particular day A drops (or rises) more than B, then you can put on a trade betting on mean reversion – that ultimately A & B will start behaving similarly.

For example, lets have a look at RELIANCE over the NIFTY 50 index. I created a series of 10-day correlations (r)

For 2006:

image

For 2007:

image

For 2008:

image

For 2009:

image

For 2010:

image

and lastly for 2011:

image

It looks like RELIANCE is usually highly correlated to the NIFTY 50 and the range is somewhere between 0.7 and 1.0. Lets have a look at the histogram to get a better idea:

image

You need to ignore the deviations around stock splits and dividend ex-dates (for example, on 26-Nov-2009, RELIANCE issued a 1:1 bonus so the displacement that you see surrounding that date should be ignored) to truly appreciate what’s going here.

The charts show that there are significant number of instances when the correlation breaks down but it always moves back into the range. Looks like betting on convergence seems to be a no-brainer.

Have a trade idea? Let me know!

India proves too hot to handle for Norway’s Telenor

Telenor-pirat

Telenor-pirat (Photo credit: Hanne LK)

This is the story of how Norway’s equivalent of India’s BSNL got involved in a $40bn telecom scam. The Indian Supreme Court cancelled 122 2G licenses given on a no-bid basis in 2007. Yes, we are talking about something that happened 5 years ago for technology that’s 10 years old. But the fascinating part is that the spectrum was first sold to a real estate company called Unitech about for $365.42 million which then turn around and sold a 60% stake in its wireless division to Norway’s Telenor for $1360 million! I’m sure some people were feeling pretty smart about turning in a 270% profit for their “navigating” skills.

The minister, A. Raja, who sold the spectrum is a nobody from South India representing a grand total of one million voters. It must be a pretty fascinating journey for him coming in #2 in Time magazine’s 2011 list of “Top 10 Abuses of Power” list (just behind the Watergate scandal).

The underpriced spectrum giveaway unleashed a price war where SMS and voice tariffs in India were hammered down to the lowest in the world. Telenor had planned to invest about $3 bn in India and is said to be almost 2/3rds there. So that’s $2 bn that just got vaporized. Besides, they had out sourcing agreements with a whole bunch of Indian BPOs. Wipro is said to have $550 million worth of deals.

Its funny how Telenor, one of the top performers on the Dow Jones Sustainability Indexes for the 10th year running, got dipped in Indian curry.

Sources:

Telenor History, Nilgiris Lok Sabha Constituency), A Raja, 2G Spectrum Scam, Uninor, IT BPOs Hit