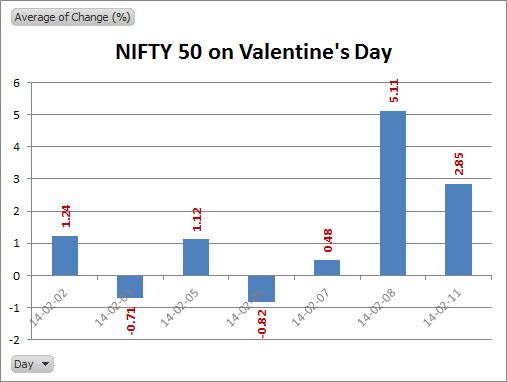
Has the market risen too fast too soon? It feels like only yesterday that all the “green shoots” talk from the US drove Nifty to overbought conditions. And then nothing happened. Europe took center stage and the drama there still continues. Are we talking about “brown shoots” now?
We had the same sort of bullishness in early 2010 and 2011 as well. And we are yet to reach those levels again.
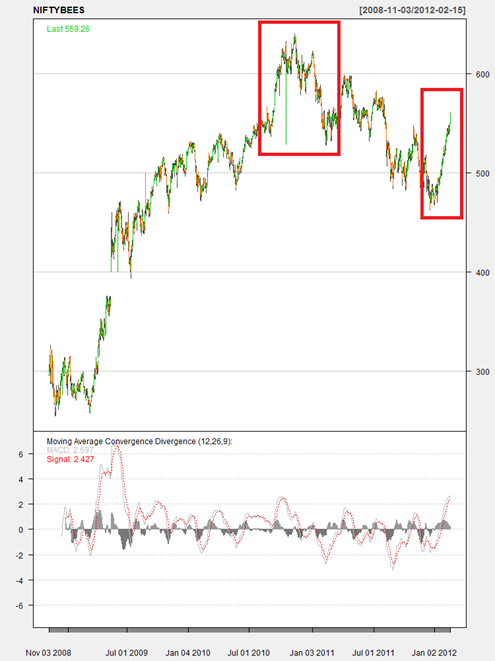
I think its time to be nervous.