Oil vs. Sensex

Oil is a very important natural resource, and one deciding outcome for a lot of economic activity as well. In case of US, rising crude has always preceded the next stock market slowdown. It happened recently in 2008, when oil touched its all time high nearing $150/barrel. Oil just tested the high marks of 2011 highs of $124. We will have to be concerned if it breaks the resistance. We might be up against a sudden rise of Brent and in turn a fall in the markets.

image

Well, India imports most of oil from Iran. Iran’s 9% of the export comes to India, and according to US, India needs to stop depending on Iran for the oil needs.

Coming onto the impact that we see on Indian market, it is no different. An increasing crude price was accompanied by falling stock market, a four day falling streak in the near past. Although as crude started falling, we did see buying happening in the markets, which pulled up the stocks back.

image

While tensions in Iran are escalating, there is no looking behind for the oil to fall to the 110$ levels any soon (Average price for the oil during the Sep – Dec period). Looking at how the oil producing and marketing companies are performing in contrast to the Brent.

image

We, see here that the oil and gas index has a bit of a preceding nature of the prices when compared to the Brent. A fall in Brent is preceded by the oil and gas index (Can be because of the delayed opening of the commodity markets in the west).

To make trades in the market, we will have to wait and watch where the oil goes from here. As far as I am concern, would be shorting till the oil is rising but would buy if it stagnates around $115 as well for the next couple of weeks.

Oil boils, roils Indian economy

Evolution of oil prices 1987-2011 (average Bre...

Image via Wikipedia

Crude oil, Indian economy’s biggest nemesis, is heading northwards again and further complicating the already battered macroeconomic picture. With the benchmark Indian crude oil basket flirting close to the $125/ barrel mark due to the Iran nuclear standoff, Finance Minister Pranab Mukherjee is sure to spend ‘sleepless nights’ fretting over the burgeoning subsidy bill.

In January, ratings agency Crisil noted that under recoveries on sale of regulated fuels would touch an all-time high of Rs 1.4 trillion (Rs 1, 40,000 crore ) in 2011-12 due to high crude oil prices and a weak rupee.clip_image002

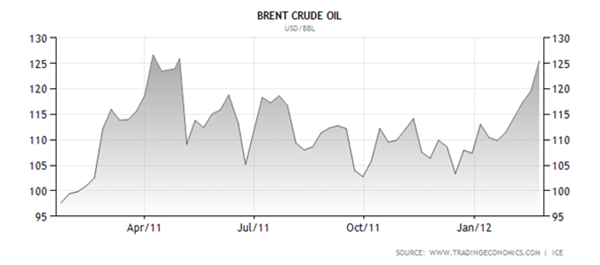
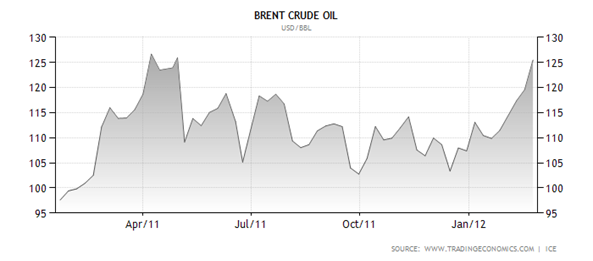
Since then, crude has surged even higher, from around $112/ barrel to the present level. A dollar increase in global crude oil price widens the industry’s under-recovery by Rs 4,000 crore annually and about Rs. 8,000 crore on account of every Re.1 depreciation.

The turnaround in Indian currency has cushioned the impact to some extent as the rupee has risen from 53/ dollar to around 49/ dollar presently.

But the damage has already been done. Under-recoveries on the sale of price-controlled fuels for FY-12 have skyrocketed to Rs 97,313 crore for the nine months ended December.

clip_image002[10]The under-recoveries of oil marketing companies (OMC) as on February 16, 2012 on sale of diesel is Rs 12.31 per litre, Kerosene Rs 28.77 per litre and domestic LPG Rs 378 per cylinder, data from the Petroleum Planning and Analysis Cell showed. At these levels, daily under-recovery stands at Rs 465 crore.

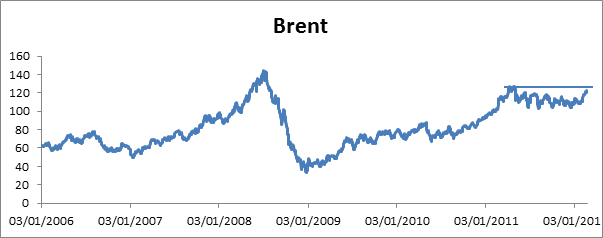
The last time this (subsidy bill breaching Rs 100,000 crore) happened was in FY ’09 when crude oil touched an all-time high of above $145/ barrel.

The share of subsidy burden for upstream oil companies has been hiked to 37.91 per cent for the first nine months (April-December) of this fiscal (FY 12), compared with 33% in the year-earlier period.

clip_image002[8]

The soaring under-recoveries has a double whammy effect- while it would adversely affect the profitability of OMCs, it would also inflate the country’s subsidy bill which is bound to expand the fiscal deficit apart from fuelling inflationary pressures.

Fiscal deficit is expected to surpass the budgeted target of 4.6% by over 1% driven largely by bloating oil subsidies.

The Centre spent Rs 38,386 crore in petroleum subsidies in 2010-11 and estimated this fiscal year’s bill at 23,640 crore.

Even as plummeting economic growth and deteriorating business conditions have severely hit its fiscal calculations, Pranabda and his battery of economic experts will have to contend with a high import and subsidy bill unless it raises retail prices as is widely expected.

Alpha, Beta, Sharpe and Information Ratio

ten-year returns

Image via Wikipedia

StockViz now had alpha, beta, Sharpe and information ratio values available for individual stocks. The calculations are done daily using 1 year’s worth of historical data.

“Alpha” is a measure of a manager’s skill by measuring the portion of the managers returns that are not attributable to “Beta”, or the portion of performance attributable to a benchmark. This is how “better” a stock is relative to owning the index (Nifty 50) outright.

“Beta” is similar to correlation. By definition, the market itself has a beta of 1.0. A stock whose returns vary more than the market’s returns has a beta whose absolute value is greater than 1. A stock whose returns vary less than the market’s returns has a beta with an absolute value less than 1.

The “Sharpe” ratio tells us whether a portfolio’s returns are due to smart investment decisions or a result of excess risk. The greater a portfolio’s Sharpe ratio, the better its risk-adjusted performance has been. A negative Sharpe ratio indicates that a risk-less asset would perform better than the security being analyzed.

“Information Ratio” relates the degree to which an investment has beaten the benchmark to the consistency with which the investment has beaten the benchmark.

Read the returns series here.

Returns on Reliance

RIL Logo

Image via Wikipedia

We had discussed how risk and return are two sides of the same coin (read the series here). Also, we looked at the high price correlation of Reliance vs. the Nifty 50 index. The question yet to be answered is this: given a choice between owning Reliance and owning the NIFTYBEES ETF, what should an investor do?

Lets look at the pros of owning the NIFTYBEES:

  1. The NIFTYBEES represent the broader market. Investors get a diversified, market-weighted portfolio.
  2. 8.73% of the NIFTYBEES is, in fact, Reliance. So investors do get a slice of exposure to Reliance.

Now what would be the disadvantages of owning the NIFTYBEES vs. owning Reliance outright?

  1. If Reliance out-performs the index, then investors only get a small (8.73%) of the increase
  2. Investors may not want to buy the entire index and might prefer a concentrated portfolio of just resource stocks, of which Reliance is one.

To answer this question, lets turn our heads to two measures: alpha and beta (discussed here.) Reliance has an alpha of -0.0002946529 and a beta of 1.027928. What this shows is that Reliance actually underperformed the index (a –ve alpha) and it more or less tracked the index (a beta close to 1; confirmed by our correlation study.)

We are in the process of rolling out alpha and beta of individual stocks against the Nifty 50 index. Stay tuned!