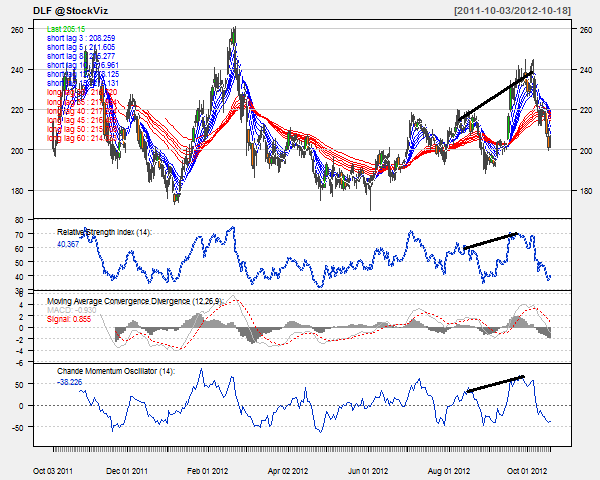
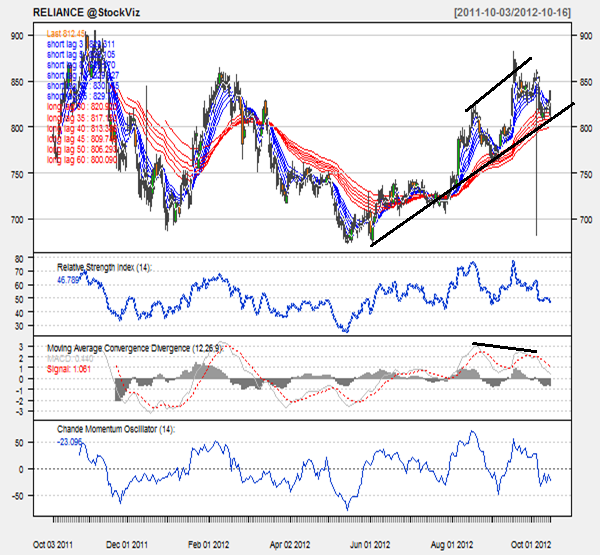
This week’s pick is [stockquote]RELIANCE[/stockquote]. Trading at around the same price as an year ago, the stock has made a meager return of 3% over the last 12 month period. The stock is in constant uptrend since May, with a few small corrections in between after it found the support at 670 levels.

Oscillators like RSI and CMO are at currently at 47 and -23. At this level of RSI, the uptrend has no potential stops in the very near future. And looking at the previous highs of RSI, the stock can see an up-move till RSI reaches close to 75. The CMO as well is in the middle, and moving close to the -50 levels. If it gets too close to -50, it will signal a buy.
MACD line and signal line are drifting apart from each other and histogram levels are stagnant, but a higher high in the prices with lower highs in the MACD line is a divergence. This behavior can be suggesting the imminent change in the direction of the prices.
Looking at GMMA for a medium to long term outlook is not giving a lot of indication. The long term lines are moving close to each other (signaling a probable change of previous trend). The decreasing separation in the short term lines also suggests a lookout period for the near term.
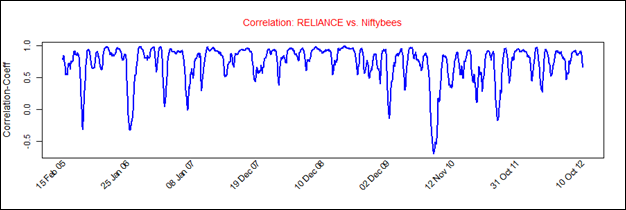
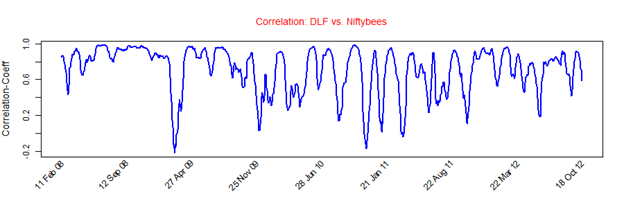
Reliance’s average correlation of 0.73 with the Niftybees suggests that the correlation is quite strong and positive, and the movements will be of the similar magnitude as Niftybees. [stockquote]NIFTYBEES[/stockquote]
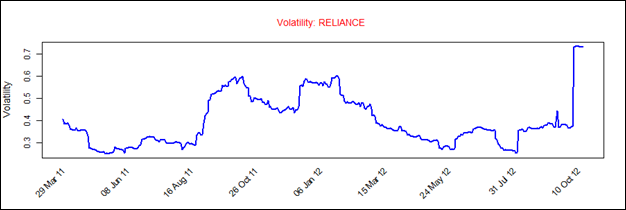
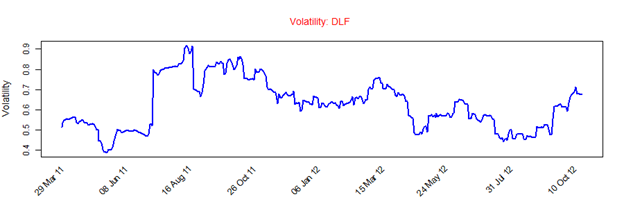
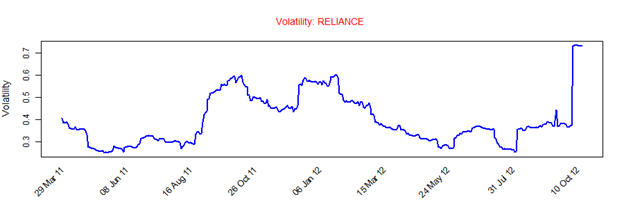
Reliance has volatility in the range of 0.2 to 0.6 for the most part, which is not a very big range. The volatility is currently at sky high levels of beyond 0.7, higher compared to the recent past. A constant eye is required on the scrip in case it makes a sudden move.
The up-trend is quite prominent. Looking at these technical, a short term buy is good but for the long term you might want to be cautious as the stock can check for the resistance levels at Rs. 900.
 and Go Algo!