From Research Affiliates’ Slugging It Out in the Equity Arena:
The Gap
There is a huge gap between reported mutual fund performance and the returns actually earned by the average investor. The gap — the difference between the fund’s total time-weighted return and the average investor’s money-weighted return — reflects the value added (or subtracted) by investors’ decisions to move cash into and out of funds. In other words, the gap is the return impact of investors’ market timing decisions.
Over the past 10 years, the average investor earned a return that was 2.5% worse than the return of the average fund they invested in!
Procyclical vs. Countercyclical
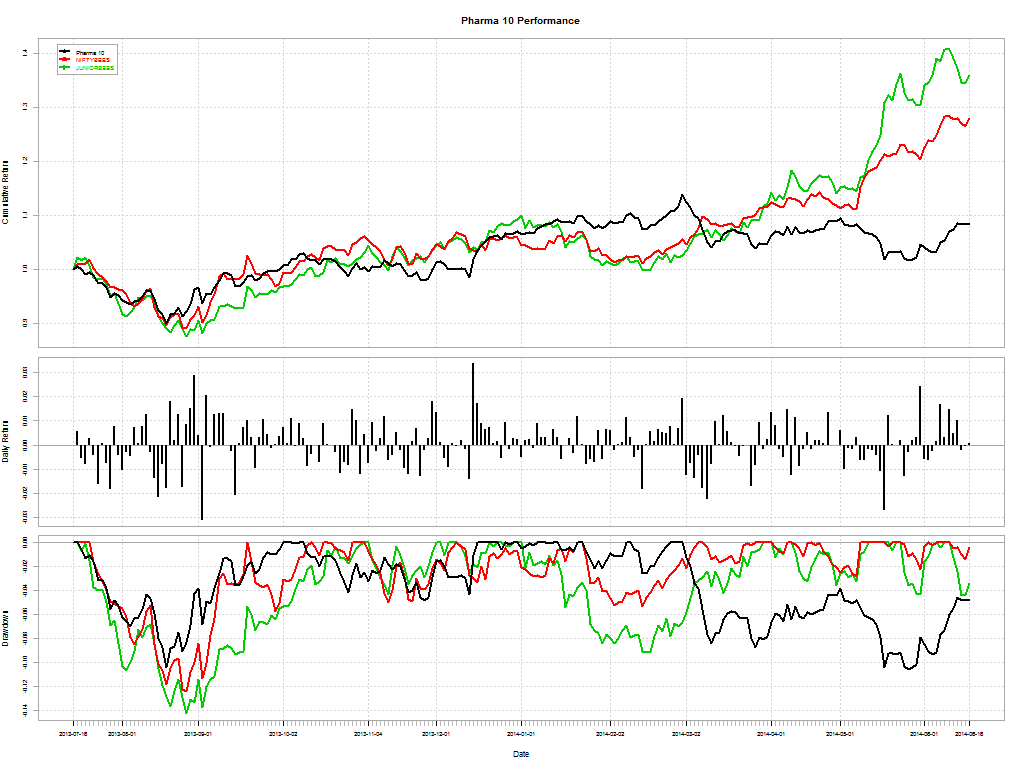
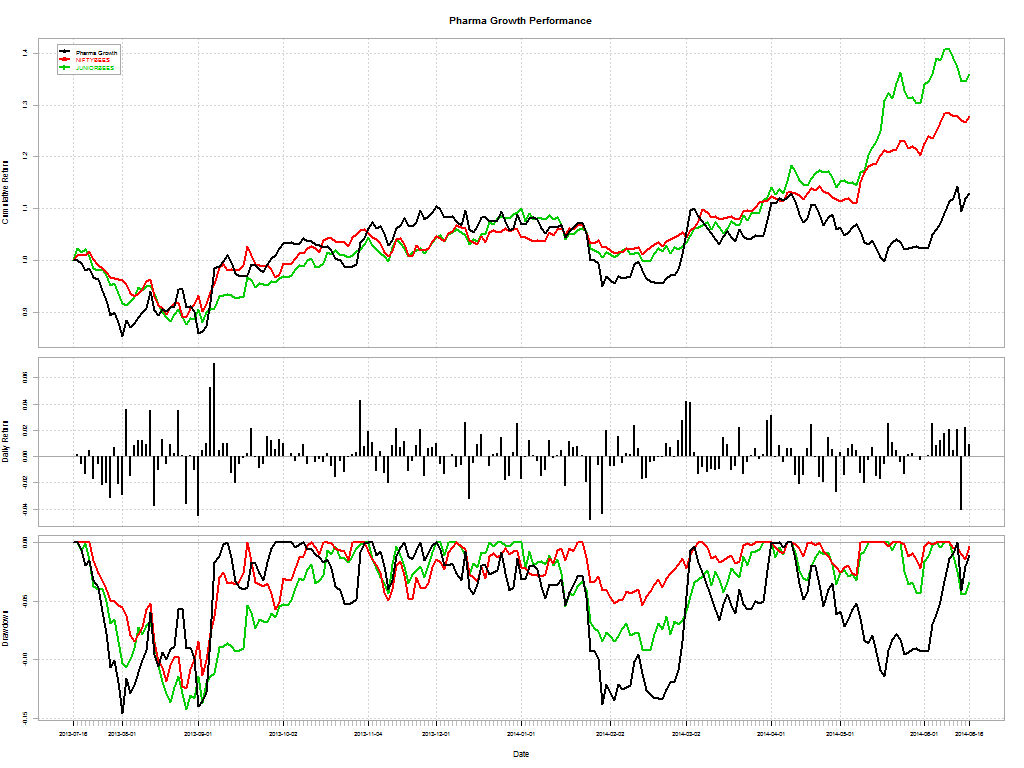
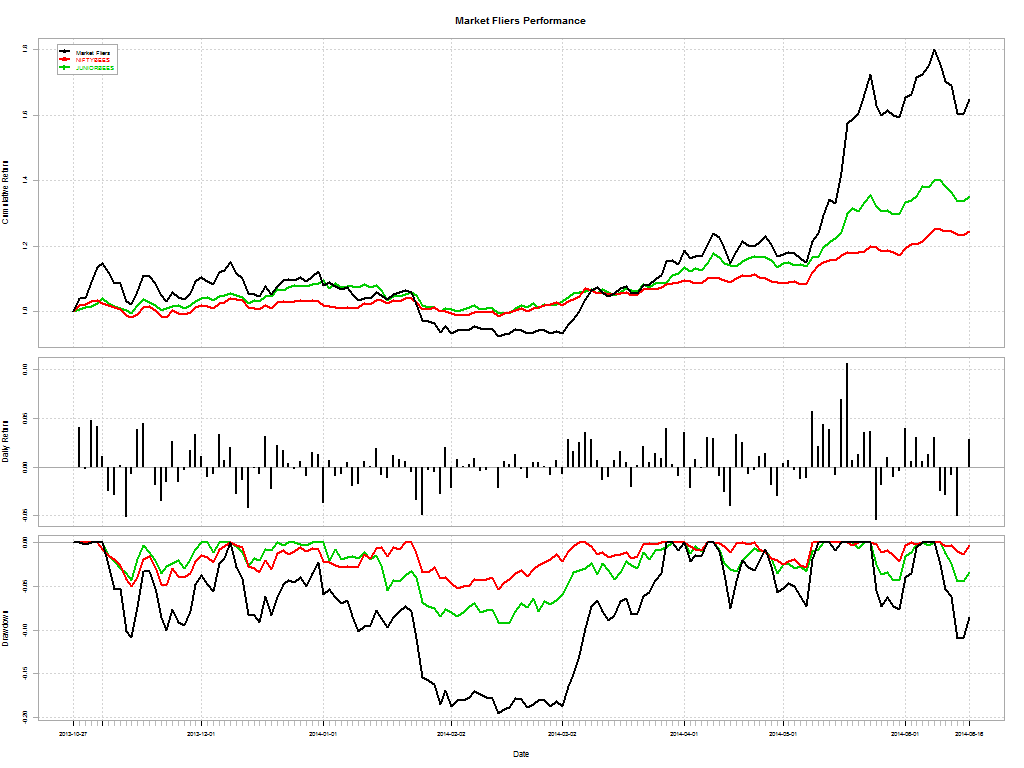
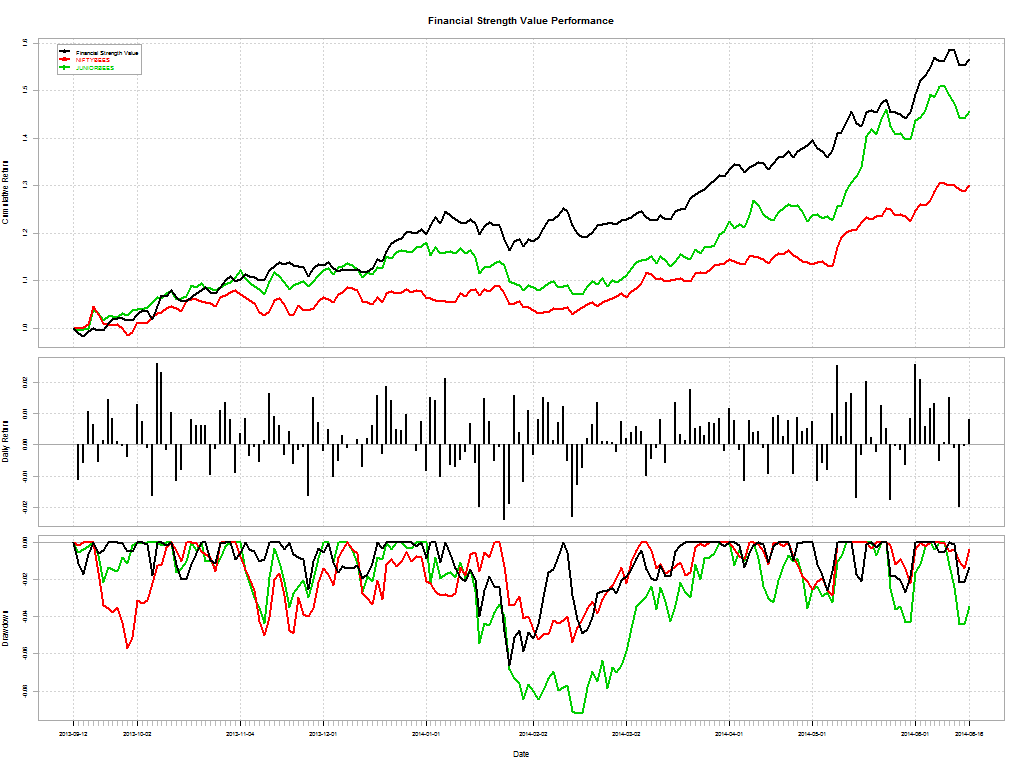
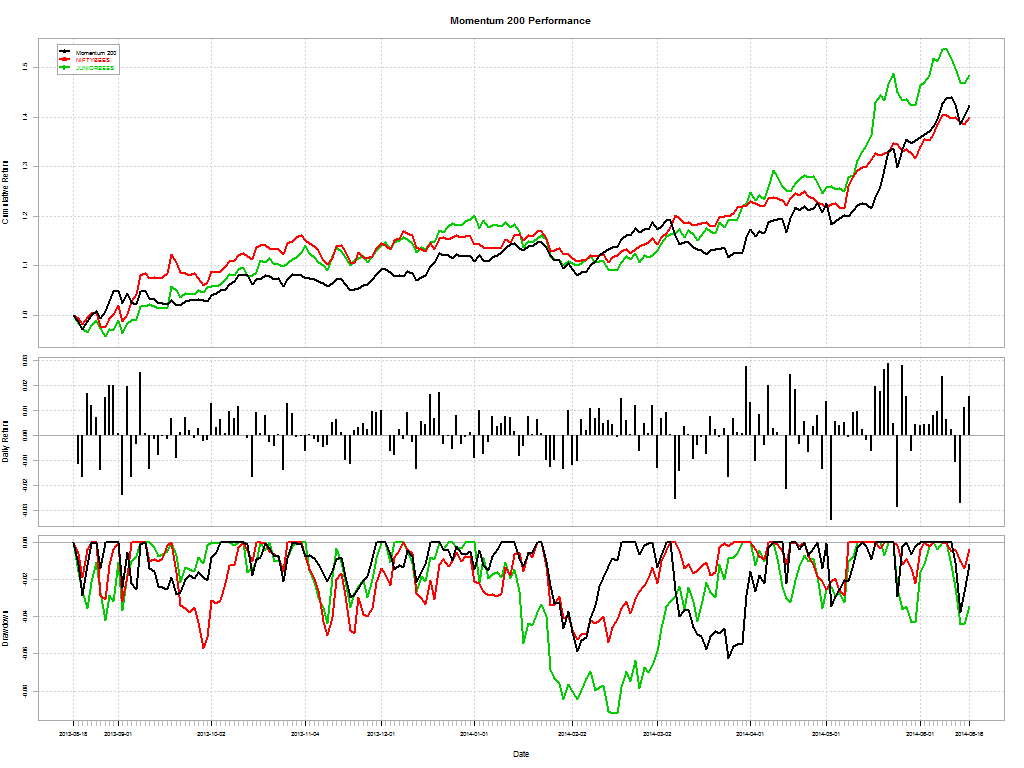
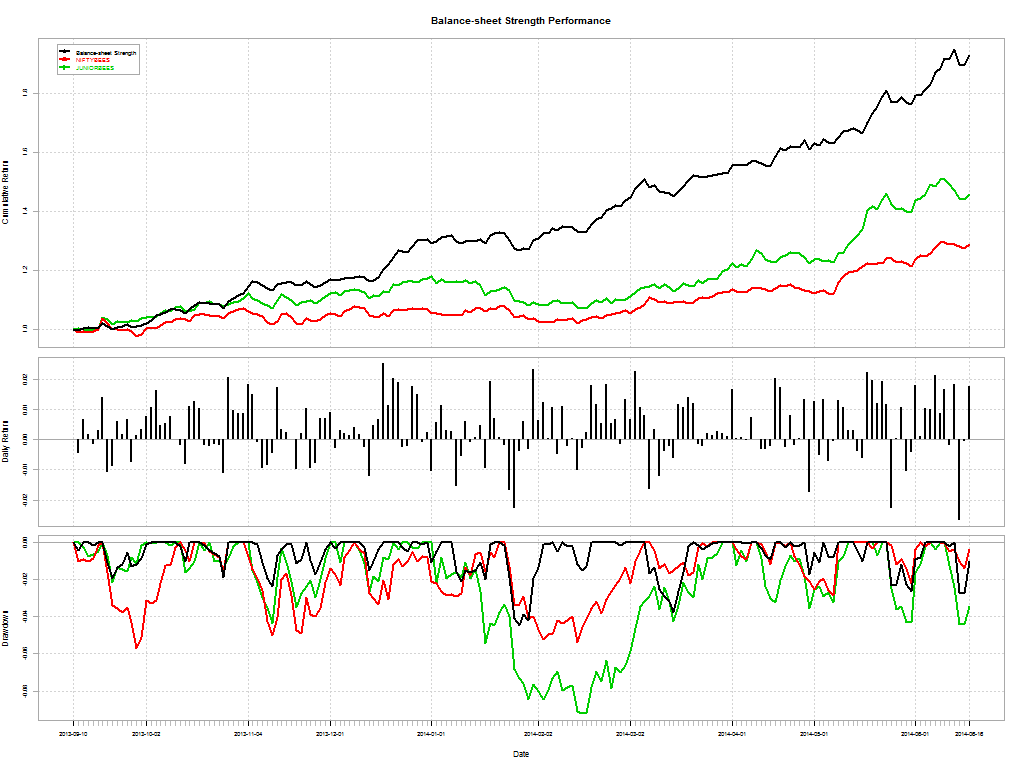
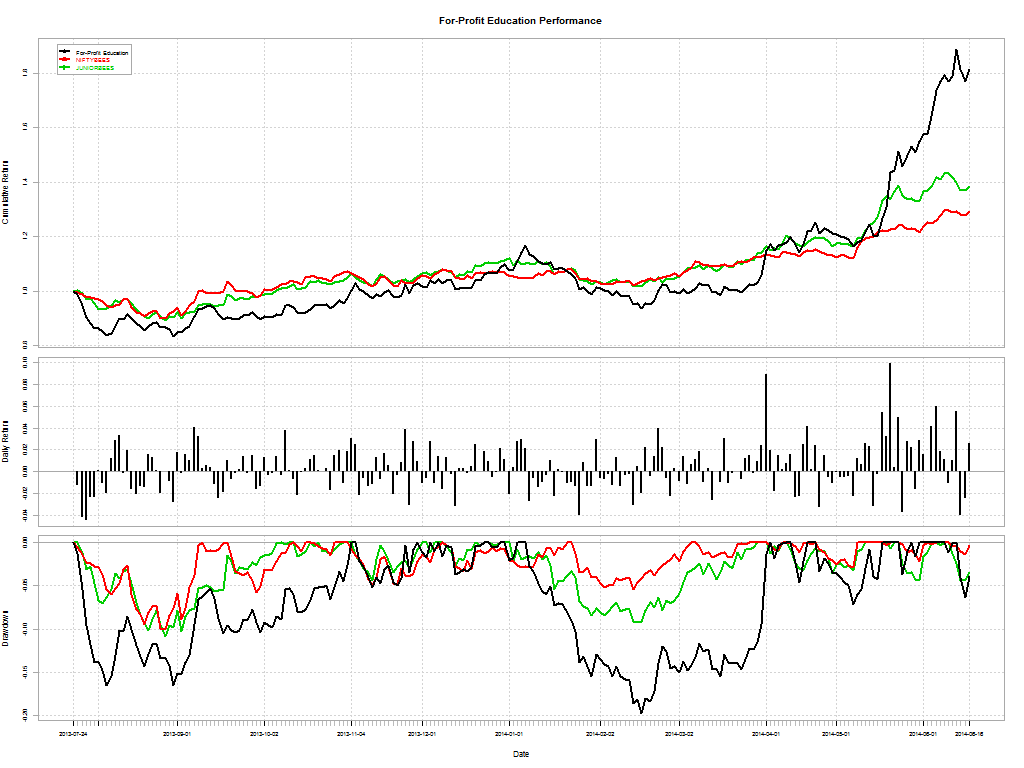
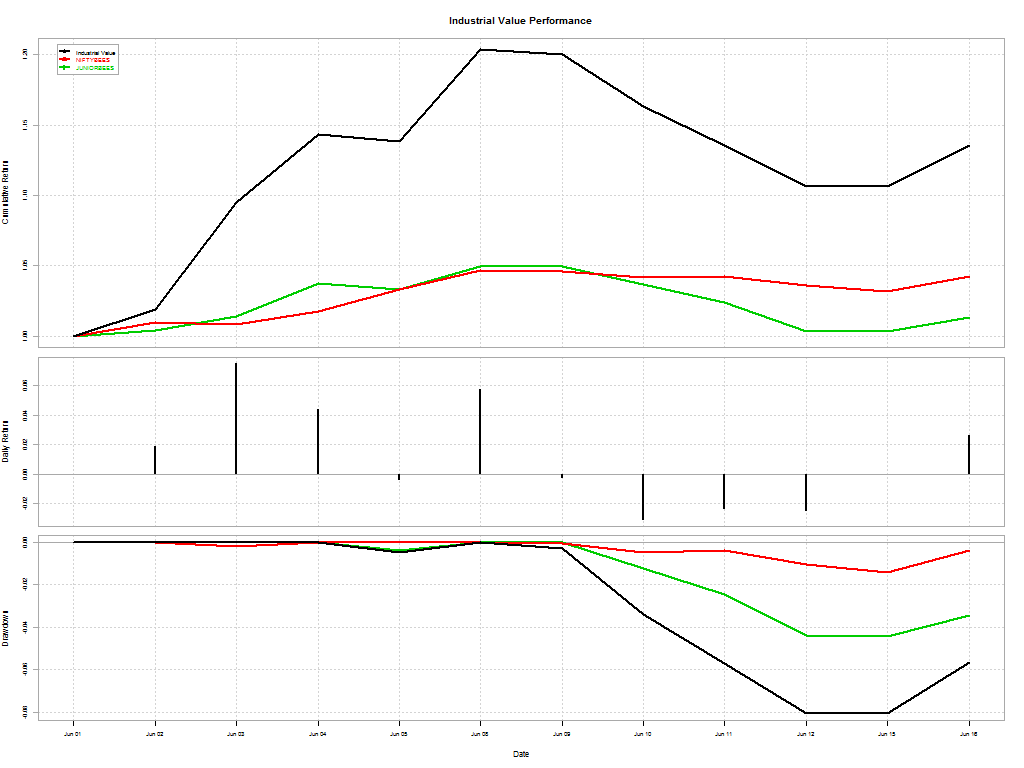
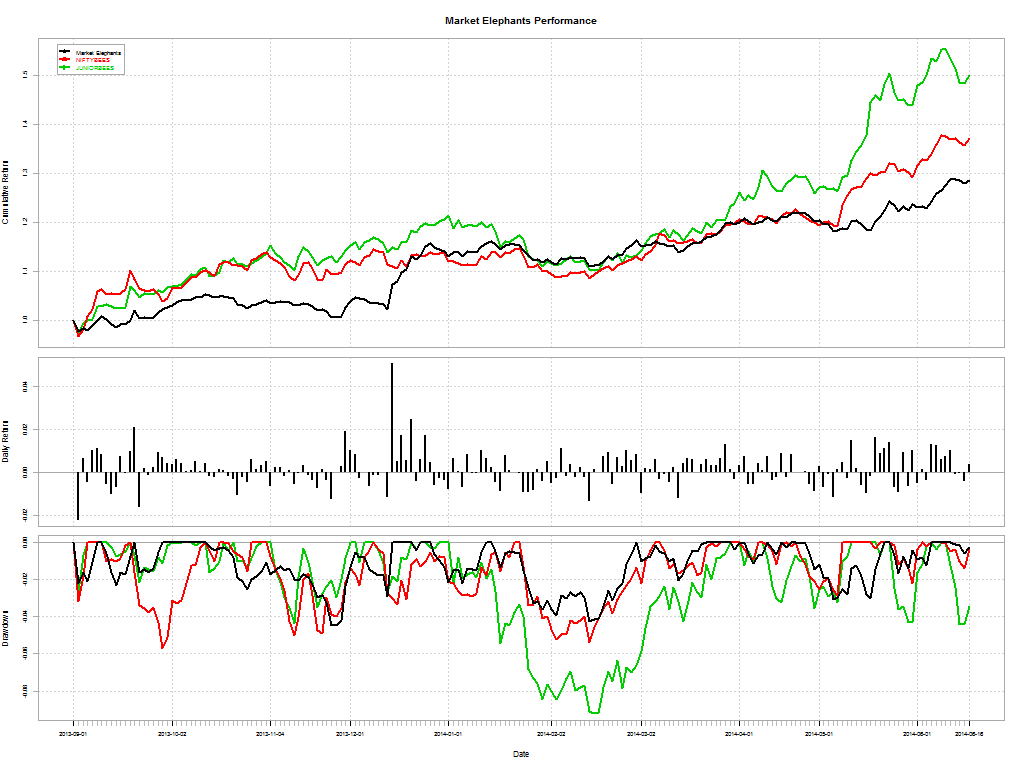
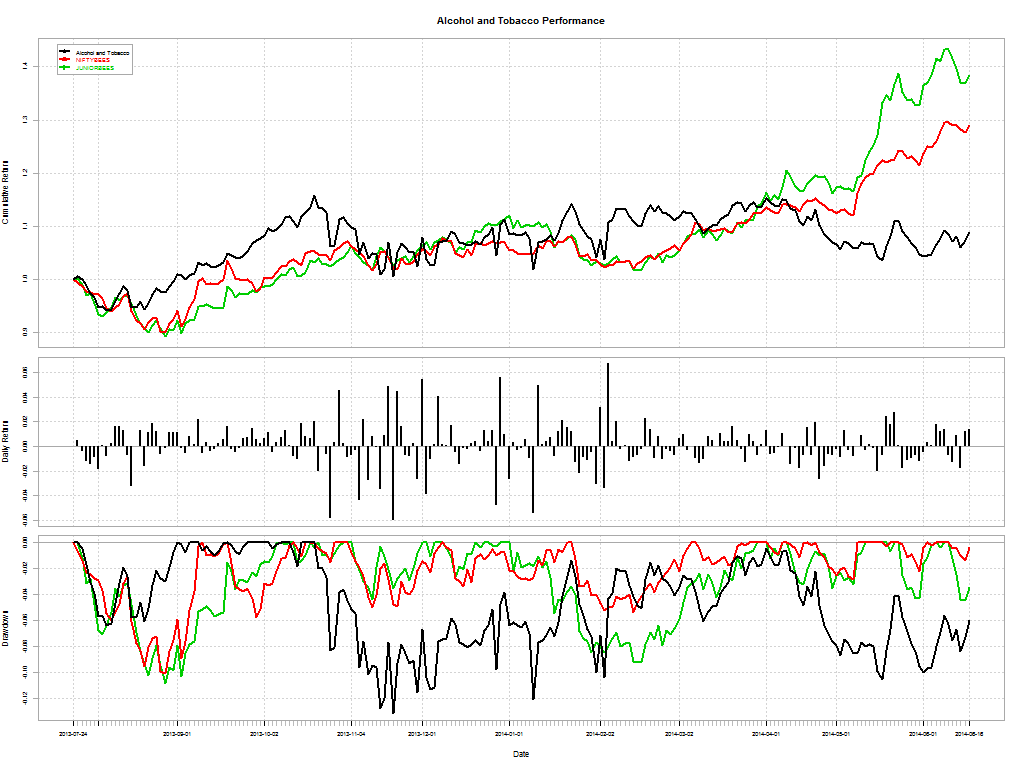
Smart beta strategies – Themes – are countercyclical, periodically rebalancing out of winning stocks and into losers. They may underperform for extended periods but they ultimately tend to prevail.
Investors’ procyclical behavior, selling recent losers and buying recent winners, pays for the long-term value added by Themes.
Source: Slugging It Out in the Equity Arena
To see how Themes have performed, follow the trail: http://stockviz.biz/tag/theme/