We are not big fans of IPOs at StockViz (here, here). As an asset class, they are a bit like playing chutes-and-ladders. Even if you manage to roll into a few ladders, there are plenty of chutes that can take you down to zero.
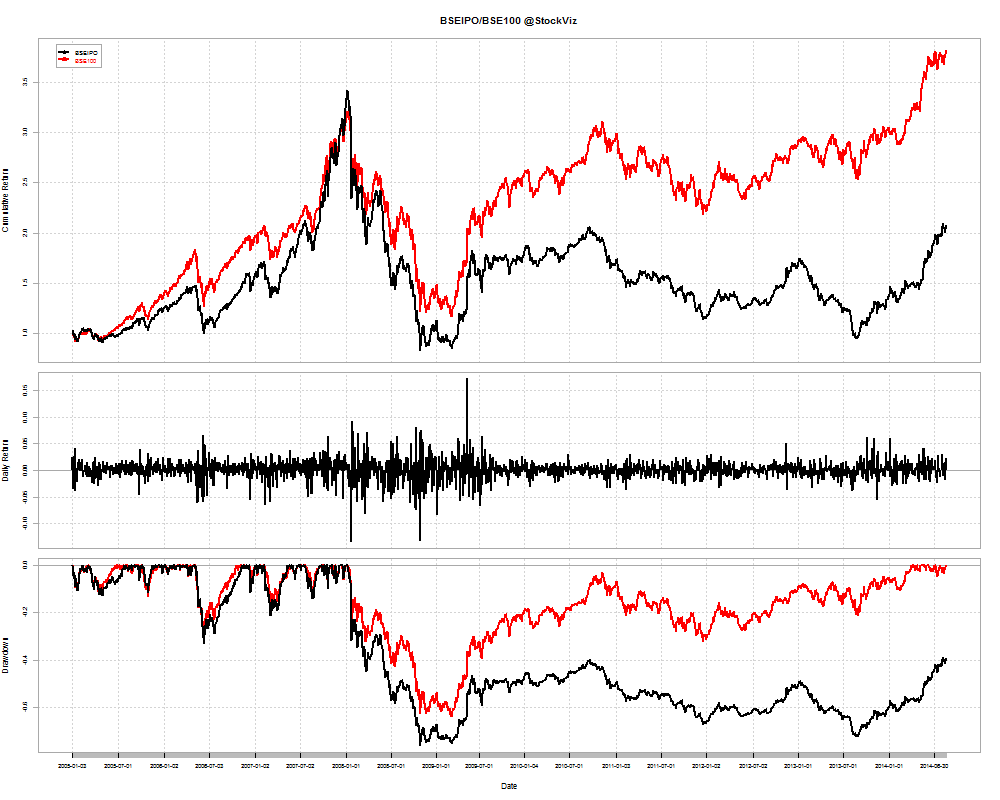
To see if IPOs make sense as an investment, you should compare their returns to a broader index. On one hand, we have the S&P BSE IPO index that tracks the value of companies for two years after listing. And on the other, we have the BSE 100 index that tracks the top 100 stocks my market value. By comparing the returns of the two indices, we can get a fair idea of what we are getting into.
BSE IPO Index 2005-today
A buy-and-hold investor in the index at the beginning of 2005 would still be underwater after the bust of 2008. And to make matters worse, the BSE 100 index has trounced the IPO index.
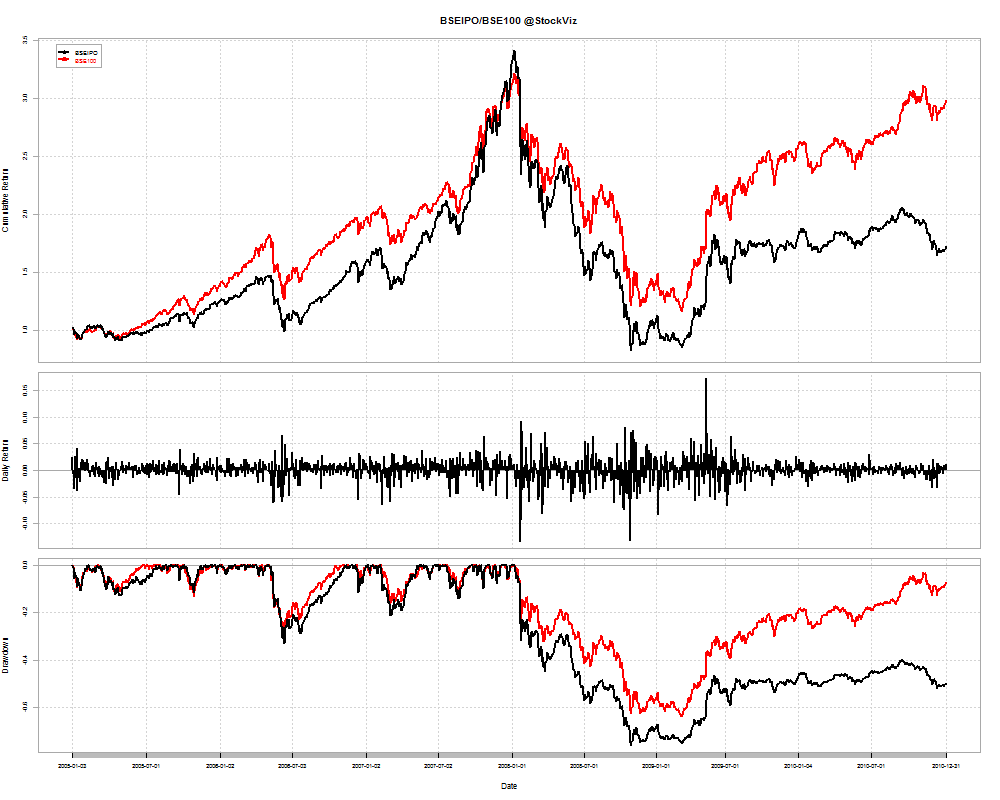
BSE IPO Index 2005-2010
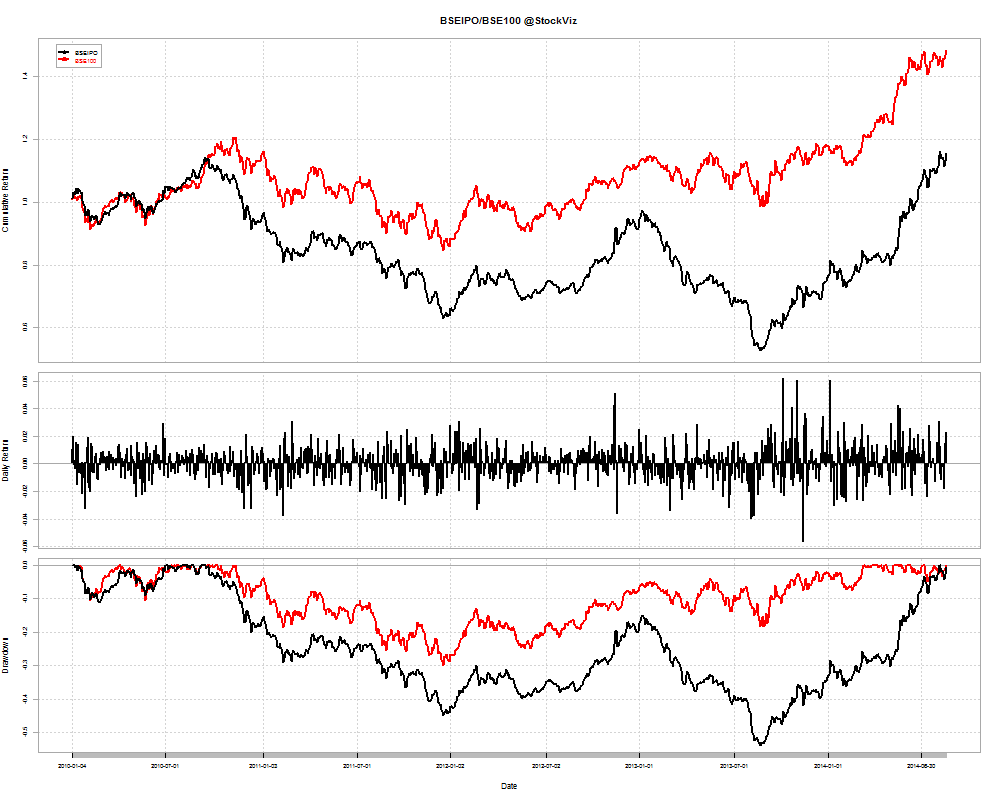
BSE IPO Index 2010-today
IPOs on NSE since 2013
| 8KMILES |
2014-01-29
|
+130.05%
|
| AGARIND |
2014-05-26
|
-45.53%
|
| AGRITECH |
2014-01-28
|
-79.37%
|
| ANKITMETAL |
2013-03-14
|
-65.29%
|
| ARCOTECH |
2014-04-16
|
+109.74%
|
| ATULAUTO |
2013-06-26
|
+277.10%
|
| BUTTERFLY |
2014-04-28
|
-12.57%
|
| CAPLIPOINT |
2014-06-23
|
+123.21%
|
| CASTROLIND |
2014-03-14
|
+19.52%
|
| CEREBRAINT |
2013-06-26
|
-61.25%
|
| CNOVAPETRO |
2014-01-01
|
-9.73%
|
| DUNCANSLTD |
2013-07-05
|
+16.70%
|
| FCEL |
2013-07-04
|
+38.17%
|
| FLFL |
2013-10-01
|
-35.45%
|
| GSCLCEMENT |
2013-05-15
|
+71.76%
|
| GULFCORP |
2014-06-26
|
-13.61%
|
| GULFOILLUB |
2014-07-31
|
+17.04%
|
| HATSUN |
2014-06-20
|
+10.28%
|
| IBULHSGFIN |
2013-07-23
|
+38.09%
|
| INTEGRA |
2013-08-20
|
-64.66%
|
| JPOLYINVST |
2013-11-11
|
+40.20%
|
| JUSTDIAL |
2013-06-05
|
+183.46%
|
| LYPSAGEMS |
2013-11-05
|
+1.31%
|
| MAKE |
2014-06-30
|
+72.51%
|
| MMWL |
2014-03-26
|
+56.67%
|
| MOHITIND |
2013-03-14
|
-38.16%
|
| NAKODA |
2013-03-14
|
-58.05%
|
| NATHBIOGEN |
2014-01-28
|
+632.86%
|
| NGCT |
2013-11-12
|
-32.08%
|
| NIBL |
2013-04-09
|
+214.95%
|
| ORBTEXP |
2013-11-05
|
+112.96%
|
| ORIENTCEM |
2013-07-12
|
+105.70%
|
| PFRL |
2013-07-17
|
-33.22%
|
| PILIND |
2013-10-07
|
+230.77%
|
| REPCOHOME |
2013-04-01
|
+172.19%
|
| SDBL |
2014-03-18
|
-13.60%
|
| SFCL |
2013-10-24
|
+72.90%
|
| SREEL |
2014-01-01
|
-11.07%
|
| SUJANATWR |
2013-09-11
|
+103.87%
|
| VIMALOIL |
2013-05-21
|
+75.39%
|
| VIVIDHA |
2013-05-21
|
-3.51%
|
| VMART |
2013-02-20
|
+91.39%
|
| WELENTRP |
2014-07-11
|
+221.25%
|
| WONDERLA |
2014-05-09
|
+80.04%
|
There have been twice as many winners as losers since 2013 and the chatter around the ‘IPO market heating up’ has been getting louder. However, investors would do well to keep the big picture in mind before jumping into that hot new IPO that their brokers are selling.
You can track the latest IPO news here.