Equities
| MINTs | |
|---|---|
| JCI(IDN) | -3.46% |
| INMEX(MEX) | -2.65% |
| NGSEINDX(NGA) | -1.86% |
| XU030(TUR) | -0.82% |
| BRICS | |
|---|---|
| IBOV(BRA) | +4.47% |
| SHCOMP(CHN) | +0.45% |
| NIFTY(IND) | -1.08% |
| INDEXCF(RUS) | -2.55% |
| TOP40(ZAF) | -4.05% |
Commodities
| Energy | |
|---|---|
| Brent Crude Oil | -4.18% |
| Ethanol | +4.04% |
| Heating Oil | -3.48% |
| Natural Gas | -4.43% |
| RBOB Gasoline | -7.66% |
| WTI Crude Oil | -5.83% |
| Metals | |
|---|---|
| Copper | +0.00% |
| Gold 100oz | +0.69% |
| Palladium | +0.44% |
| Platinum | -1.99% |
| Silver 5000oz | +0.58% |
Currencies
| MINTs | |
|---|---|
| USDIDR(IDN) | +0.72% |
| USDMXN(MEX) | +0.18% |
| USDNGN(NGA) | +0.49% |
| USDTRY(TUR) | +0.20% |
| BRICS | |
|---|---|
| USDBRL(BRA) | -2.06% |
| USDCNY(CHN) | -0.14% |
| USDINR(IND) | -0.45% |
| USDRUB(RUS) | +1.70% |
| USDZAR(ZAF) | -1.23% |
| Agricultural | |
|---|---|
| Cattle | +1.77% |
| Cocoa | +1.08% |
| Coffee (Arabica) | +10.84% |
| Coffee (Robusta) | +5.01% |
| Corn | +4.28% |
| Cotton | +3.95% |
| Feeder Cattle | +0.92% |
| Lean Hogs | +1.99% |
| Lumber | +0.38% |
| Orange Juice | -3.85% |
| Soybean Meal | +10.54% |
| Soybeans | +0.60% |
| Sugar #11 | +3.25% |
| Wheat | +4.13% |
| White Sugar | +1.08% |
Credit Indices
| Index | Change |
|---|---|
| Markit CDX EM | -14.82% |
| Markit CDX NA IG | +2.60% |
| Markit CDX NA IG HVOL | +22.00% |
| Markit iTraxx Asia ex-Japan IG | +18.07% |
| Markit iTraxx Australia | +11.93% |
| Markit iTraxx Europe | +4.57% |
| Markit iTraxx Europe Crossover | +93.24% |
| Markit iTraxx Japan | +7.25% |
| Markit iTraxx SovX Western Europe | -0.82% |
| Markit LCDX (Loan CDS) | -0.17% |
| Markit MCDX (Municipal CDS) | +3.90% |
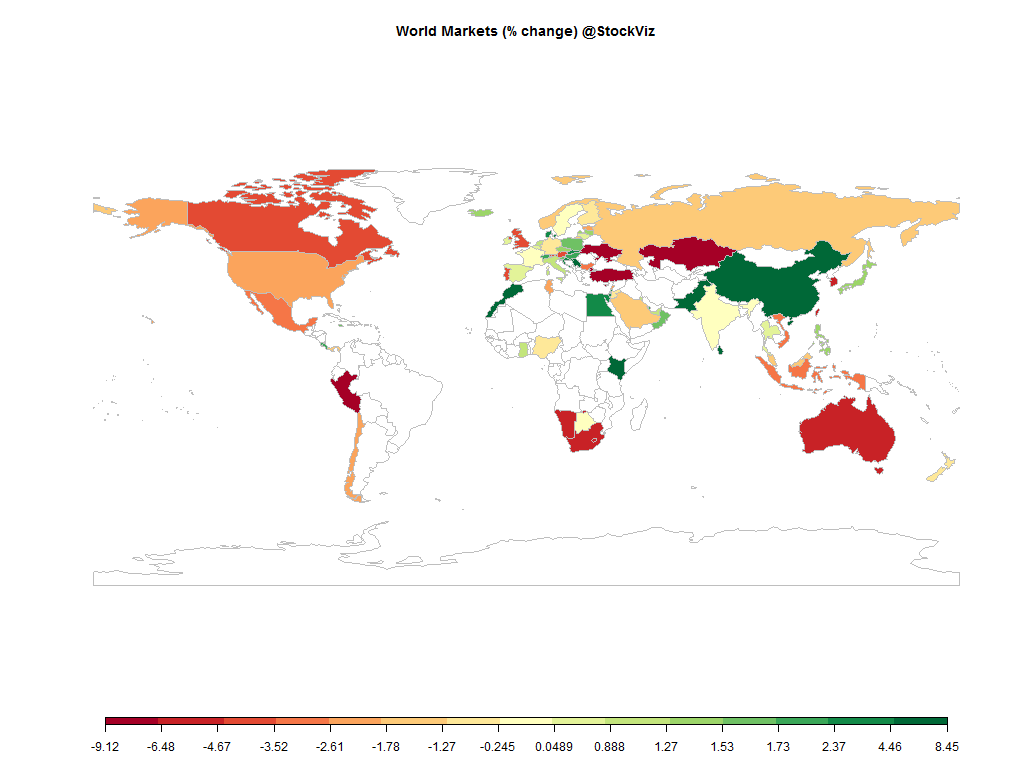
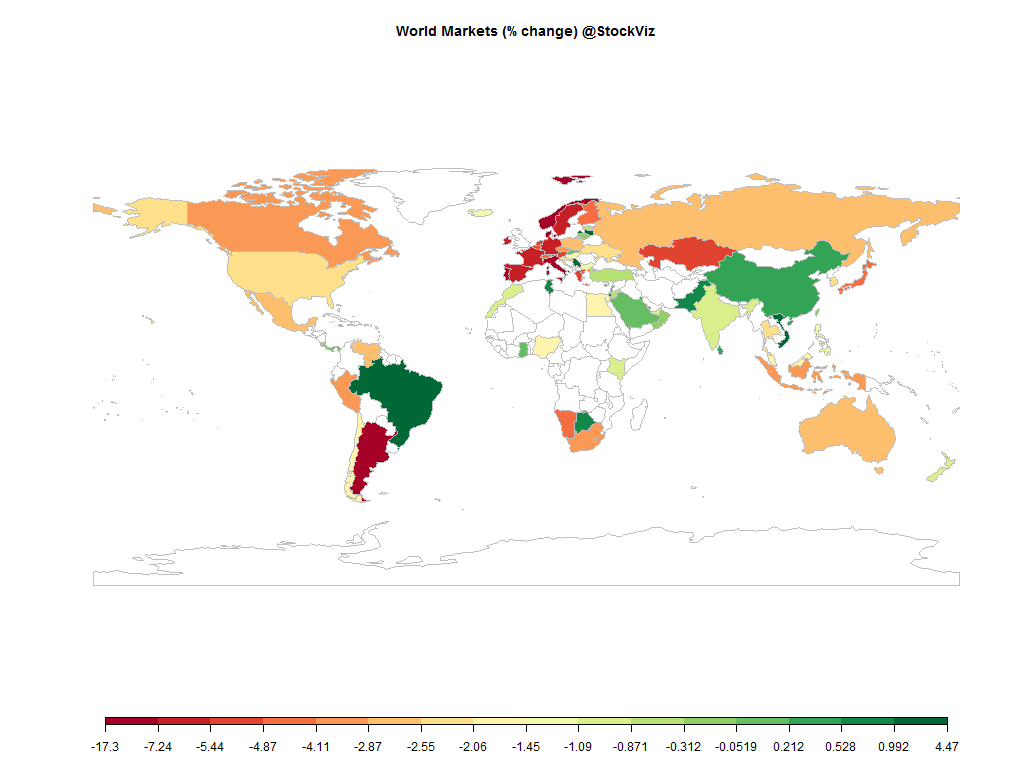
Markets seesawed between “good news is bad news” (US recovery means end of ZIRP) and “bad news is bad news” (slowing global growth) resulting in some serious whiplash. Credit blew out, European markets tanked and oil got crushed…
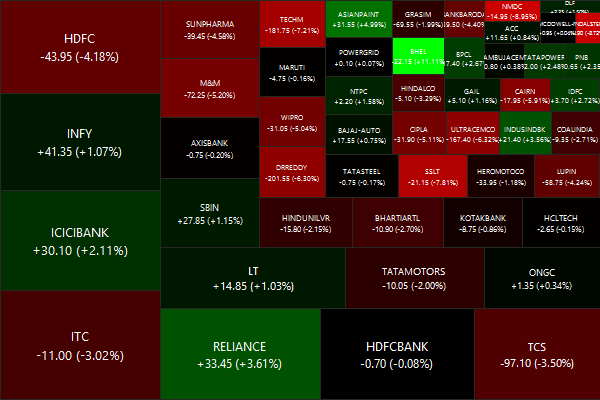
Nifty Heatmap
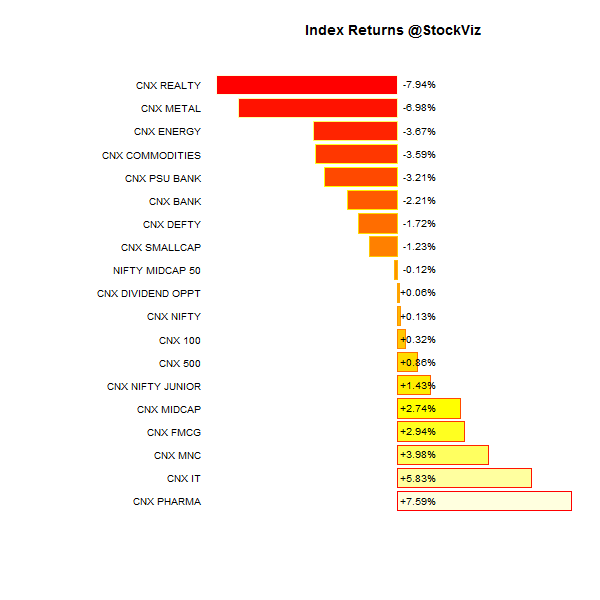
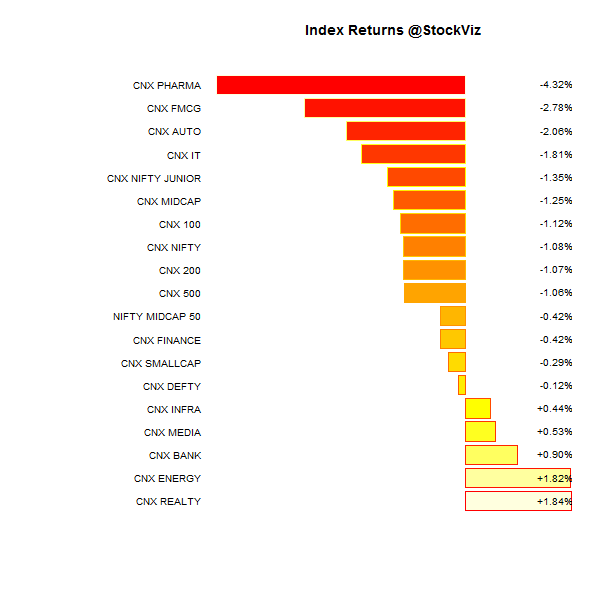
Index Returns
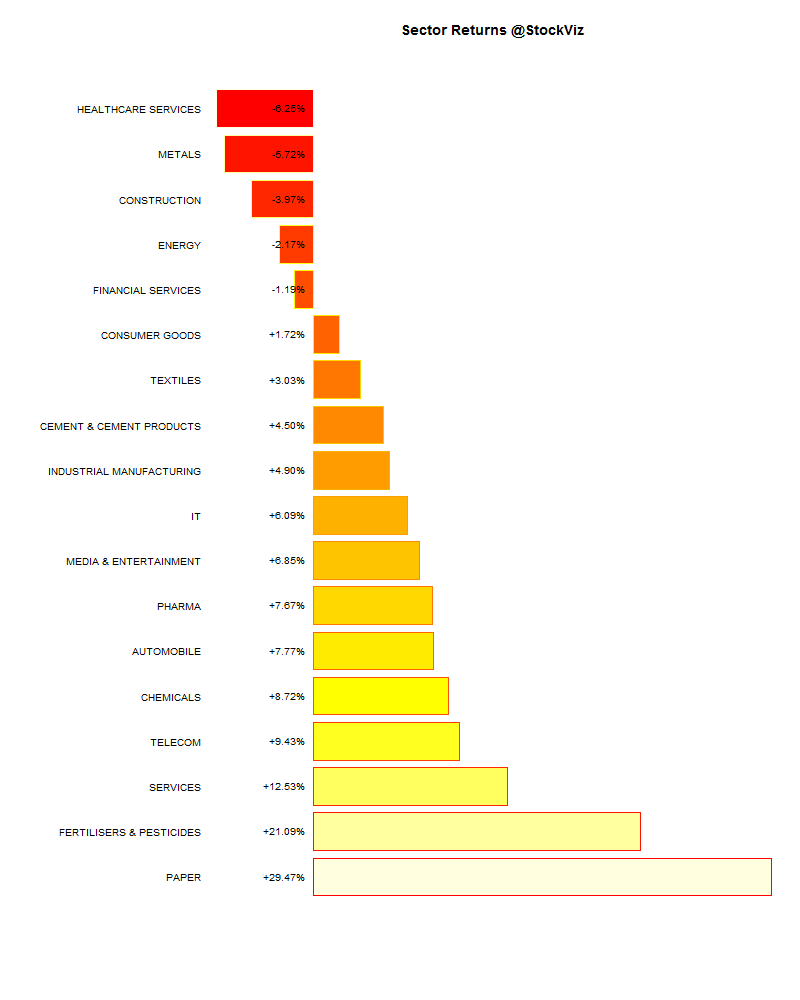
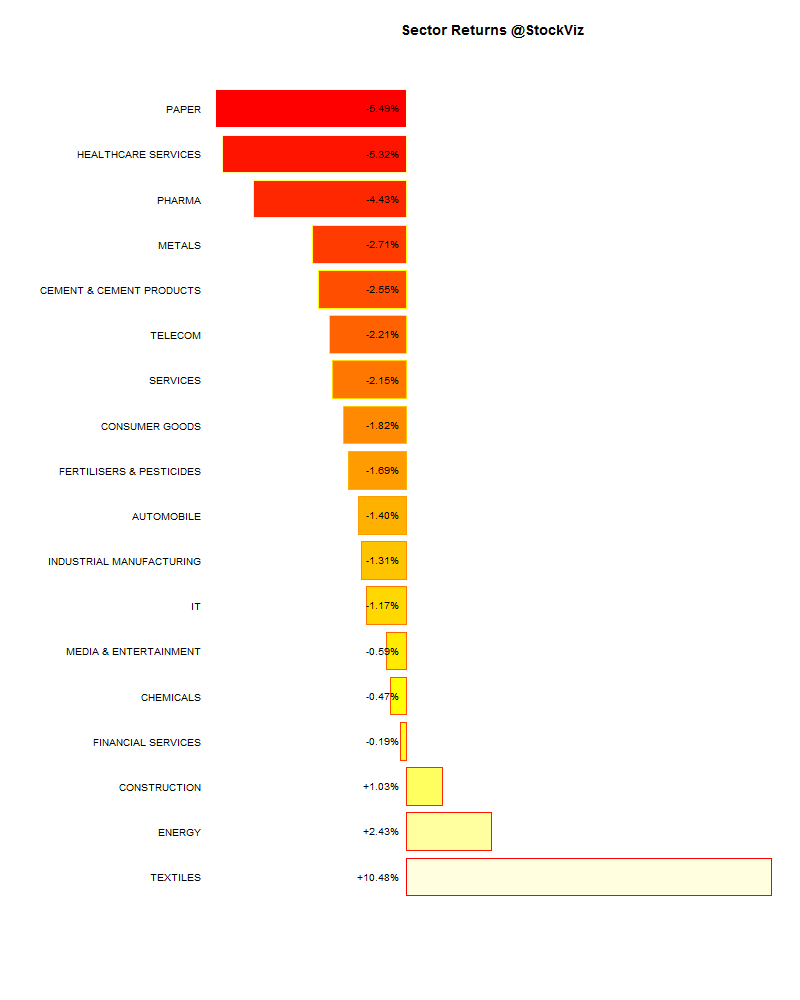
Sector Performance
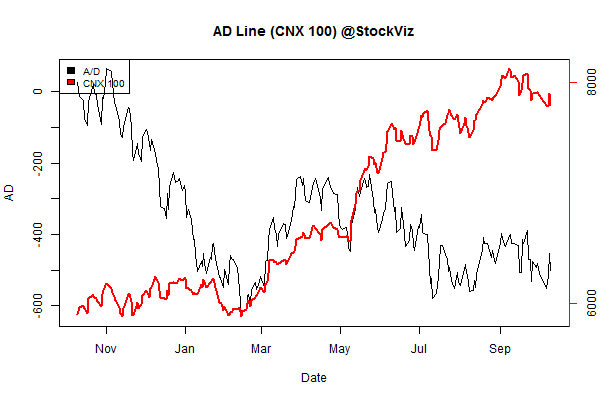
Advance Decline
Market cap decile performance
| Decile | Mkt. Cap. | Adv/Decl |
|---|---|---|
| 1 (micro) | -6.80% | 69/66 |
| 2 | -2.31% | 63/70 |
| 3 | -0.18% | 66/69 |
| 4 | -2.54% | 65/70 |
| 5 | +0.24% | 62/72 |
| 6 | -1.06% | 60/75 |
| 7 | +0.00% | 72/63 |
| 8 | -0.35% | 74/61 |
| 9 | -0.53% | 66/69 |
| 10 (mega) | -1.15% | 66/69 |
Small-caps bore the brunt of the market correction.
Top winners and losers
JSPL continued to get pummeled, it is now -38.74% for the year.
ETFs
| GOLDBEES | +0.67% |
| BANKBEES | +0.45% |
| INFRABEES | +0.45% |
| CPSEETF | -0.41% |
| NIFTYBEES | -1.03% |
| PSUBNKBEES | -1.09% |
| JUNIORBEES | -3.01% |
Negative for the most part…
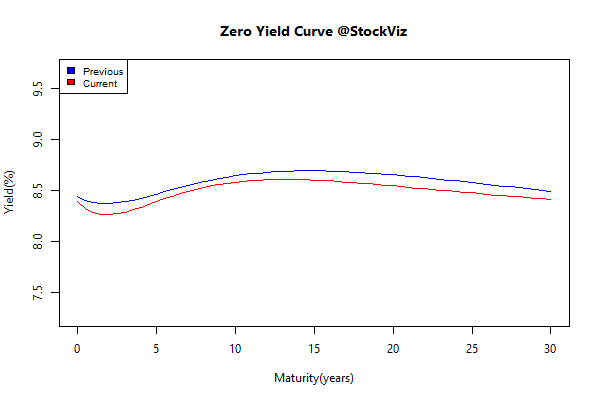
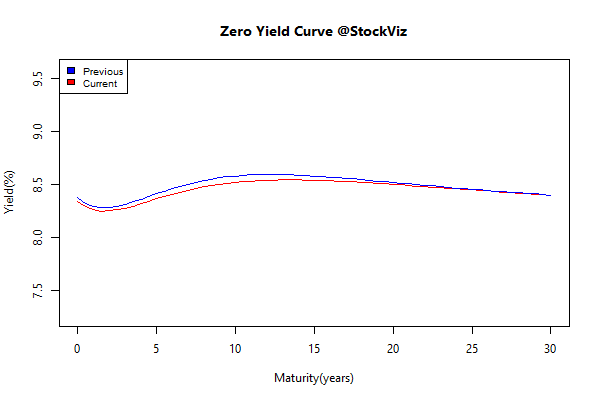
Yield Curve
Bond Indices
| Sub Index | Change in YTM | Total Return(%) |
|---|---|---|
| GSEC TB | -0.03 | +0.21% |
| GSEC SUB 1-3 | +0.04 | +0.36% |
| GSEC SUB 3-8 | -0.06 | +0.66% |
| GSEC SUB 8 | +0.05 | -0.04% |
The long end was affected by RBI’s OMO – apparently they were mopping up excess liquidity…
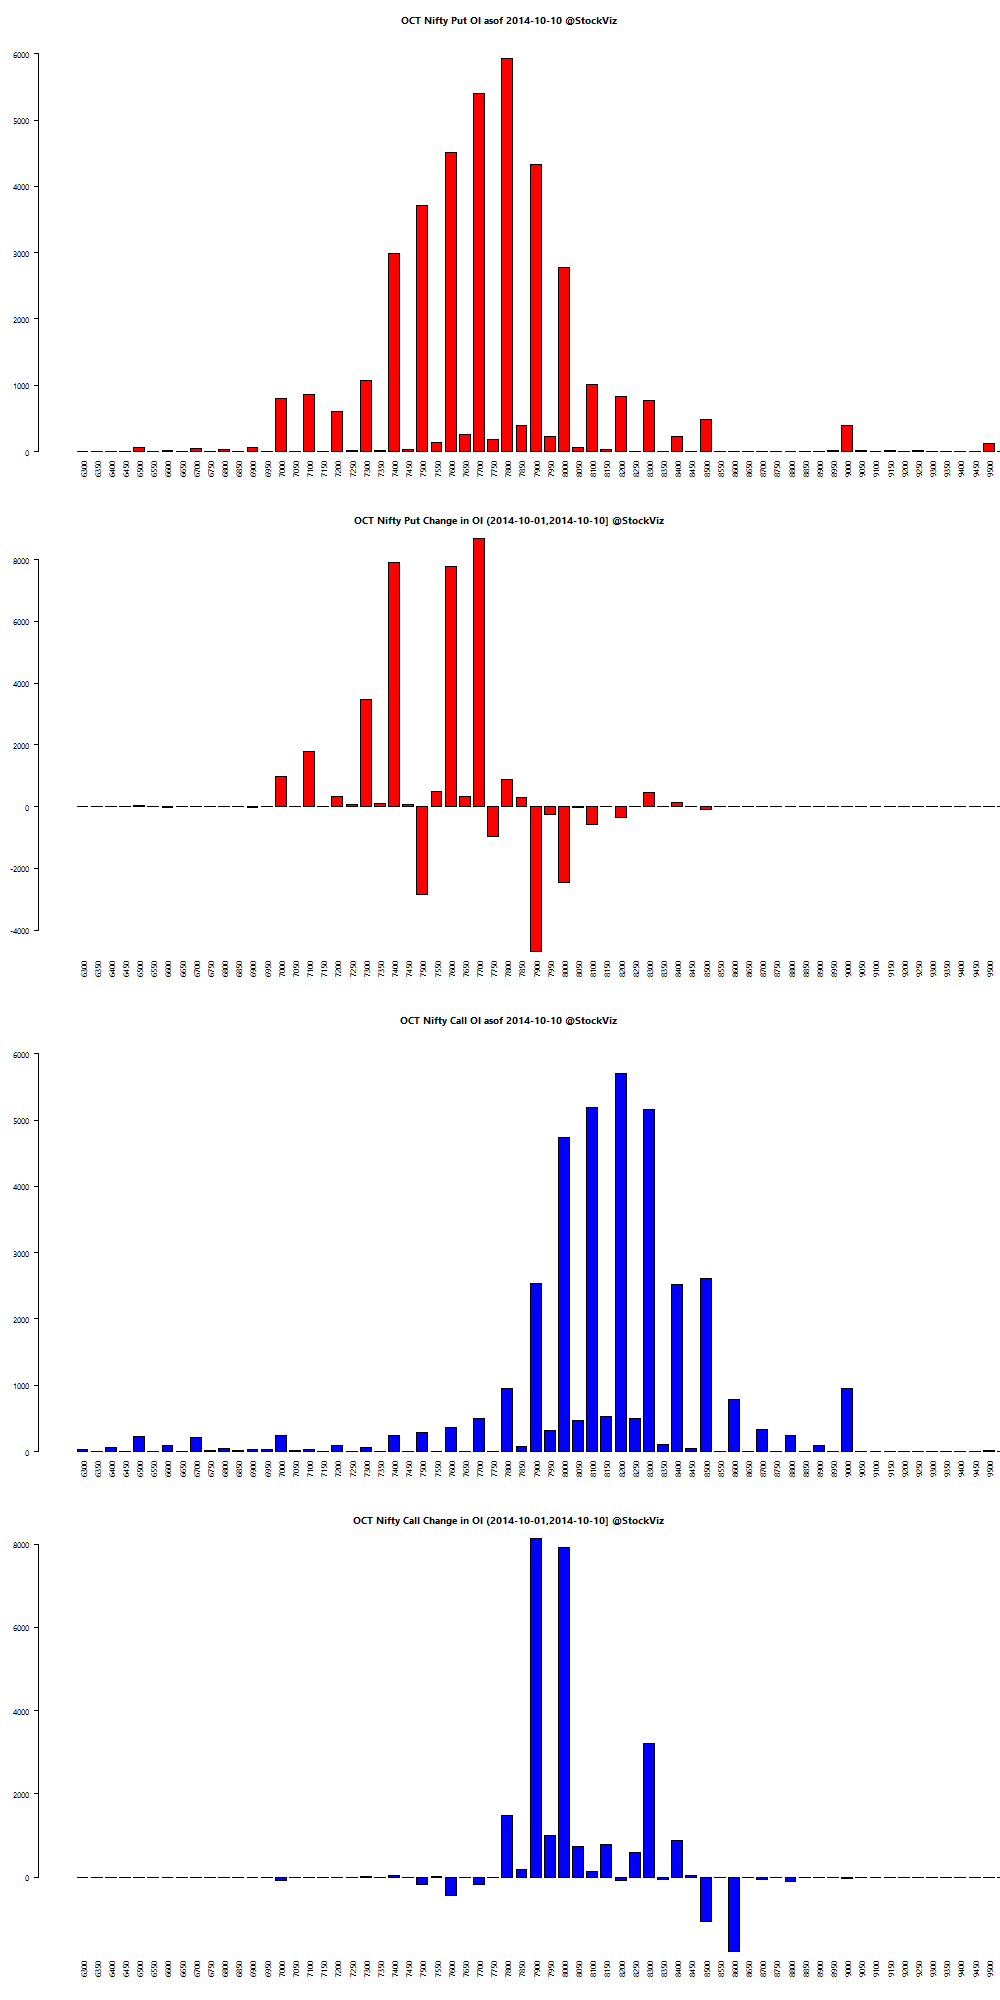
Nifty OI
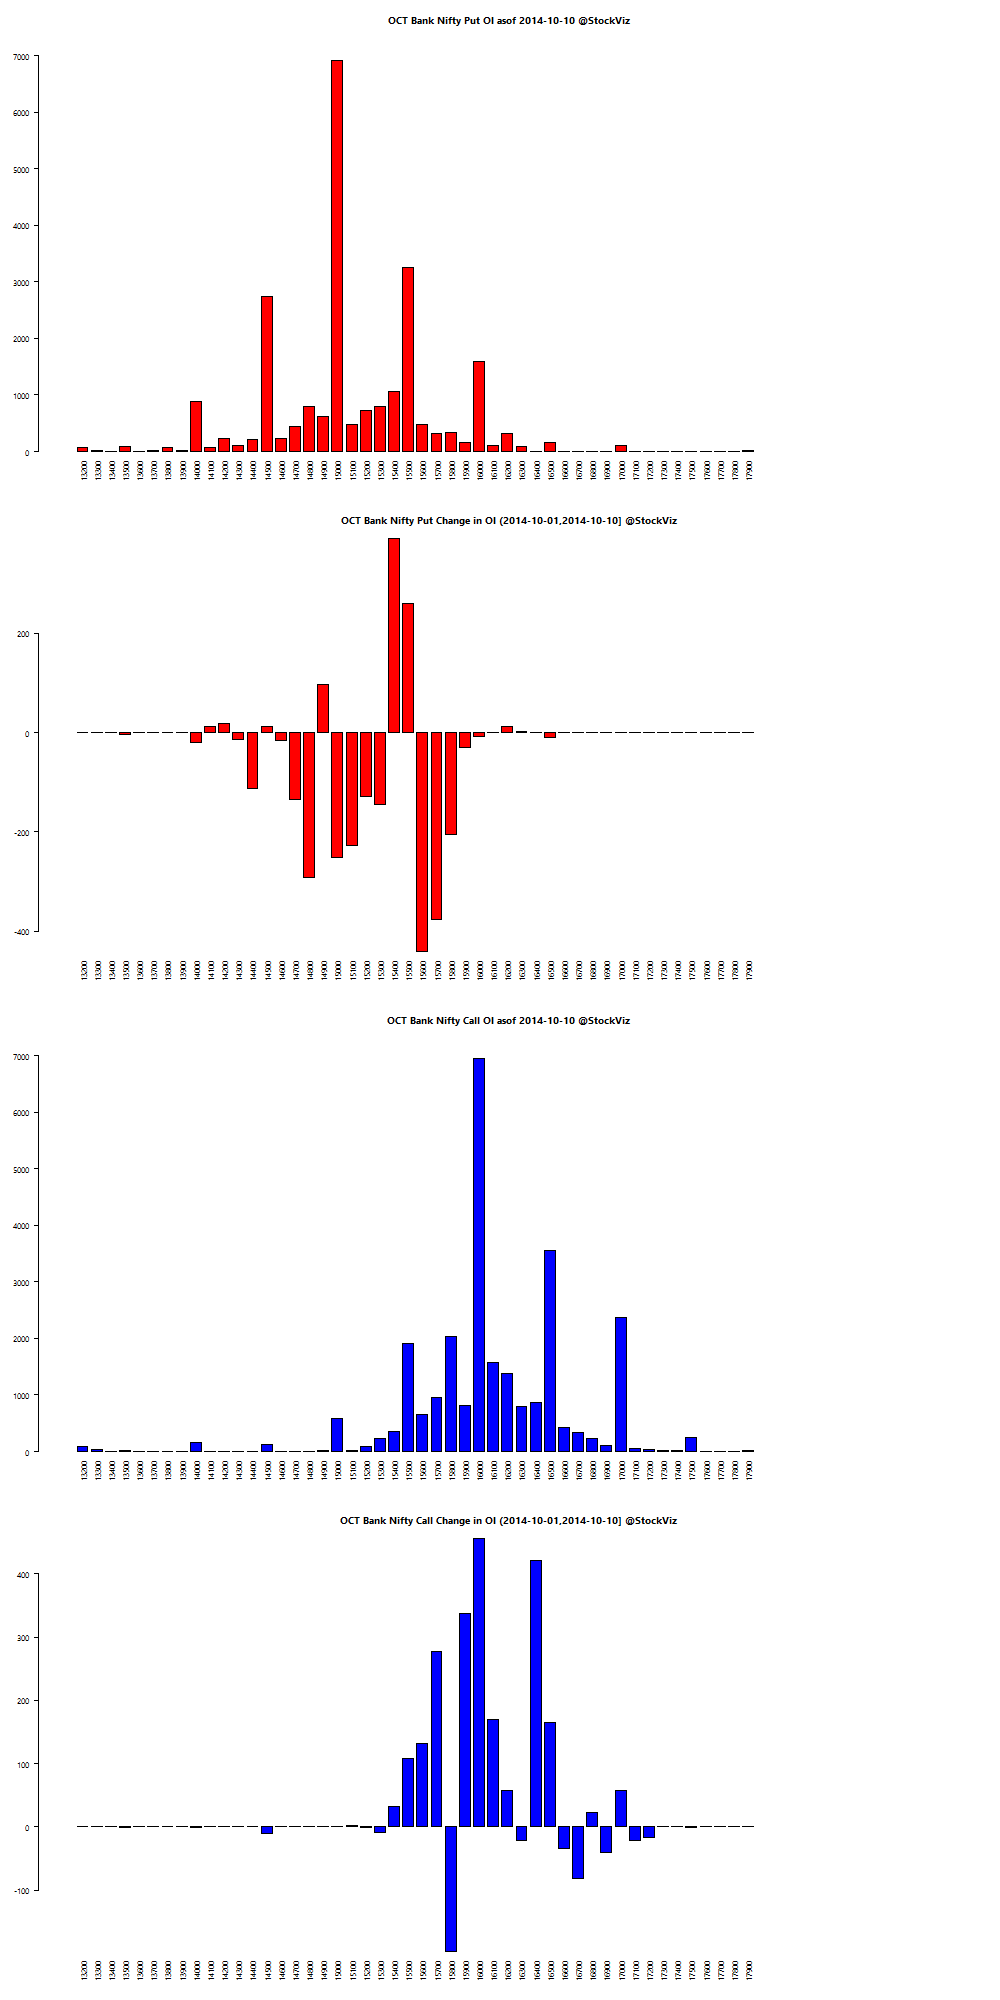
Bank Nifty OI
Theme Performance
| Industrial Value | +2.24% |
| Market Fliers | +1.65% |
| Old Economy Value | +0.60% |
| Momentum 200 | +0.44% |
| Quality to Price | +0.33% |
| Auto | +0.06% |
| The Other Value | -0.16% |
| Balance-sheet Strength | -0.19% |
| ADAG Mania | -0.23% |
| Growth with Moat | -0.41% |
| Piotroski ROC Small Caps | -1.10% |
| Magic Formula Investing | -1.47% |
| IT 3rd Benchers | -1.62% |
| Efficient Growth | -1.85% |
| Refract: PPFAS Long Term Value Fund | -2.36% |
| CNX 100 50-Day Tactical | -2.53% |
| Enterprise Yield | -2.88% |
| Financial Strength Value | -2.89% |
| Market Elephants | -2.99% |
Momentum carried through this week, but barely. Most themes ended in the red.
Thought for the weekend