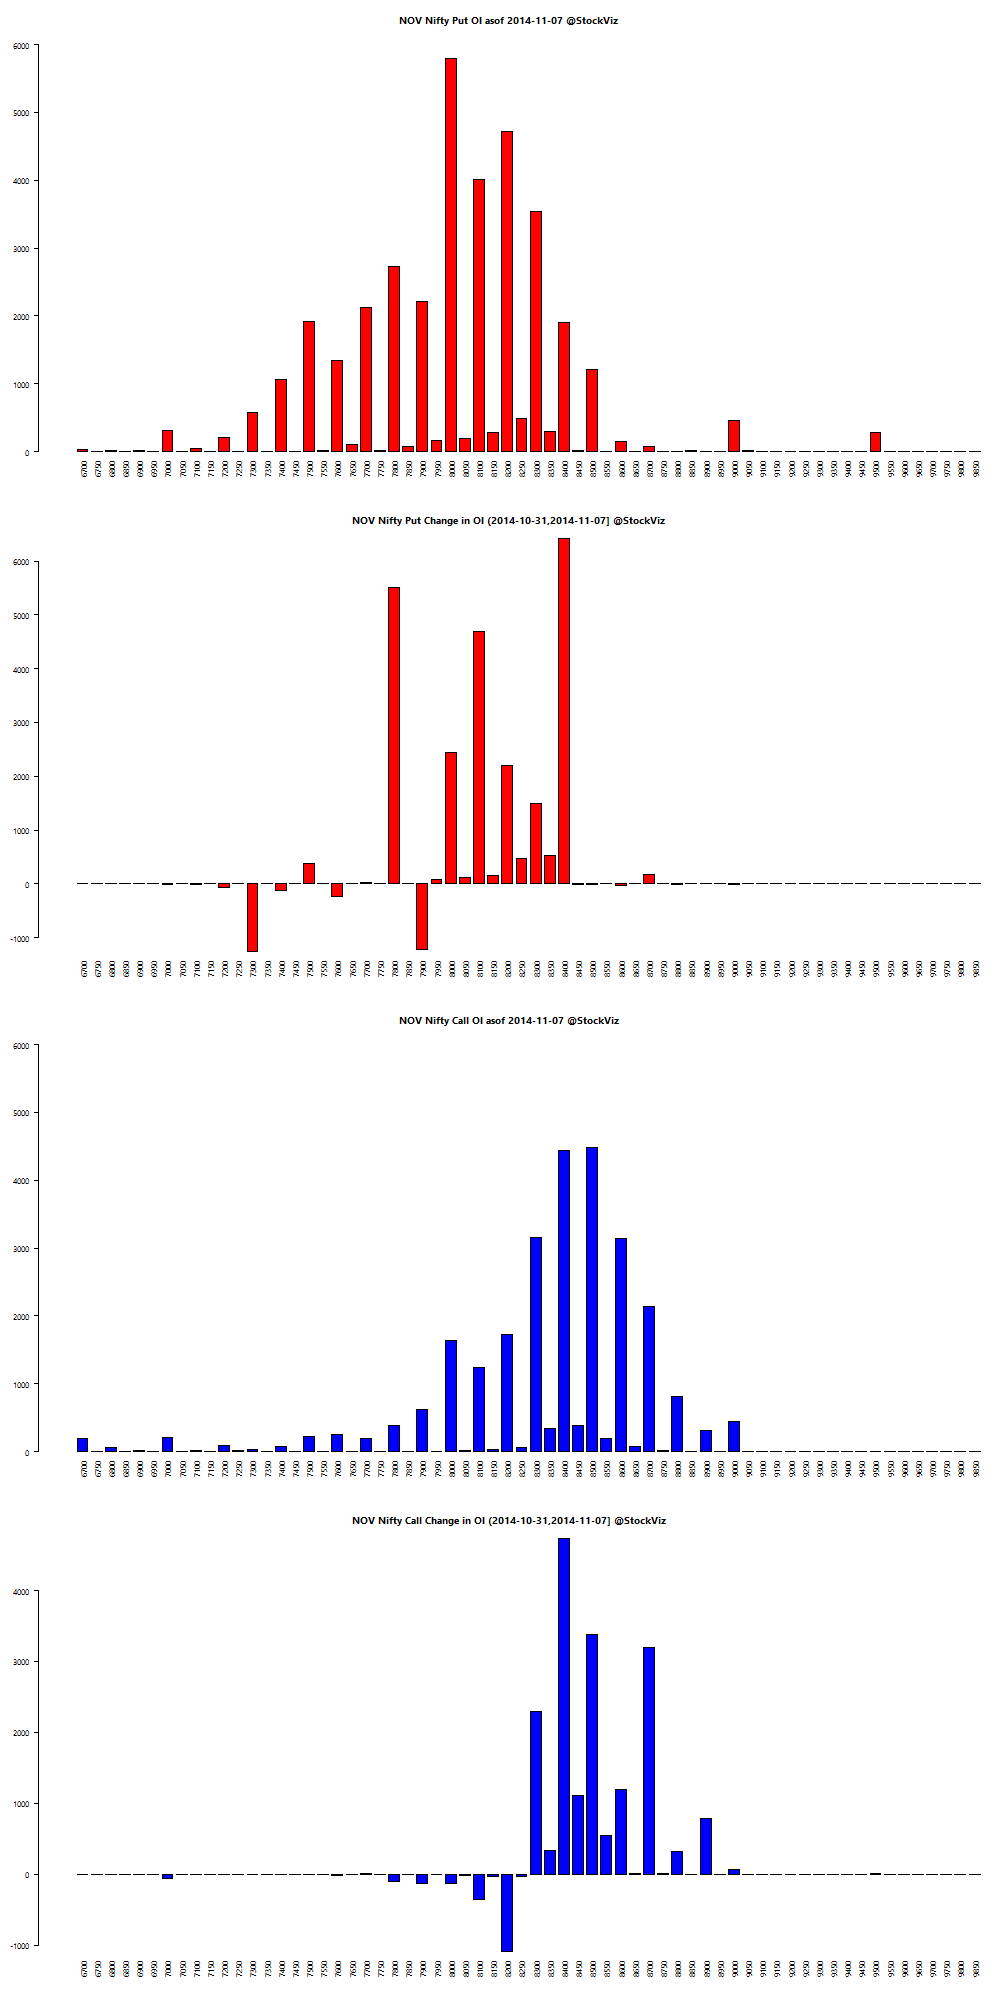
FPIs liking India so far in November
After taking money out of Indian equities in October, looks like FPIs are back in the bid.
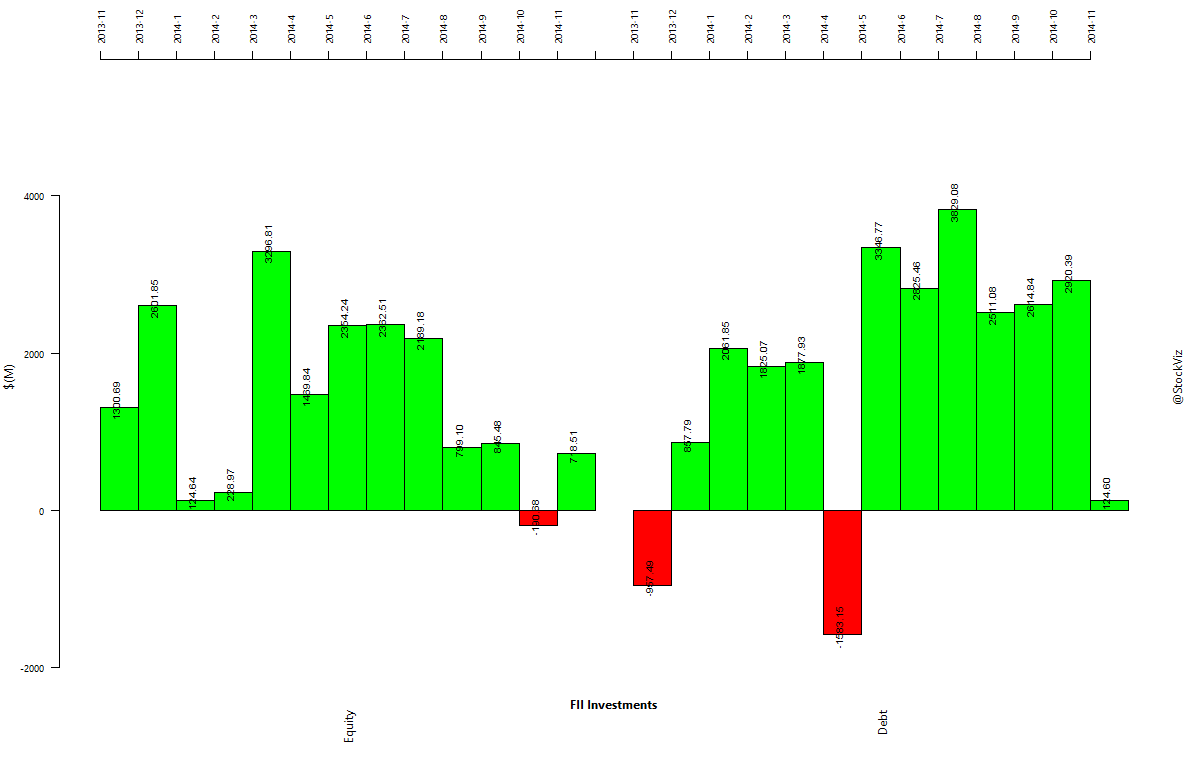
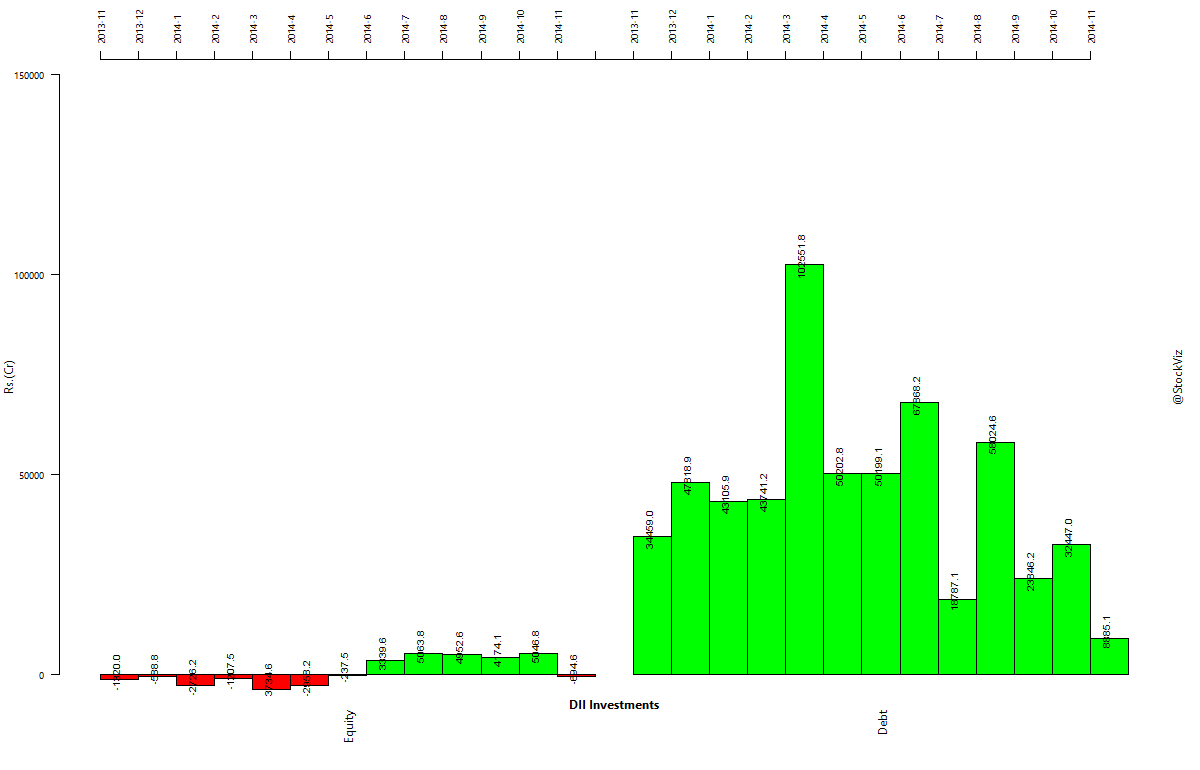
DIIs obsession with debt continues
Previously: FPI and Mutual Fund Investment Charts (August 2014)
Invest Without Emotions
After taking money out of Indian equities in October, looks like FPIs are back in the bid.
Previously: FPI and Mutual Fund Investment Charts (August 2014)
Yesterday, we asked a question: How would an SVM (Support Vector Machine) train if we gave it a 14-day RSI and 50-day SMA of the Nifty index? The goal was to use the SVM to first see if it can figure out a relationship between RSI and NIFTY and then check if we can turn that into a set of trading rules.
If you look at the predictions that the SVM gave for 2006, you can see two distinct areas where it went short (red contours) and where it went long (blue contours.) But the funny thing is, it went long when RSI > 50 (when the market is supposed to be overbought) and short when RSI < 40 (supposed to be oversold.)
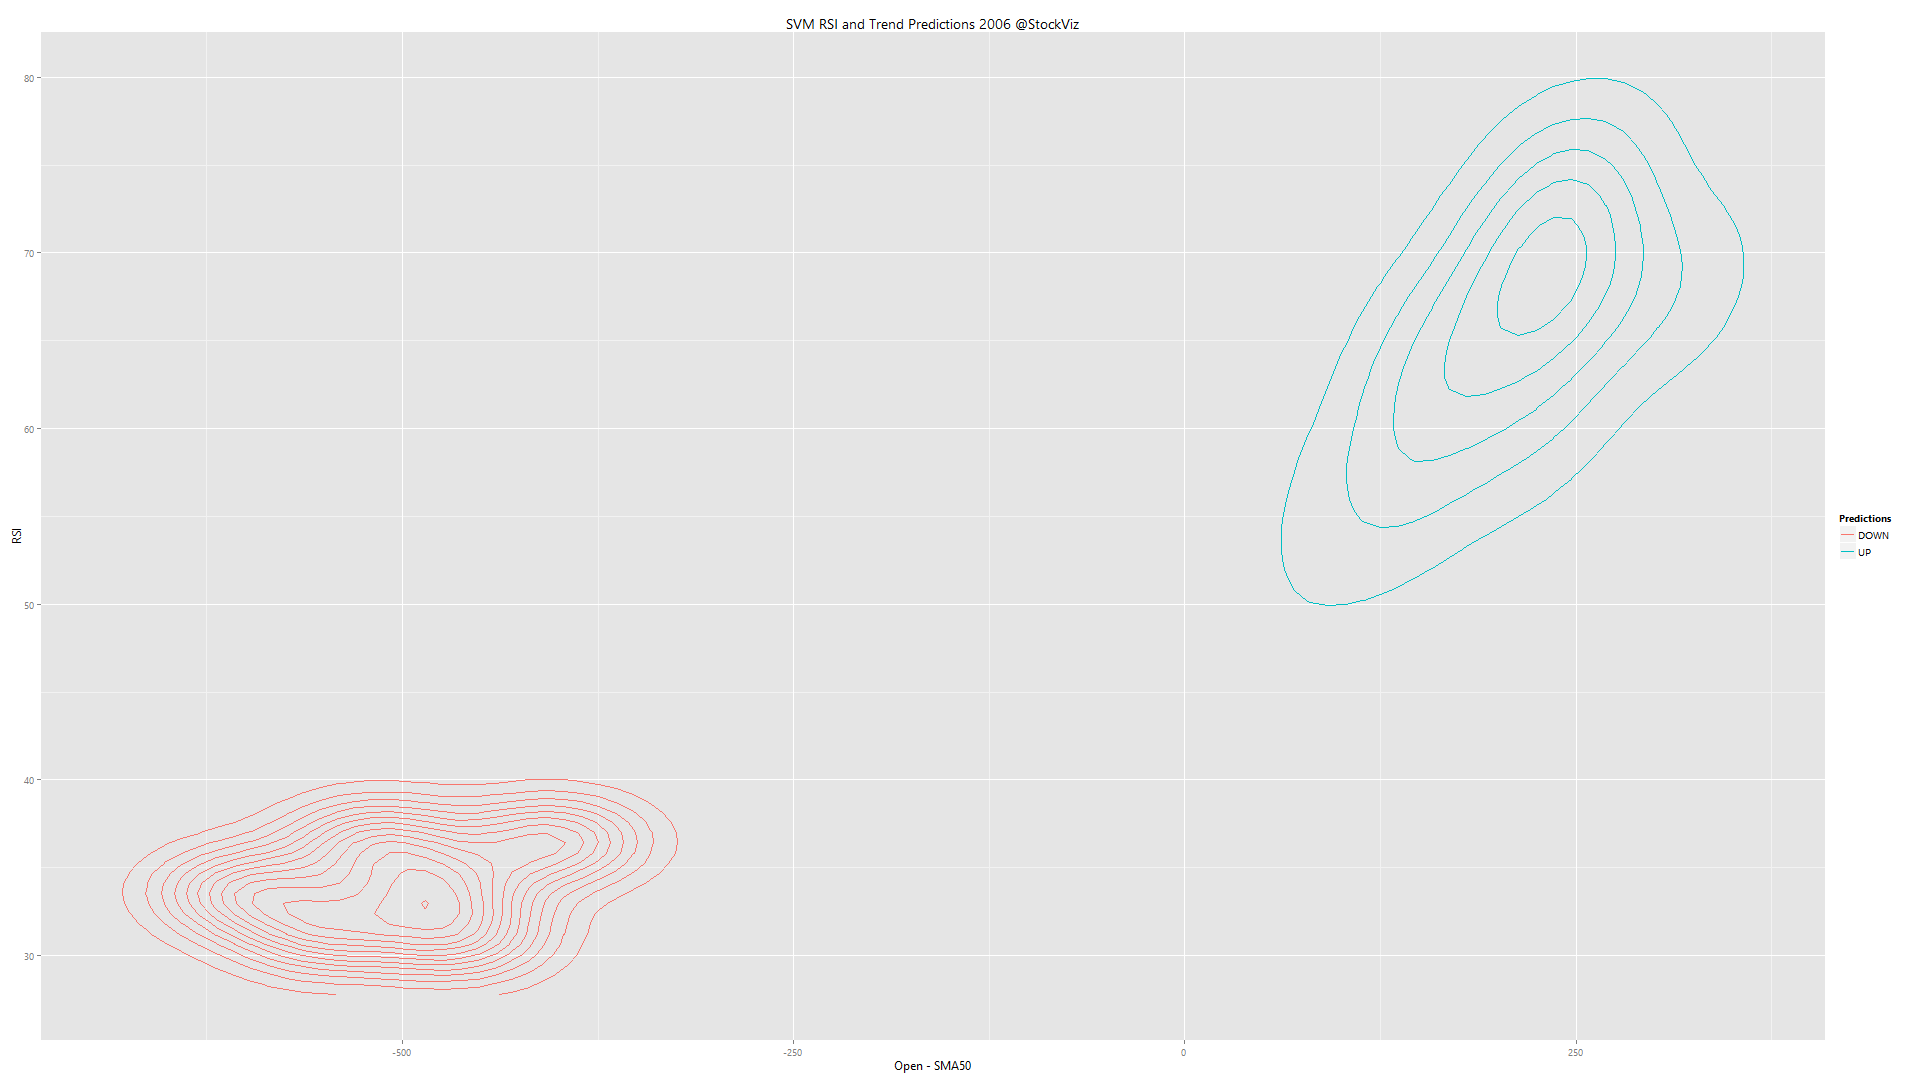
The kicker is that it followed the trend (x-axis) more than RSI (y-axis). In terms of predictive power, trend seems to be way more powerful than RSI, at least for the year 2006.
To check if we can actually setup any trading rules (trend x RSI = 4 combinations for buy/sell), we ran yearly training data through an SVM to check if there were any stable relationships. Here’s the video:
The contours change year to year, with little stability between them. Basically, a trading strategy based on RSI is going to be random.
| MINTs | |
|---|---|
| JCI(IDN) | -2.01% |
| INMEX(MEX) | -1.17% |
| NGSEINDX(NGA) | -11.52% |
| XU030(TUR) | -3.38% |
| BRICS | |
|---|---|
| IBOV(BRA) | -1.09% |
| SHCOMP(CHN) | -0.08% |
| NIFTY(IND) | +0.18% |
| INDEXCF(RUS) | +0.58% |
| TOP40(ZAF) | +0.97% |
| Energy | |
|---|---|
| Brent Crude Oil | -2.98% |
| Ethanol | +2.19% |
| Heating Oil | -1.20% |
| Natural Gas | +12.77% |
| RBOB Gasoline | -2.40% |
| WTI Crude Oil | -2.73% |
| Metals | |
|---|---|
| Copper | -0.33% |
| Gold 100oz | -0.03% |
| Palladium | -2.37% |
| Platinum | -1.35% |
| Silver 5000oz | -5.66% |
| MINTs | |
|---|---|
| USDIDR(IDN) | +0.77% |
| USDMXN(MEX) | +0.60% |
| USDNGN(NGA) | +0.06% |
| USDTRY(TUR) | +1.77% |
| BRICS | |
|---|---|
| USDBRL(BRA) | +3.46% |
| USDCNY(CHN) | +0.15% |
| USDINR(IND) | +0.44% |
| USDRUB(RUS) | +8.63% |
| USDZAR(ZAF) | +2.38% |
| Agricultural | |
|---|---|
| Cattle | -1.60% |
| Cocoa | +0.78% |
| Coffee (Arabica) | -2.94% |
| Coffee (Robusta) | -1.56% |
| Corn | -2.33% |
| Cotton | +0.61% |
| Feeder Cattle | +1.73% |
| Lean Hogs | +0.70% |
| Lumber | +0.43% |
| Orange Juice | -5.07% |
| Soybean Meal | +1.32% |
| Soybeans | -2.50% |
| Sugar #11 | -2.06% |
| Wheat | -3.20% |
| White Sugar | -1.04% |
| Index | Change |
|---|---|
| Markit CDX EM | +0.14% |
| Markit CDX NA HY | +0.38% |
| Markit CDX NA IG | -1.85% |
| Markit CDX NA IG HVOL | -0.83% |
| Markit iTraxx Asia ex-Japan IG | -4.08% |
| Markit iTraxx Australia | -2.75% |
| Markit iTraxx Europe | -2.67% |
| Markit iTraxx Europe Crossover | -8.85% |
| Markit iTraxx Japan | -4.21% |
| Markit iTraxx SovX Western Europe | -0.66% |
| Markit LCDX (Loan CDS) | +0.04% |
| Markit MCDX (Municipal CDS) | -2.00% |
| Decile | Mkt. Cap. | Adv/Decl |
|---|---|---|
| 1 (micro) | -0.08% | 72/68 |
| 2 | +3.25% | 78/61 |
| 3 | +3.16% | 77/62 |
| 4 | +3.00% | 70/69 |
| 5 | +2.24% | 75/65 |
| 6 | +1.28% | 70/69 |
| 7 | +3.19% | 75/65 |
| 8 | +2.16% | 71/68 |
| 9 | +1.96% | 75/65 |
| 10 (mega) | +0.72% | 70/70 |
| PSUBNKBEES | +2.83% |
| INFRABEES | +2.70% |
| BANKBEES | +1.30% |
| NIFTYBEES | +0.50% |
| JUNIORBEES | -0.79% |
| GOLDBEES | -1.52% |
| CPSEETF | -2.36% |
| Sub Index | Change in YTM | Total Return(%) |
|---|---|---|
| GSEC TB | -0.39 | +0.27% |
| GSEC SUB 1-3 | -0.21 | +0.68% |
| GSEC SUB 3-8 | -0.18 | +0.78% |
| GSEC SUB 8 | -0.07 | +0.81% |
| Momentum 200 | +7.17% |
| The Other Value | +2.95% |
| Auto | +2.84% |
| Growth with Moat | +2.48% |
| Market Fliers | +1.93% |
| Quality to Price | +1.70% |
| IT 3rd Benchers | +1.65% |
| Piotroski ROC Small Caps | +1.12% |
| Refract: PPFAS Long Term Value Fund | +1.02% |
| Market Elephants | +0.92% |
| Efficient Growth | +0.70% |
| Magic Formula Investing | +0.32% |
| Balance-sheet Strength | +0.19% |
| Industrial Value | +0.15% |
| Momentum Long-Short | +0.00% |
| Old Economy Value | -0.03% |
| CNX 100 50-Day Tactical | -0.15% |
| Financial Strength Value | -0.32% |
| ADAG Mania | -0.83% |
| Enterprise Yield | -1.37% |
In poker, due to the inherently probabilistic nature of the game, technically perfect game-play can still lead to a loss, so players of those finite games make sure they keep two kinds of score: actual wins/losses, and a separate score that measures whether or not they played correctly, whatever the outcome.
This separation of technical score-keeping and outcome score-keeping leads to a more dangerous place: score-keeping becoming sufficient to sustain finite-game mindsets even when the game is ambiguous or unclear, and there is no agreement among players about what the goal is.
Money is the classic example of a mechanism for keeping score that is divorced from outcomes.
Read the whole thing here: Don’t Surround Yourself With Smarter People
Conventional wisdom has it that RSI values over 70 to represent overbought market conditions and under 30 to represent oversold market conditions. But where did these numbers, 70 and 30, come from? We already tested two naive RSI strategies that bombed spectacularly. We were curious as to what an SVM (Support Vector Machine) would do if we gave it a 14 day RSI and 50-day SMA of the Nifty index. This is what came out of it:
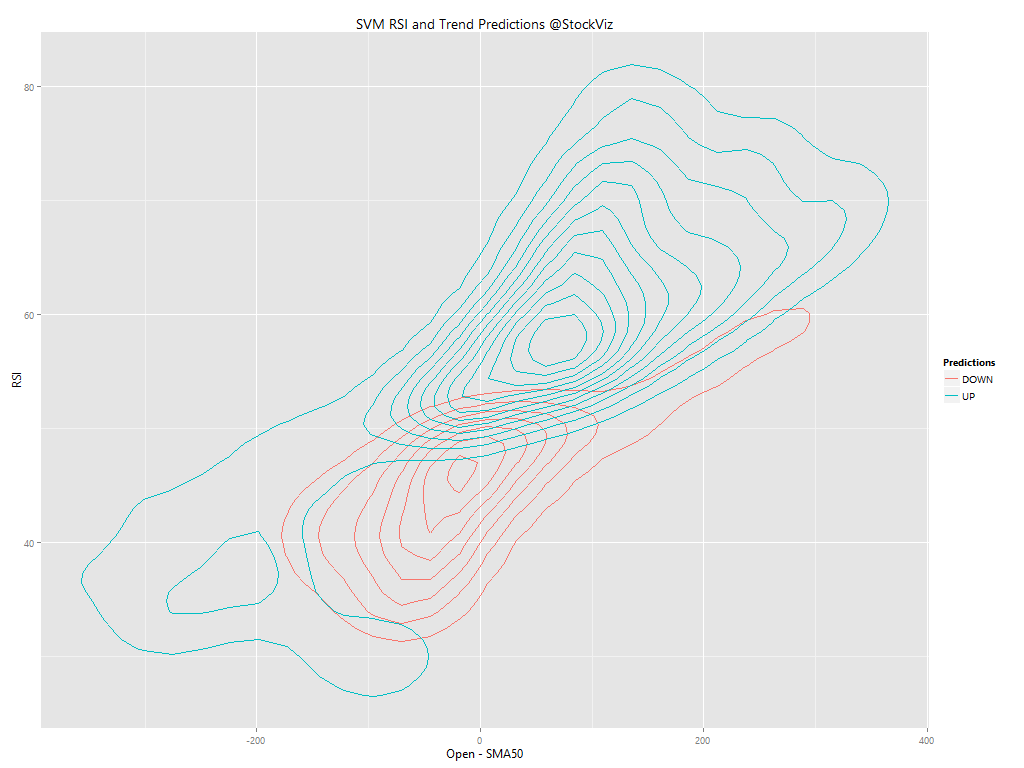
The bifurcation between long and short is pretty well defined. And is seems that trend overshadows RSI. Is RSI even relevant?
| MINTs | |
|---|---|
| JCI(IDN) | -0.93% |
| INMEX(MEX) | +0.17% |
| NGSEINDX(NGA) | -8.88% |
| XU030(TUR) | +8.03% |
| BRICS | |
|---|---|
| IBOV(BRA) | +1.02% |
| SHCOMP(CHN) | +2.38% |
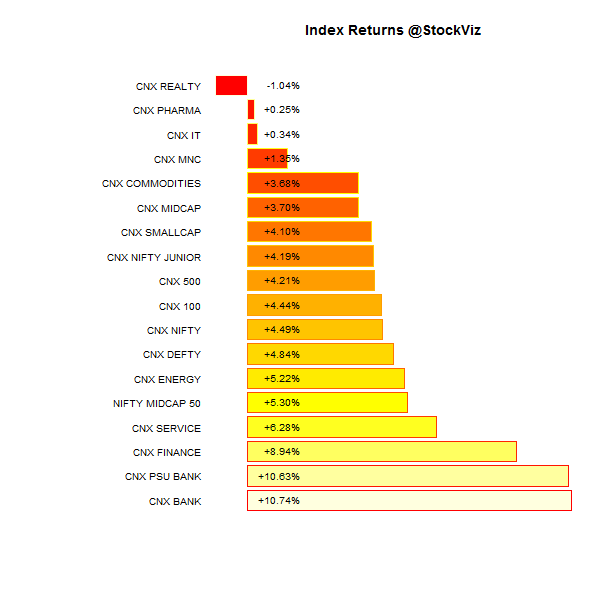
| NIFTY(IND) | +4.49% |
| INDEXCF(RUS) | +5.49% |
| TOP40(ZAF) | +0.51% |
| Energy | |
|---|---|
| Brent Crude Oil | -9.26% |
| Ethanol | +14.37% |
| Heating Oil | -4.74% |
| Natural Gas | -6.14% |
| RBOB Gasoline | -17.18% |
| WTI Crude Oil | -11.32% |
| Metals | |
|---|---|
| Copper | +1.66% |
| Gold 100oz | -3.07% |
| Palladium | +2.58% |
| Platinum | -4.86% |
| Silver 5000oz | -5.92% |
| MINTs | |
|---|---|
| USDIDR(IDN) | -0.84% |
| USDMXN(MEX) | +0.42% |
| USDNGN(NGA) | +1.09% |
| USDTRY(TUR) | -2.41% |
| BRICS | |
|---|---|
| USDBRL(BRA) | +0.95% |
| USDCNY(CHN) | -0.43% |
| USDINR(IND) | -0.64% |
| USDRUB(RUS) | +8.61% |
| USDZAR(ZAF) | -2.23% |
| Agricultural | |
|---|---|
| Cattle | +6.09% |
| Cocoa | -9.56% |
| Coffee (Arabica) | -3.01% |
| Coffee (Robusta) | +4.07% |
| Corn | +17.10% |
| Cotton | +3.77% |
| Feeder Cattle | -0.31% |
| Lean Hogs | -18.14% |
| Lumber | -2.13% |
| Orange Juice | -8.18% |
| Soybean Meal | +25.67% |
| Soybeans | +13.43% |
| Sugar #11 | +3.69% |
| Wheat | +12.00% |
| White Sugar | +0.19% |
| Index | Change |
|---|---|
| Markit CDX EM | -14.84% |
| Markit CDX NA HY | +1.20% |
| Markit CDX NA IG | -1.28% |
| Markit CDX NA IG HVOL | +14.53% |
| Markit iTraxx Asia ex-Japan IG | +10.99% |
| Markit iTraxx Australia | +8.31% |
| Markit iTraxx Europe | +0.54% |
| Markit iTraxx Europe Crossover | +88.89% |
| Markit iTraxx Japan | +9.27% |
| Markit iTraxx SovX Western Europe | +3.06% |
| Markit LCDX (Loan CDS) | -0.30% |
| Markit MCDX (Municipal CDS) | +1.13% |
| Decile | Mkt. Cap. | Adv/Decl |
|---|---|---|
| 1 (micro) | -10.35% | 69/66 |
| 2 | -0.01% | 73/64 |
| 3 | +2.53% | 68/69 |
| 4 | +0.89% | 72/65 |
| 5 | +2.06% | 66/71 |
| 6 | +3.11% | 77/60 |
| 7 | +1.51% | 67/70 |
| 8 | +2.55% | 75/62 |
| 9 | +3.58% | 73/64 |
| 10 (mega) | +4.07% | 72/65 |
| BANKBEES | +11.06% |
| CPSEETF | +7.39% |
| PSUBNKBEES | +5.34% |
| JUNIORBEES | +5.30% |
| INFRABEES | +4.37% |
| NIFTYBEES | +4.21% |
| GOLDBEES | -1.73% |
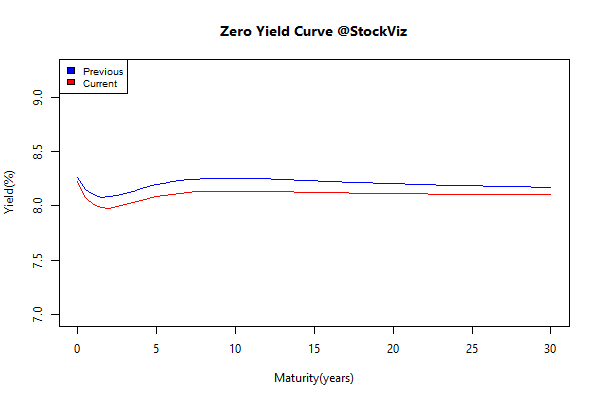
Japan is going to buy foreign bonds. So there:
| Sub Index | Change in YTM | Total Return(%) |
|---|---|---|
| GSEC TB | -0.06 | +0.71% |
| GSEC SUB 1-3 | -0.37 | +0.09% |
| GSEC SUB 3-8 | -0.12 | +0.74% |
| GSEC SUB 8 | -0.12 | +2.38% |
| Market Fliers | +13.11% |
| Industrial Value | +8.45% |
| ADAG Mania | +7.16% |
| Magic Formula Investing | +4.89% |
| Momentum 200 | +4.85% |
| Enterprise Yield | +3.51% |
| Financial Strength Value | +3.11% |
| Auto | +3.08% |
| Growth with Moat | +2.85% |
| Old Economy Value | +2.05% |
| CNX 100 50-Day Tactical | +1.91% |
| Balance-sheet Strength | +0.92% |
| Piotroski ROC Small Caps | +0.87% |
| Efficient Growth | +0.72% |
| Quality to Price | +0.45% |
| Refract: PPFAS Long Term Value Fund | +0.16% |
| Market Elephants | -1.22% |
| The Other Value | -2.17% |
| IT 3rd Benchers | -2.92% |
“Humans hate randomness, the idea that we lack control and don’t really know what the future holds. It stimulates excitement to feel like we are in control of the future.”
And financial news organizations from CNBC to print and digital news outlets are all too happy to give viewers and readers what they seem to want. Besides, if publications, Websites, and television networks simply told investors to buy and hold, with periodic rebalancing, it would be that much harder to fill pages and airtime.
Source: The Timeless Allure of Stock-Market Timers
Related: