Category: Your Money

Smart Beta Strategy Return Analysis

The best part about StockViz Investment Themes is that you can setup a portfolio of stocks that follows a particular strategy. It is a convenient way for you to:

  1. stick to a strategy
  2. follow a preset rebalancing schedule
  3. think in terms of your portfolio strategy rather than individual stocks
  4. avoid common behavioral pitfalls
  5. systematically track your P&L and strategy performance

In StockViz, there are two smart-beta themes: Market Fliers tracks a high-volatility and high-beta portfolio while Market Elephants tracks a low-beta portfolio. Between the two strategies and the Nifty, what should an investor prefer?

Daily Returns

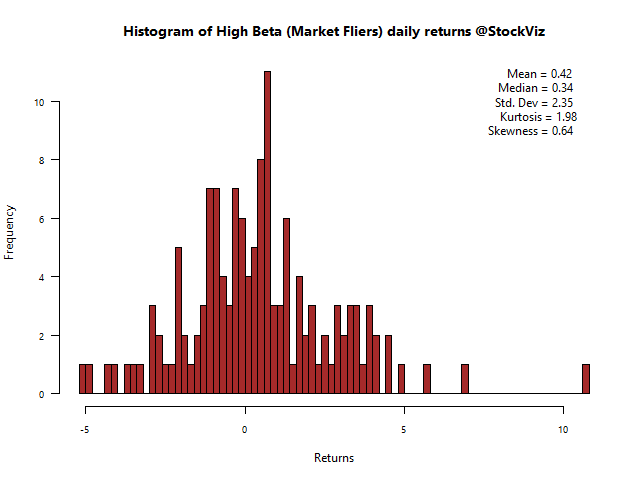
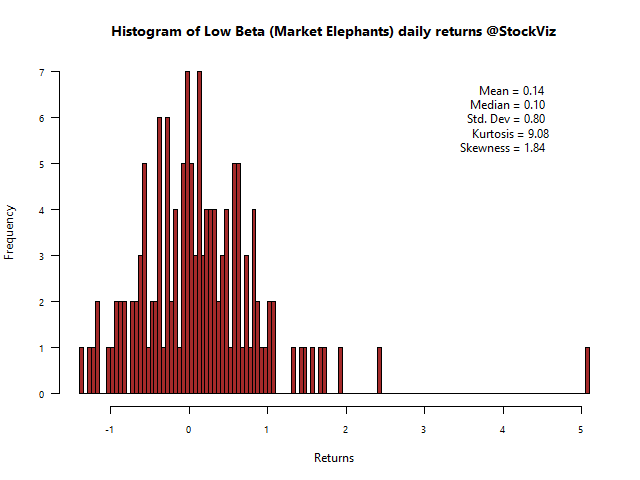
In a bull-market, such as the one we are in, it makes sense to be in a high-beta portfolio. Notice how narrow the low-beta histogram is compared to high-beta, indicating little variation in day-to-day returns. However, you cannot escape the gigantic 10%+ outlier in the Market Fliers.

Nifty
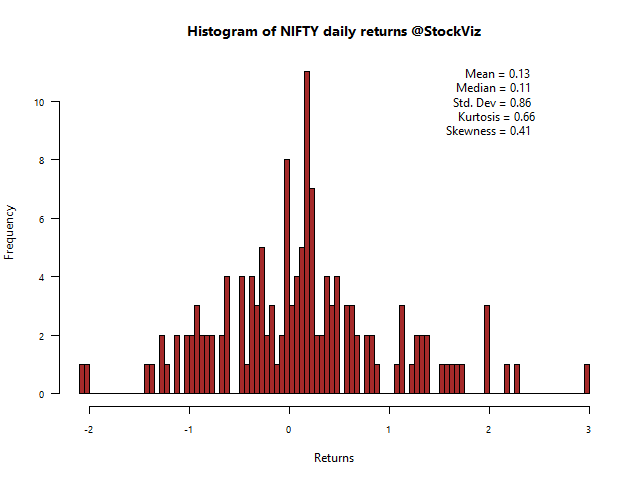
nifty-returns-histogram

High Beta (Market Fliers)

high-beta-returns-histogram

Low Beta (Market Elephants)

low-beta-returns-histogram

Drawdowns

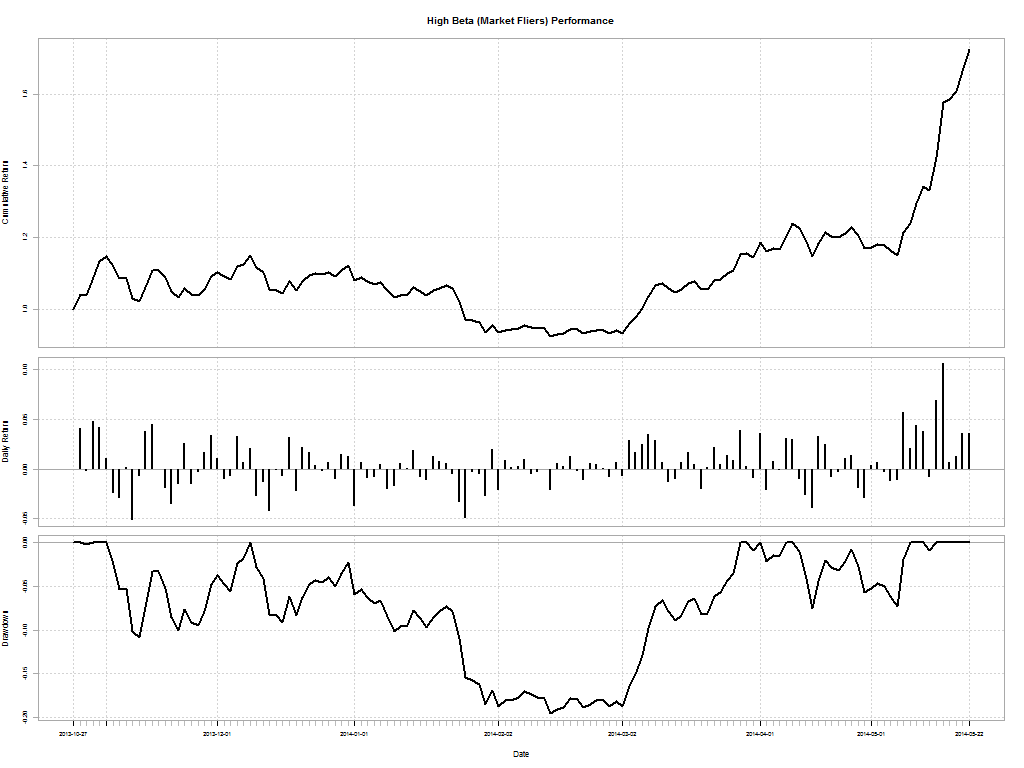
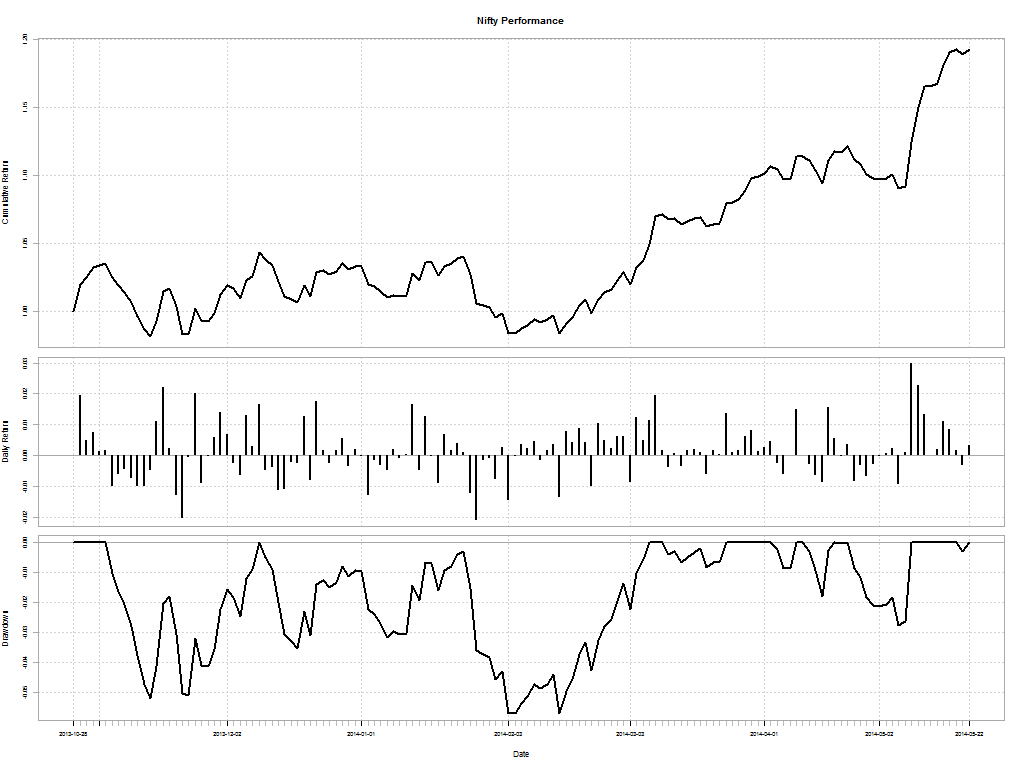
Any investment will have drawdowns: it is the peak-to-trough decline during a specific period. Market fliers had a horrible couple of months in December-Jan where it saw a jaw-dropping 20% draw-down that took 29 days to recover from.

Nifty

From Trough To Depth Length To Trough Recovery
2013-Dec-10 2014-Feb-04 2014-Mar-06 -0.057 61 40 21
2013-Nov-05 2013-Nov-13 2013-Dec-09 -0.0519 24 7 17
2014-Apr-25 2014-May-07 2014-May-09 -0.0275 10 8 2
2014-Apr-11 2014-Apr-16 2014-Apr-21 -0.0178 5 3 2
2014-Apr-03 2014-Apr-04 2014-Apr-09 -0.0086 4 2 2

High Beta (Market Fliers)

From Trough To Depth Length To Trough Recovery
2013-Dec-09 2014-Feb-12 2014-Mar-27 -0.1955 75 46 29
2013-Nov-05 2013-Nov-12 2013-Dec-08 -0.1083 22 5 17
2014-Apr-10 2014-Apr-15 2014-May-11 -0.0751 18 3 15
2014-Apr-02 2014-Apr-02 2014-Apr-08 -0.0215 4 1 3
2014-Mar-31 2014-Mar-31 2014-Apr-01 -0.0092 2 1 1

Low Beta (Market Elephants)

From Trough To Depth Length To Trough Recovery
2014-Jan-15 2014-Feb-12 2014-Feb-27 -0.0427 31 21 10
2013-Nov-04 2013-Nov-25 2013-Dec-02 -0.0338 19 14 5
2014-Apr-24 2014-May-06 2014-May-21 -0.0309 19 8 11
2013-Dec-03 2013-Dec-12 2013-Dec-15 -0.024 8 7 1
2013-Dec-29 2014-Jan-06 2014-Jan-13 -0.0219 12 7 5

Performance

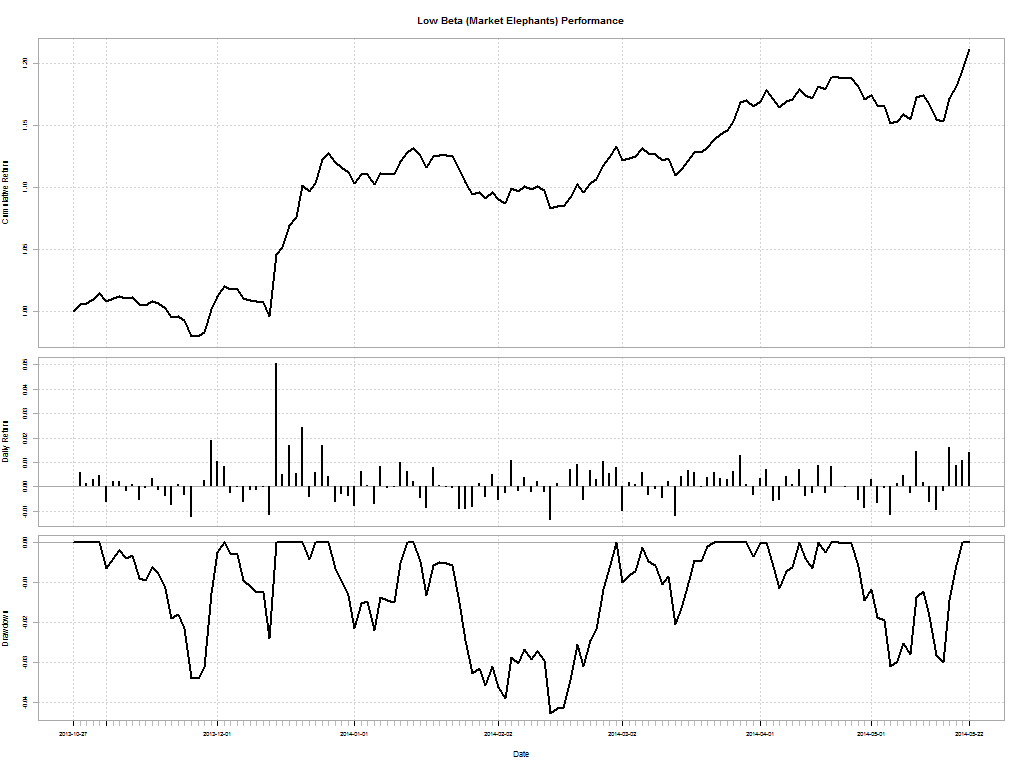
The wealth chart for market filers is basically a parabola at this point. During the period, the Nifty clocked in +19.26%, Market Fliers +72.42% and Market Elephants +21.16%

Nifty
nifty-returns

High Beta (Market Fliers)

high-beta-returns

Low Beta (Market Elephants)

low-beta-returns

Performance vs. Drawdown

How do you tell if these Themes are better than the Nifty? One way to measure relative performance is through the Calmar ratio and the Sterling ratio.

The Calmar ratio is a comparison of the average annual compounded rate of return and the maximum drawdown risk. The lower the Calmar Ratio, the worse the investment performed on a risk-adjusted basis over the specified time period; the higher the Calmar Ratio, the better it performed.

The Sterling ratio = Compounded Annual Return ÷ (Avg. Max Drawdown – 10%)

Just like the Calmar ratio, a higher Sterling ratio is generally better because it means that the investment is receiving a higher return relative to risk.

Calmar Ratio Sterling Ratio
Nifty 6.487609 2.35644
Market Fliers 8.720311 5.768798
Market Elephants 9.828884 2.942523

As you can see, smart beta strategies beat the Nifty both in absolute returns and in risk.


Note: The analysis starts from 2013-Oct-28.


Weekly Recap: Language & Decision Making

Equities

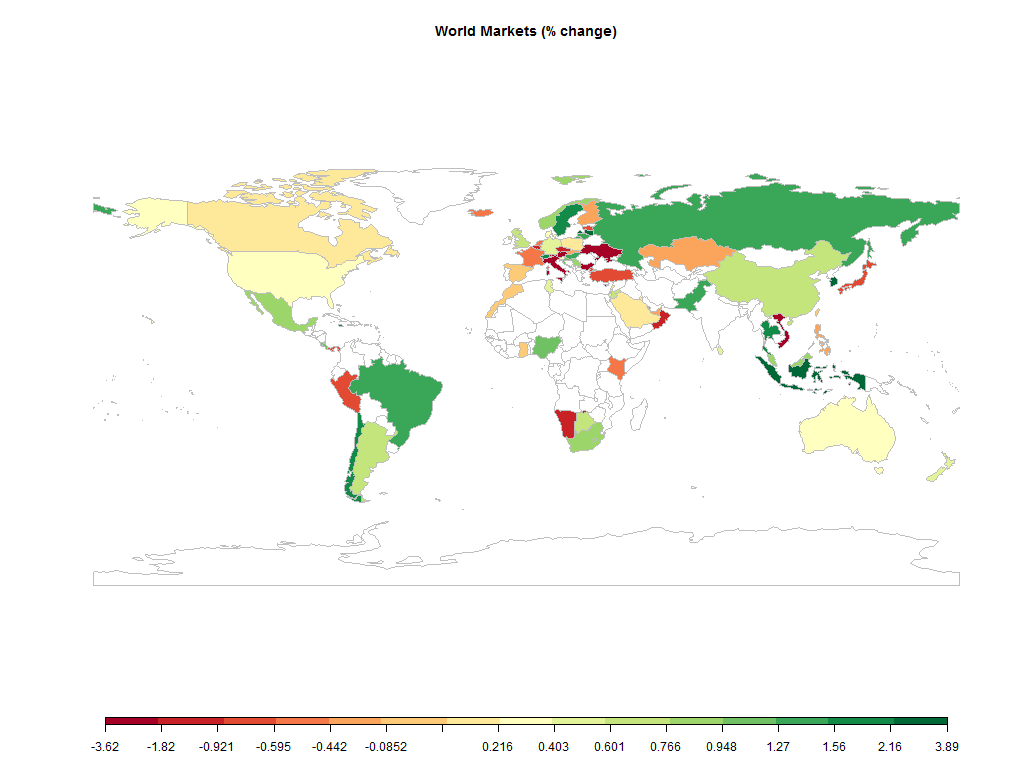
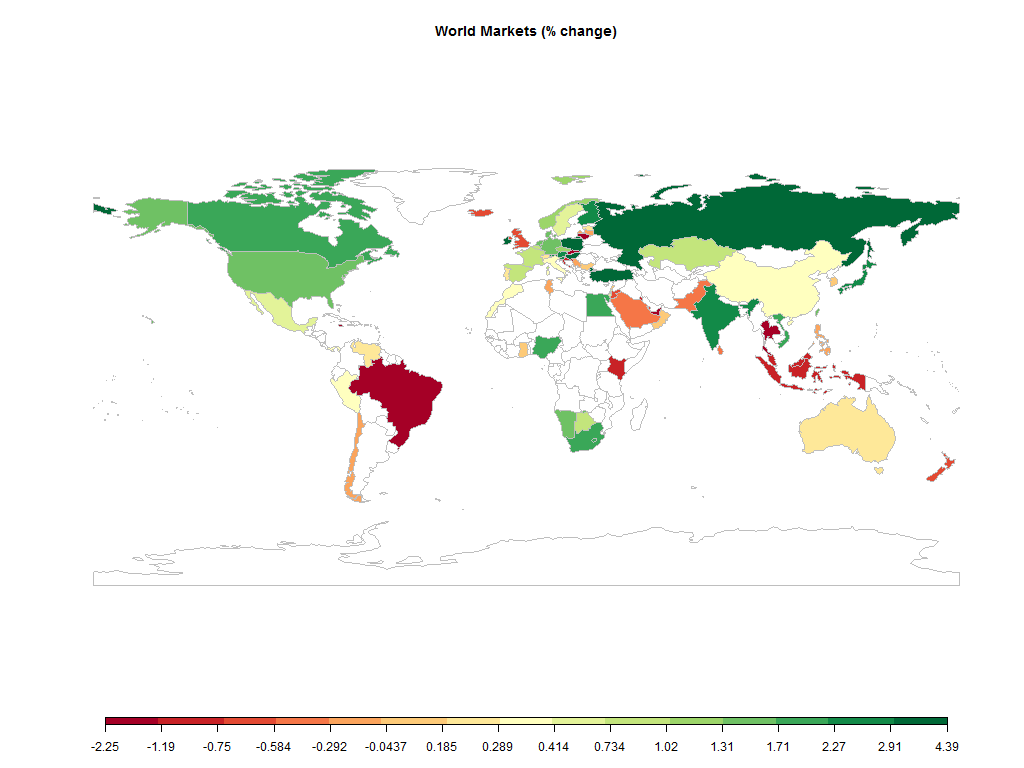
world equity markets 2014-05-09.2014-05-16

The Nifty put in a MODIfied return of +5.02% (+7.15% in USD terms) this week…

Major
DAX(DEU) +0.50%
CAC(FRA) -0.47%
UKX(GBR) +0.61%
NKY(JPN) -0.73%
SPX(USA) +0.22%
MINTs
JCI(IDN) +2.72%
INMEX(MEX) +0.84%
NGSEINDX(NGA) +1.21%
XU030(TUR) -0.76%
BRICS
IBOV(BRA) +1.31%
SHCOMP(CHN) +0.76%
NIFTY(IND) +5.02%
INDEXCF(RUS) +1.52%
TOP40(ZAF) +0.77%

Commodities

Energy
Brent Crude Oil +1.86%
Ethanol +3.47%
Heating Oil +1.60%
Natural Gas -2.41%
RBOB Gasoline +2.85%
WTI Crude Oil +2.45%
Metals
Copper +1.94%
Gold 100oz +0.47%
Palladium +1.89%
Platinum +2.51%
Silver 5000oz +1.05%

Currencies

USDEUR:+0.45% USDJPY:-0.25%

MINTs
USDIDR(IDN) -1.03%
USDMXN(MEX) -0.50%
USDNGN(NGA) +0.71%
USDTRY(TUR) +1.06%
BRICS
USDBRL(BRA) -0.23%
USDCNY(CHN) +0.09%
USDINR(IND) -2.07%
USDRUB(RUS) -1.34%
USDZAR(ZAF) -0.16%
Agricultural
Cattle -0.35%
Cocoa +2.99%
Coffee (Arabica) -0.19%
Coffee (Robusta) -0.81%
Corn -4.16%
Cotton -2.24%
Feeder Cattle +1.52%
Lean Hogs +4.06%
Lumber -3.78%
Orange Juice -2.81%
Soybean Meal -3.32%
Soybeans -2.50%
Sugar #11 +4.08%
Wheat -5.79%
White Sugar +4.18%

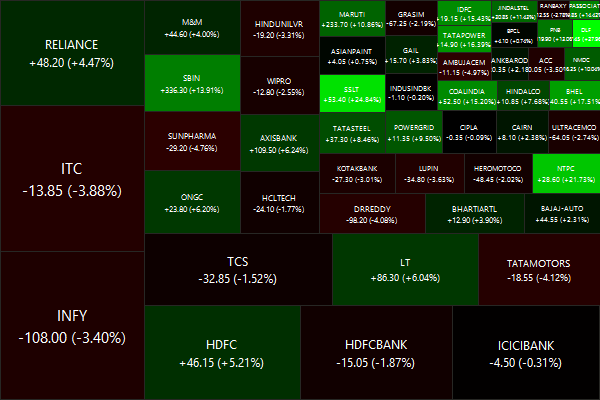
Nifty Heatmap

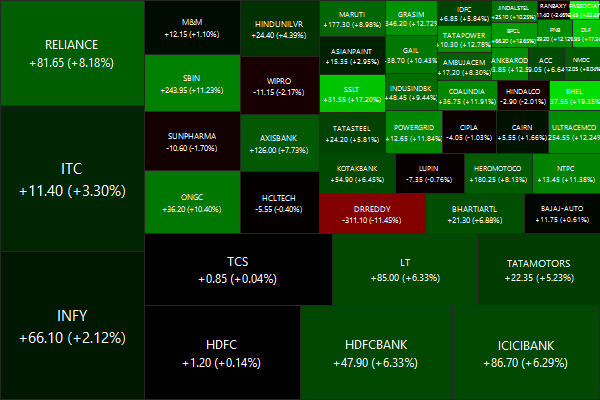
CNX NIFTY.2014-05-09.2014-05-16

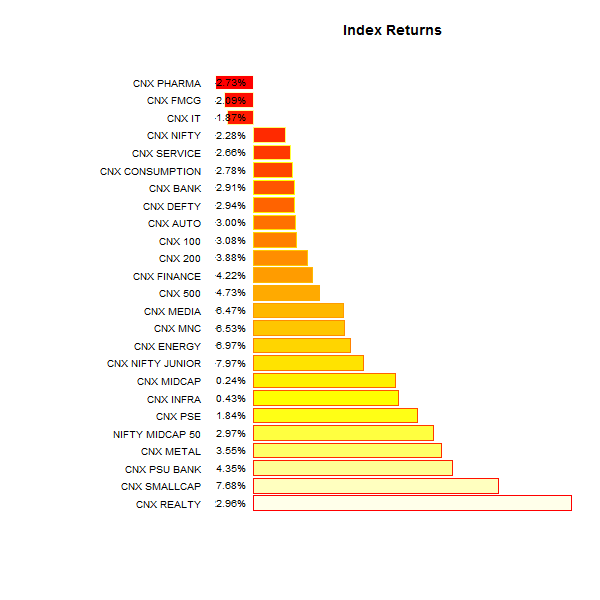
Index returns

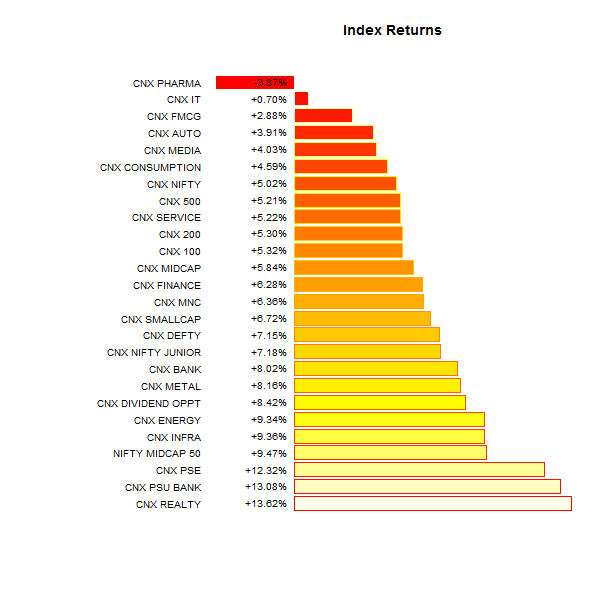
index performance.2014-05-09.2014-05-16

Top winners and losers

UNIONBANK +25.82%
CANBK +26.36%
PFC +27.98%
DRREDDY -11.45%
GLENMARK -7.09%
MCDOWELL-N -4.72%
Banks in, Pharma out…

ETFs

PSUBNKBEES +9.50%
BANKBEES +7.53%
JUNIORBEES +6.61%
INFRABEES +4.97%
NIFTYBEES +4.48%
GOLDBEES -2.25%
We were definitely risk ON this week…

Investment Theme Performance

High beta trumped every other strategy…

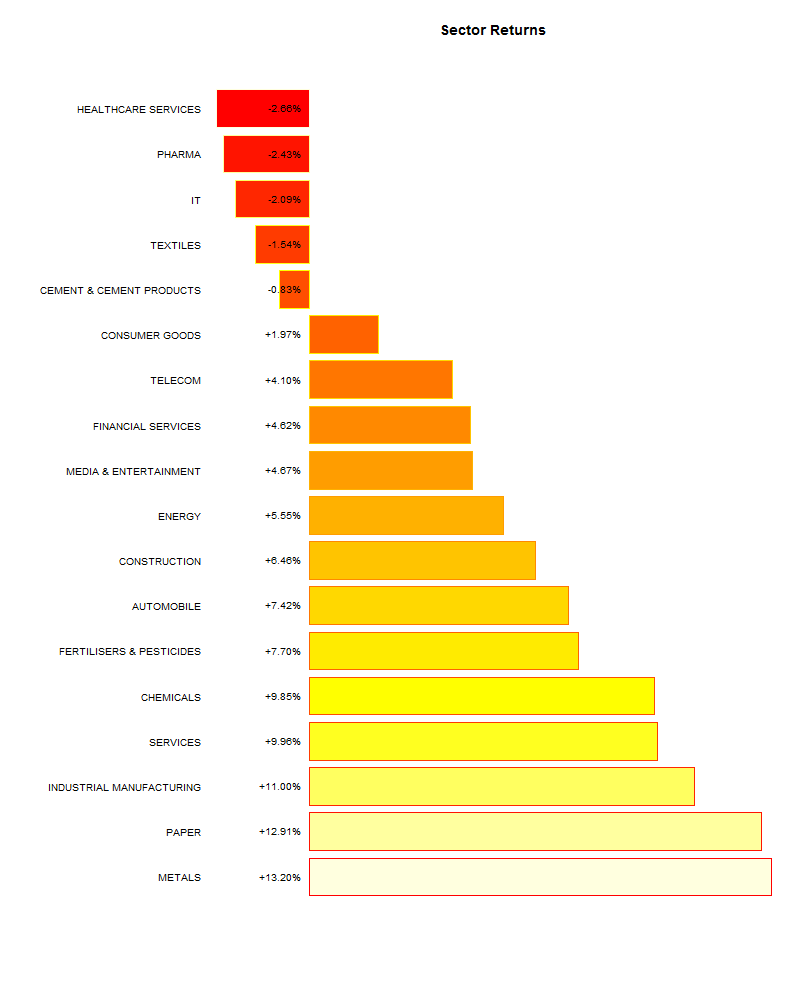
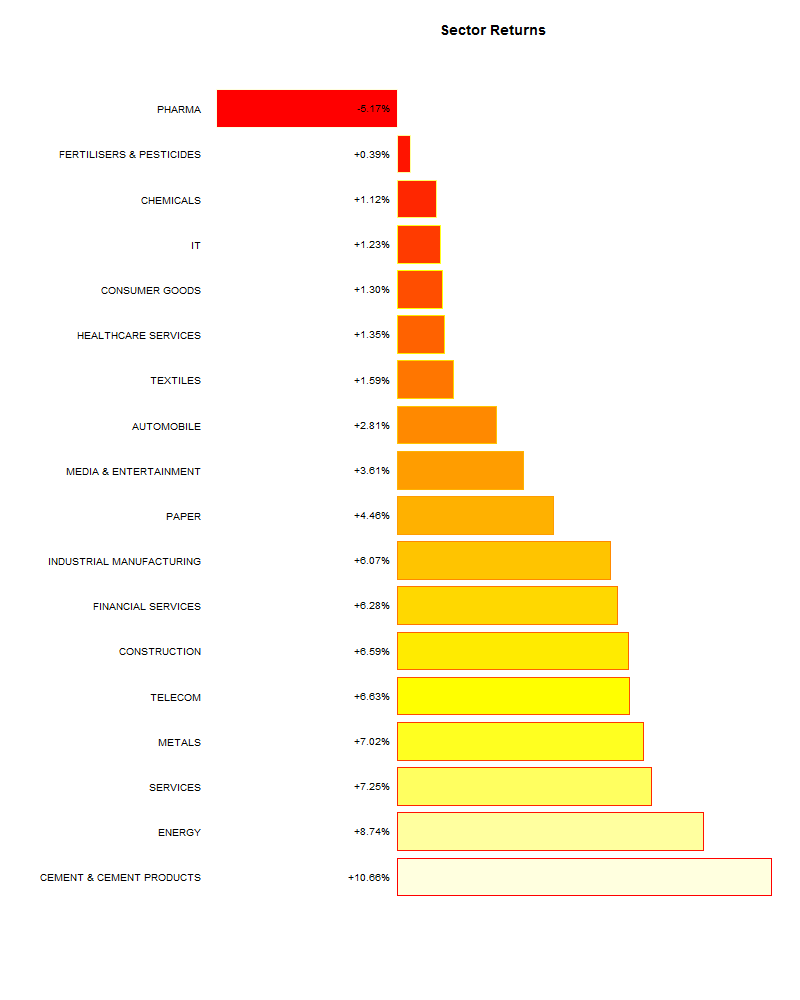
Sector Performance

sector performance.2014-05-09.2014-05-16

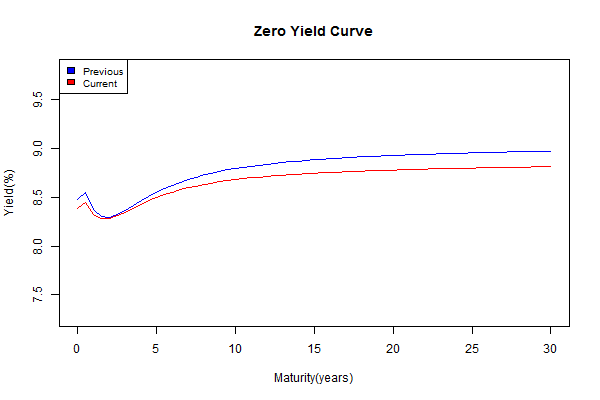
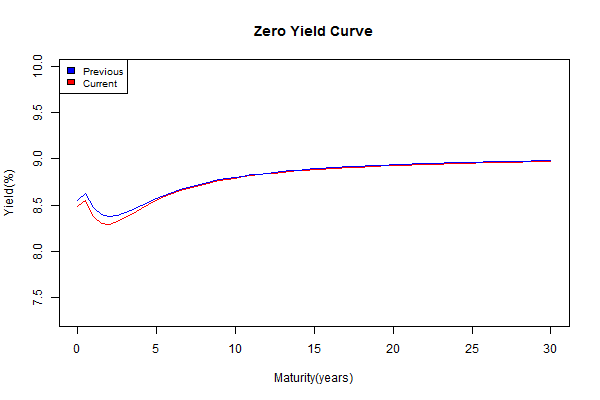
Yield Curve

yield Curve.2014-05-09.2014-05-16

Thought for the weekend

You are on a footbridge watching a trolley speeding down a track that will kill five unsuspecting people. You can push a fat man over the bridge onto the tracks to save the five. (You cannot stop the trolley by jumping yourself, only the fat man is heavy enough.) Would you do it?

If you thought the language in which a dilemma is posed should make no difference to how it is answered, think again!

Source: Gained in translation

Modi: Temper Your Enthusiasm

modi

The intellectual mainstream in India remains so far to the left of centre, that pushing forward major economic reforms is going to remain a tough sell for the time being. The good news is that a pro-business, results-oriented Modi cannot possibly be worse for the economy than the outgoing government; and, freed from the paralysis induced by a dual power structure, may well be a good deal better.

Read: The heart of Modinomics

Is Modi a leader who will prioritise development, providing jobs and bulldozing bureaucracy? Or will he revert to his Hindu nationalist roots and impose a sectarian agenda on a state largely moulded by the Congress party’s secular principles?

Read: Narendra Modi should stick to his pledge of toilets before temples

Gujarat’s pro-business leadership has created opportunities for entrepreneurs of all creeds; yet religious prejudice and segregation are deeply, and even legally, engrained. A property law unique to Gujarat has perpetuated segregation, creating ghettos such as Juhapura and a sense of apartheid in some urban areas.

The “Disturbed Areas Act”, a law that restricts Muslims and Hindus from selling property to each other in “sensitive” areas, was introduced in 1991 to avert an exodus or distress sales in neighborhoods hit by inter-religious unrest.

Read: In Modi’s India, a case of rule and divide

A whole load of policy certainty has been priced into Indian markets ahead of the Modi-led BJP’s presumed victory in the just finished elections. However, even though this election may have been presidential in nature, India’s system of governance most certainly is not. It is not the central government but the states that are responsible for delaying four-fifths of the big Indian infrastructure projects that are stalled for want of official approvals and chief ministers aren’t easily pushed around.

Read: What if Modi’s a tease?

Also: What can Modi do?

Beyond Payoff Diagrams

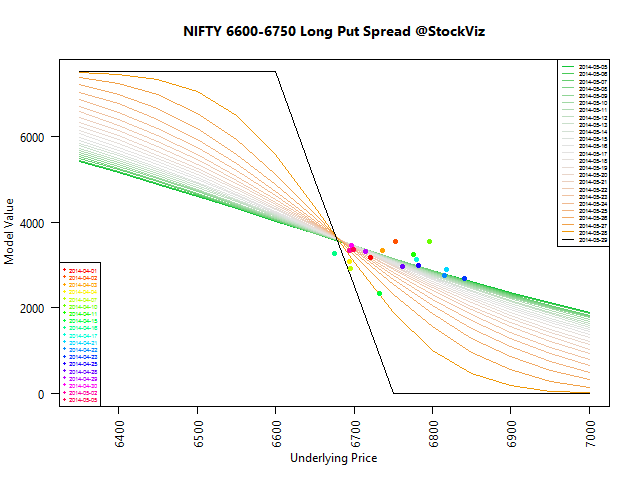
In our previous post, we discussed how you can use a Nifty May 6600/6750 Long Put Spread to express a bearish view. However, the payoff diagram, only shows the P&L at expiry. The underlying can take a completely random path towards that payoff, impacting your daily mark-to-market.

Visualizing θ

One way to visualize it to keep all inputs to the model the same and compute the prices of the the options at different price points. Additionally, you can also plot historical values of your spread to give you an idea of where they are at.

NIFTY 6600-6750 Long Put Spread

Note: y-axis is not P&L

As you can see, its only at the very end of the spread’s life that its model value gets pulled towards the values shown in the payoff diagram. This is largely due to θ-decay.

Takeaways

If you are in-the-money on your spreads, then it makes sense to keep the position open till expiry. Most of the gains are accrued at the fag-end of the term.

Investment Theme Performance Roundup

WHAT IS A “THEME””?

A StockViz Investment Theme is a portfolio of stocks that follows a particular strategy. It is a convenient way for you to:

  1. stick to a strategy
  2. follow a preset rebalancing schedule
  3. think in terms of your portfolio strategy rather than individual stocks
  4. avoid common behavioral pitfalls
  5. systematically track your P&L and strategy performance

WHAT IS AN INVESTMENT STRATEGY?

An investment strategy is a specific way of going about the process of investing. It identifies specific variables that define a stock. Variables can be anything: risk, style, sector, balance-sheet items, etc..

We also have themes based on what other brokers have recommended at different points in time.

By mapping specific Themes to your account, you ensure that you stay pure to your strategy allocation. And that there is no “flying by the seat of your pants” investing.

How have your themes performed?

Since March 3rd this year, here’s how they have performed:

It was a time when both high-beta and value performed nicely. Velocity, one of our momentum themes, got walloped because it was tech and pharma heavy.

Previous performance roundup can be found here.

How have other brokers performend?

Since March 3rd this year, here’s how they have performed:

What if I had just invested in ETFs?

PSUBNKBEES +41.41%
BANKBEES +28.06%
INFRABEES +23.61%
JUNIORBEES +13.08%
NIFTYBEES +10.07%
GOLDBEES -3.42%
PSU banks – you can hate them all you want, but this was one heck of a recovery trade. What is surprising is that most themes ended up beating the Nifty and the Jr. Nifty ETFs.

WHAT SHOULD I DO NEXT?

You should open a demat account with StockViz and invest through our Themes.