Category: Your Money

You are always right in some universe

In recent years a number of investigators have developed the view that those supposedly irrational choices that people make merely reflect the fact that their brains are guided by the mathematical principles of quantum physics.
 
Quantum cognition has proved to be able to account for puzzling behavioral phenomena that are found in studies of a variety of human judgments and decisions.
 
Human judgments “are often not simply read out from memory, but rather, they are constructed from the cognitive state for the question at hand.” Consequently drawing a conclusion about one question alters the context, disturbing the cognitive system just as a quantum measurement disturbs an electron. Such disturbances will influence the answer to the next question, so that “human judgments do not always obey the commutative rule of Boolean logic.”

Source: Quantum math makes human irrationality more sensible

Doing Nothing: Bubble Edition

Aswath Damodaran, a Professor of Finance at the Stern School of Business at New York University, has an interesting post on market bubbles. Is it worth the time and effort to spot bubbles? What are you supposed to do if you have strong feelings about the existence of a bubble? I’ll just list his key takeaways here, you should read the whole thing at your leisure.

  1. There will always be bubbles. Bubbles are part and parcel of financial markets, because investors are human.
  2. But bubbles are not as common as we think they are. And they are not always irrational.
  3. Bubbles always look obvious in hindsight.
  4. Bubbles are not all bad.
  5. Doing nothing is often the best response to a bubble.

Source: Bubble, Bubble, Toil and Trouble: The Costs and Benefits of Market Timing

Weekly Recap: 7 market myths

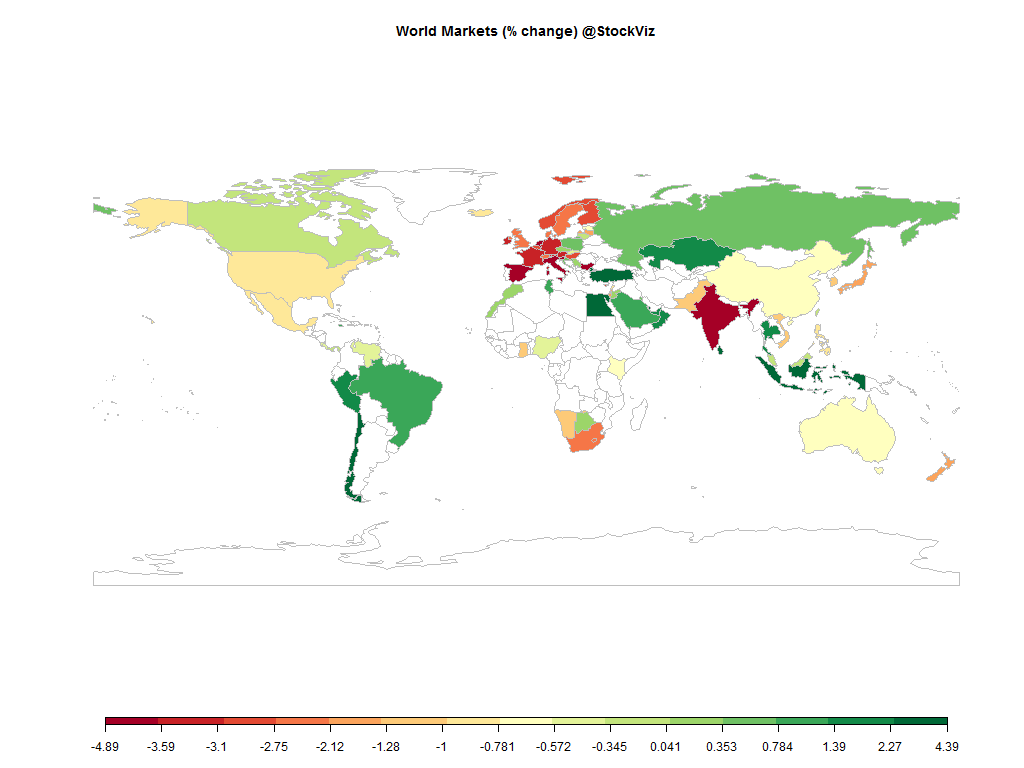
world equity markets 2014-07-04.2014-07-11

Nifty got royally shellacked, ending the week -3.77% (-4.39% in USD terms.)

Equities

Major
DAX(DEU) -3.42%
CAC(FRA) -3.41%
UKX(GBR) -2.56%
NKY(JPN) -1.77%
SPX(USA) -0.90%
MINTs
JCI(IDN) +2.58%
INMEX(MEX) -0.95%
NGSEINDX(NGA) -0.46%
XU030(TUR) +2.45%
BRICS
IBOV(BRA) +1.35%
SHCOMP(CHN) -0.60%
NIFTY(IND) -3.77%
INDEXCF(RUS) +0.76%
TOP40(ZAF) -2.14%

Commodities

Energy
Brent Crude Oil -3.54%
Ethanol -6.49%
Heating Oil -1.67%
Natural Gas -5.18%
RBOB Gasoline -3.31%
WTI Crude Oil -3.16%
Metals
Copper +0.00%
Gold 100oz +1.39%
Palladium +1.08%
Platinum +0.86%
Silver 5000oz +0.94%

Currencies

USDEUR:-0.11% USDJPY:-0.74%

MINTs
USDIDR(IDN) -2.40%
USDMXN(MEX) +0.15%
USDNGN(NGA) -0.23%
USDTRY(TUR) -0.74%
BRICS
USDBRL(BRA) +0.36%
USDCNY(CHN) -0.02%
USDINR(IND) +0.34%
USDRUB(RUS) -0.71%
USDZAR(ZAF) -0.53%
Agricultural
Cattle -3.85%
Cocoa +0.31%
Coffee (Arabica) -8.26%
Coffee (Robusta) -2.80%
Corn -4.61%
Cotton -10.09%
Feeder Cattle -3.31%
Lean Hogs +1.03%
Lumber +0.71%
Orange Juice +3.26%
Soybean Meal -5.90%
Soybeans -6.63%
Sugar #11 -4.38%
Wheat -8.72%
White Sugar -3.86%

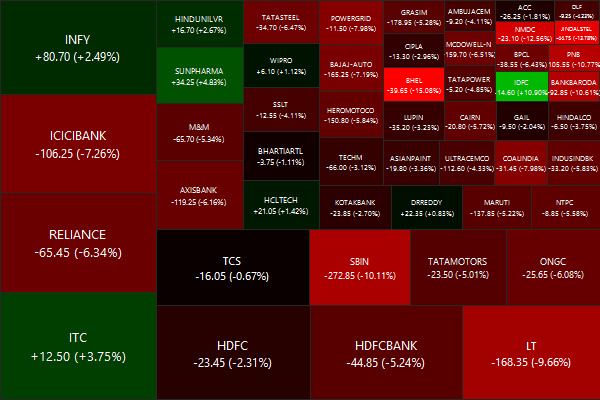
Nifty Heatmap

CNX NIFTY.2014-07-04.2014-07-11

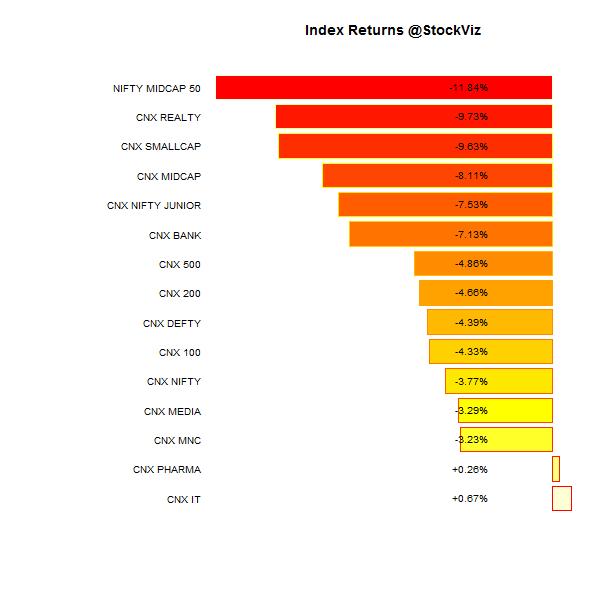
Index Returns

index performance.2014-07-04.2014-07-11

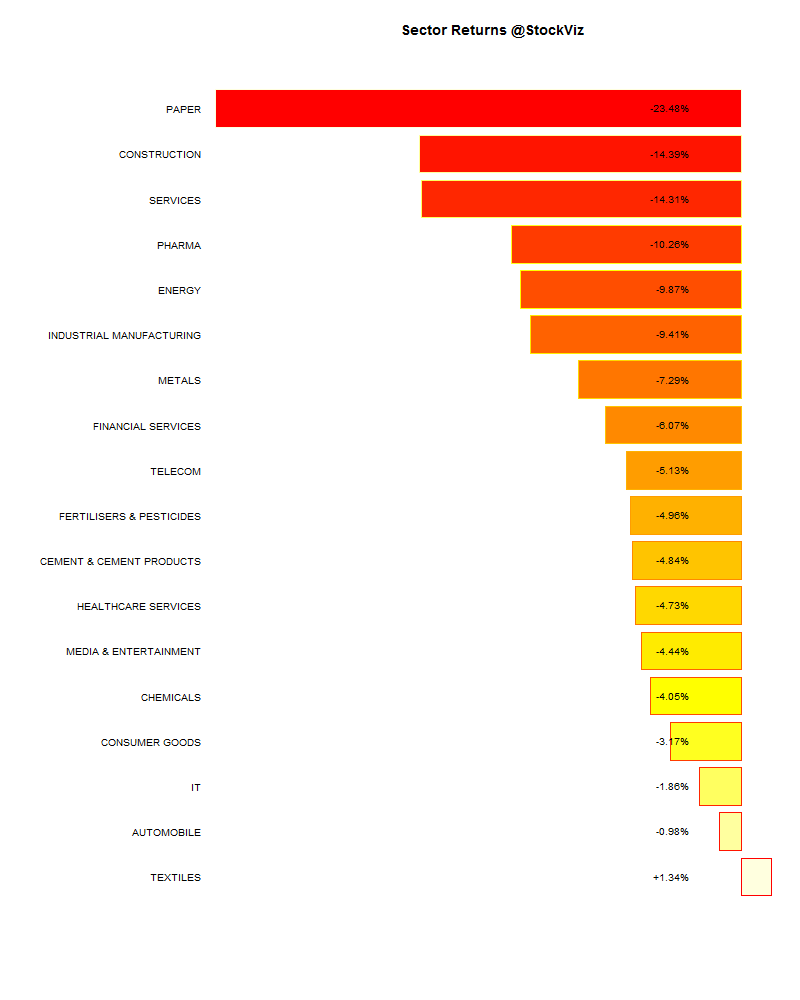
Sector Performance

sector performance.2014-07-04.2014-07-11

Market Cap Decile Performance

Decile Mkt. Cap. Advance/Decline
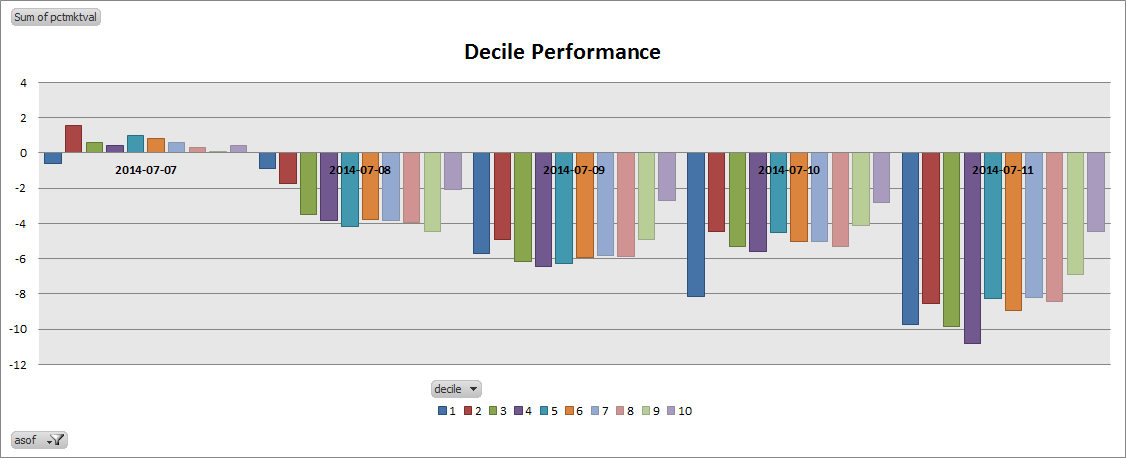
1 (micro-cap) -9.49% 63/76
2 -8.52% 55/84
3 -9.83% 46/93
4 -10.80% 50/87
5 -8.25% 51/89
6 -8.42% 45/94
7 -8.22% 50/88
8 -8.41% 54/85
9 -6.88% 65/74
10 (mega-cap) -4.45% 62/77
Mid-caps, that saw an incredible Modi-hopium rally experienced deep corrections.

Top winners and losers

RANBAXY +4.27%
SUNPHARMA +4.83%
IDFC +10.90%
UNIONBANK -18.14%
CROMPGREAV -17.31%
ADANIENT -15.47%
Banks, industrials and Adanis felt the brunt of the Modi-hopium hangover.

Etfs

GOLDBEES +1.74%
NIFTYBEES -3.87%
BANKBEES -6.45%
INFRABEES -7.62%
JUNIORBEES -8.11%
PSUBNKBEES -9.87%
Looks like the market expected a lot more for PSU banks in the budget.

Investment Theme Performance

No winners, only different shades of red…

Yield Curve

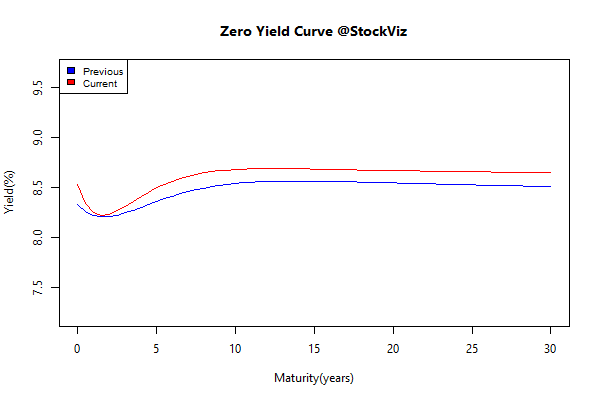
Typically, you would expect bonds to rally whenever equities fall, but not this time. Yields rose this week.

yield Curve.2014-07-04.2014-07-11

Advance Decline

advance.decline.line2.2014-07-04.2014-07-11

Nifty OI

nifty.puts.calls.JUL.2014-07-04.2014-07-11

Thought for the weekend

What you think you know about money can hurt you:

  1. You too can be Warren Buffett
  2. You get what you pay for
  3. You should focus either on fundamentals or technical analysis
  4. The myth of ‘passive’ investing
  5. The stock market will make you rich
  6. You have to beat the market
  7. ‘Stocks for the long run’ is the best strategy

Source: 7 market myths that make investors poorer

Market Cap Deciles

Introduction

Segmenting the market to track performance, risk etc. has been around for a long time. The Dow Jones Industrial Average was launched in 1896, the Sensex since 1986 and the Nifty since 1995. They provide a short-hand to gauge market performance and track returns over a period of time.

Index construction

An index can be constructed based on any combination of factors that are common to its constituents. They can be sectoral like FMCG, IT, etc. or they can be based on fundamental factors like book value, sales, etc. However, the most common way to construct an index remains free float market capitalization. This is the approach that most indices, like the Nifty, take.

The Nifty lists the following criteria for its constituents (NSE):

  1. Liquidity (Impact Cost)
  2. Float-Adjusted Market Capitalization
  3. Float
  4. Domicile
  5. Eligible Securities
  6. Other Variables

Deciles vs. Indices

Using existing indices come with some disadvantages:

  1. Rebalancing usually occurs once every 6 months – a lot can happen in that time.
  2. They usually have “other” considerations – not entirely quantitative.
  3. Do not cover the entire market – the biggest index in the NSE is CNX 500 that track 500 stocks.

An alternative is to build your own set of indices based on purely quantitative considerations. For example, you could divide the market into deciles based on their free float market cap and set a minimum daily turnover. This will then allow you to track micro-cap through mega-cap performance over arbitrary time frames, track how different stocks transition through deciles, set up “early warning” signals, etc.

Example

If you divide the market into deciles and set the minimum daily turnover to be 0.01% of float, then you end up with about 140 stocks in each. The 1st decile would be the micro-caps while the 10th would be the mega-caps. Here’s how the different deciles performed this week:

decile

Watch out for decile performance charts in our weekly and monthly performance roundups!

Weekly Recap: The World Is A Hyperlink

world equity markets 2014-06-27.2014-07-04

Equities

The Nifty turned out to be the best performing market this week, turning in +3.23% (+3.75% in USD.)

Major
DAX(DEU) +1.98%
CAC(FRA) +0.72%
UKX(GBR) +1.60%
NKY(JPN) +2.27%
SPX(USA) +1.52%
MINTs
JCI(IDN) +1.25%
INMEX(MEX) +2.05%
NGSEINDX(NGA) +2.00%
XU030(TUR) -1.44%
BRICS
IBOV(BRA) +1.80%
SHCOMP(CHN) +1.12%
NIFTY(IND) +3.23%
INDEXCF(RUS) +0.84%
TOP40(ZAF) +3.13%

Commodities

Energy
Brent Crude Oil -2.34%
Ethanol +5.57%
Heating Oil -2.73%
Natural Gas -0.75%
RBOB Gasoline -2.71%
WTI Crude Oil -1.78%
Metals
Copper +3.49%
Gold 100oz +0.17%
Palladium +2.65%
Platinum +1.53%
Silver 5000oz +0.47%

Currencies

USDEUR:+0.37% USDJPY:+0.67%

MINTs
USDIDR(IDN) -1.02%
USDMXN(MEX) -0.12%
USDNGN(NGA) -0.31%
USDTRY(TUR) +0.40%
BRICS
USDBRL(BRA) +0.55%
USDCNY(CHN) -0.21%
USDINR(IND) -0.58%
USDRUB(RUS) +2.21%
USDZAR(ZAF) +1.42%
Agricultural
Cattle +1.90%
Cocoa -1.81%
Coffee (Arabica) +1.24%
Coffee (Robusta) +2.27%
Corn -5.39%
Cotton -4.97%
Feeder Cattle +1.72%
Lean Hogs +0.50%
Lumber -0.30%
Orange Juice +1.36%
Soybean Meal -4.91%
Soybeans -3.50%
Sugar #11 +4.82%
Wheat -2.78%
White Sugar -2.94%

Nifty Heatmap

CNX NIFTY.2014-06-27.2014-07-04

Index Returns

indexperformance.2014-06-27.2014-07-04

Top winners and losers

EXIDEIND +11.25%
ADANIENT +13.99%
ADANIPORTS +19.08%
JPASSOCIAT -2.54%
TATAGLOBAL -1.90%
FEDERALBNK -1.60%
The Adani’s are crushing it right now. Go Modi!

ETFs

JUNIORBEES +5.68%
NIFTYBEES +3.52%
INFRABEES +2.45%
PSUBNKBEES +2.31%
BANKBEES +0.14%
GOLDBEES -0.79%
Yellow metal turned red…

Investment Theme Performance

IT went out of favor again. Otherwise, pretty much all other investment strategies performed well.

Sector Performance

sector performance.2014-06-27.2014-07-04

Yield curve

Yields continued to compress…

yield Curve.2014-06-27.2014-07-04

Advance Decline

advance.decline.line2.2014-06-27.2014-07-04

Nifty OI

A lot has been said about 8000 calls, but look at the action in 8200 and 8400 calls!

nifty.puts.calls.JUL.2014-06-27.2014-07-04

Thought for the weekend

Take a picture of this. Take a picture of that. Point the phone at this. Let the phone listen to that. The technology exists to capture anything and turn it into more. More information. A transaction. A conversation.
 
Say it. Take a photo of it. Type it. Scan it. Whatever. Now, it’s not just websites that give hyperlinks. Everything in the physical world is now a hyperlink too.

Source: The World Is A Hyperlink