Category: Your Money

Weekly Recap: Why do we want to be rich?

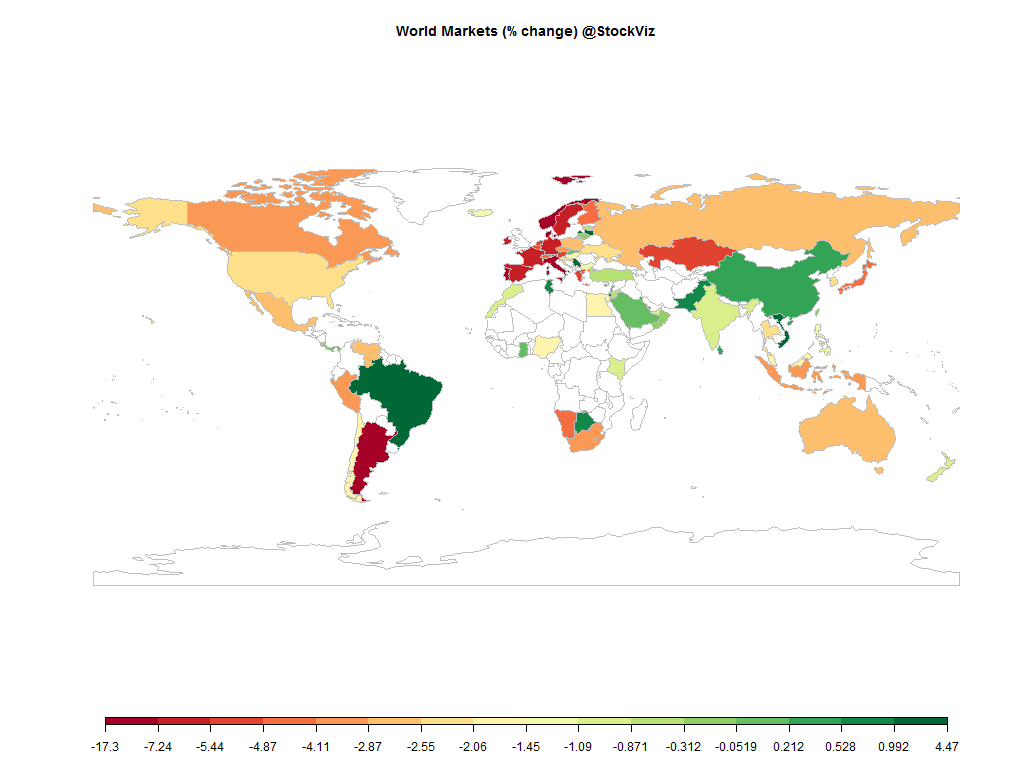
world.2014-10-10.2014-10-17

Equities

Major
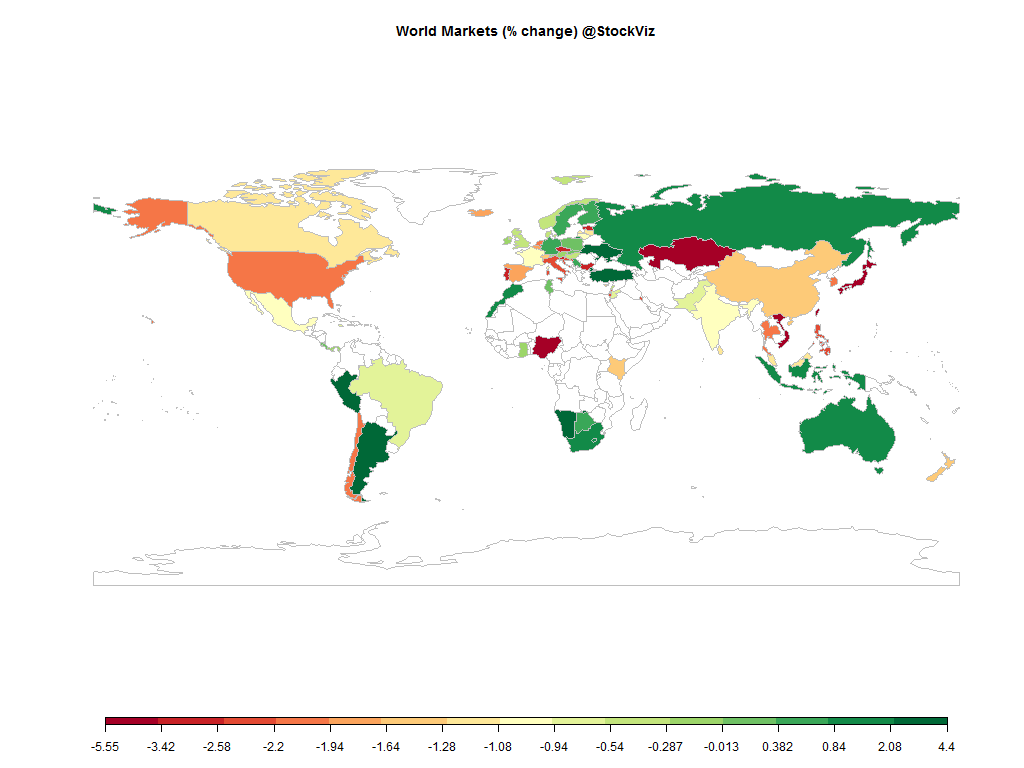
DAX(DEU) +0.70%
CAC(FRA) -0.99%
UKX(GBR) -0.47%
NKY(JPN) -5.02%
SPX(USA) -2.08%
MINTs
JCI(IDN) +1.33%
INMEX(MEX) -1.04%
NGSEINDX(NGA) -5.55%
XU030(TUR) +3.10%
BRICS
IBOV(BRA) -0.94%
SHCOMP(CHN) -1.40%
NIFTY(IND) -1.02%
INDEXCF(RUS) +1.50%
TOP40(ZAF) +1.97%

Commodities

Energy
Brent Crude Oil -4.30%
Ethanol +9.65%
Heating Oil -2.29%
Natural Gas -2.44%
RBOB Gasoline -0.99%
WTI Crude Oil -3.31%
Metals
Copper -0.99%
Gold 100oz +1.32%
Palladium -3.78%
Platinum +0.05%
Silver 5000oz +0.58%

Currencies

USDEUR:-1.07% USDJPY:-0.89%

MINTs
USDIDR(IDN) -0.92%
USDMXN(MEX) +0.81%
USDNGN(NGA) +0.39%
USDTRY(TUR) -1.74%
BRICS
USDBRL(BRA) +1.26%
USDCNY(CHN) -0.09%
USDINR(IND) +0.18%
USDRUB(RUS) +0.69%
USDZAR(ZAF) -0.12%
Agricultural
Cattle -0.10%
Cocoa -0.97%
Coffee (Arabica) -5.03%
Coffee (Robusta) -2.13%
Corn +3.96%
Cotton -1.90%
Feeder Cattle -0.85%
Lean Hogs -17.59%
Lumber -2.48%
Orange Juice -2.49%
Soybean Meal -2.28%
Soybeans +2.92%
Sugar #11 +0.24%
Wheat +3.36%
White Sugar +1.00%

Credit Indices

Index Change
Markit CDX EM -1.19%
Markit CDX NA HY -1.17%
Markit CDX NA IG +4.11%
Markit CDX NA IG HVOL +15.62%
Markit iTraxx Asia ex-Japan IG +7.44%
Markit iTraxx Australia +6.28%
Markit iTraxx Europe +8.22%
Markit iTraxx Europe Crossover +47.19%
Markit iTraxx Japan +6.47%
Markit iTraxx SovX Western Europe +1.20%
Markit LCDX (Loan CDS) -0.40%
Markit MCDX (Municipal CDS) +2.31%
Markets were in full-blown panic mode this week. So much so that the president of the St. Louis Fed, James Bullard, a hawk, had to come out and say that central-bank bond buying should continue beyond its scheduled end this month. And the chief economist at the Bank of England, Andrew Haldane, said “interest rates could remain lower for longer.” Previously, UK interest rates had been expected to rise early next year.

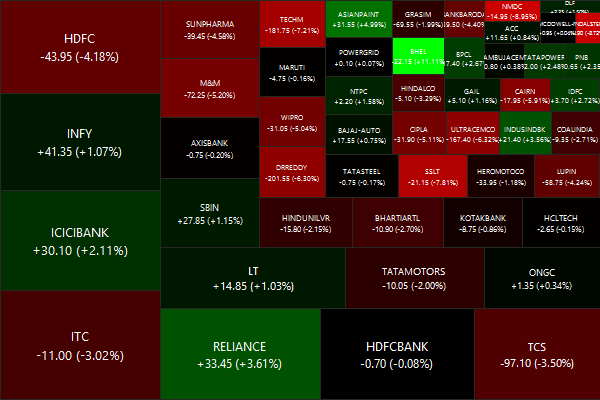
Nifty Heatmap

CNX NIFTY.2014-10-10.2014-10-17

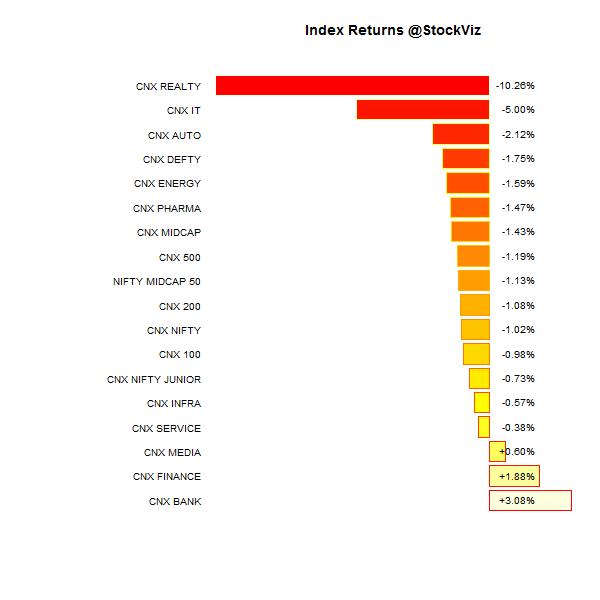
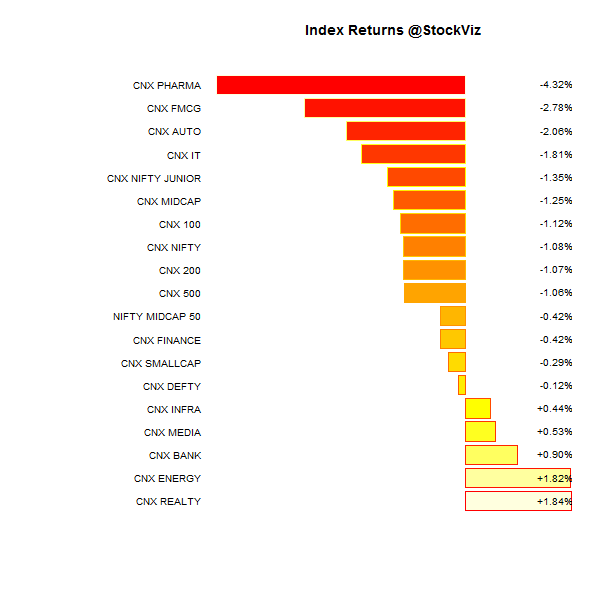
Index Returns

index performance.2014-10-10.2014-10-17

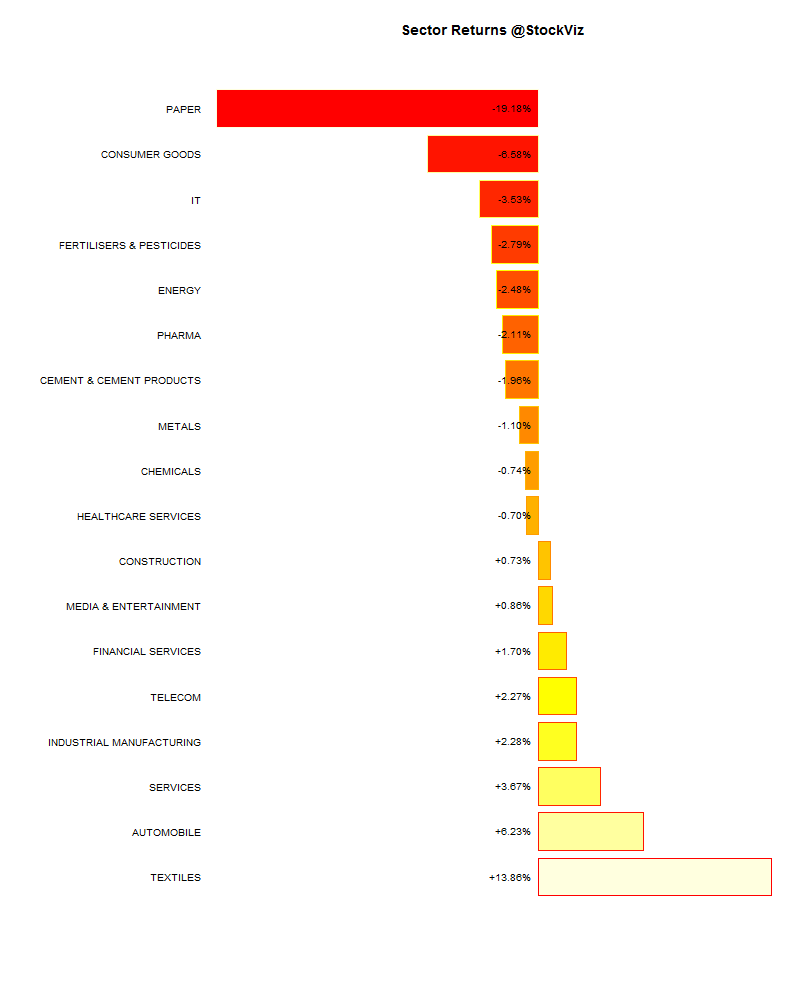
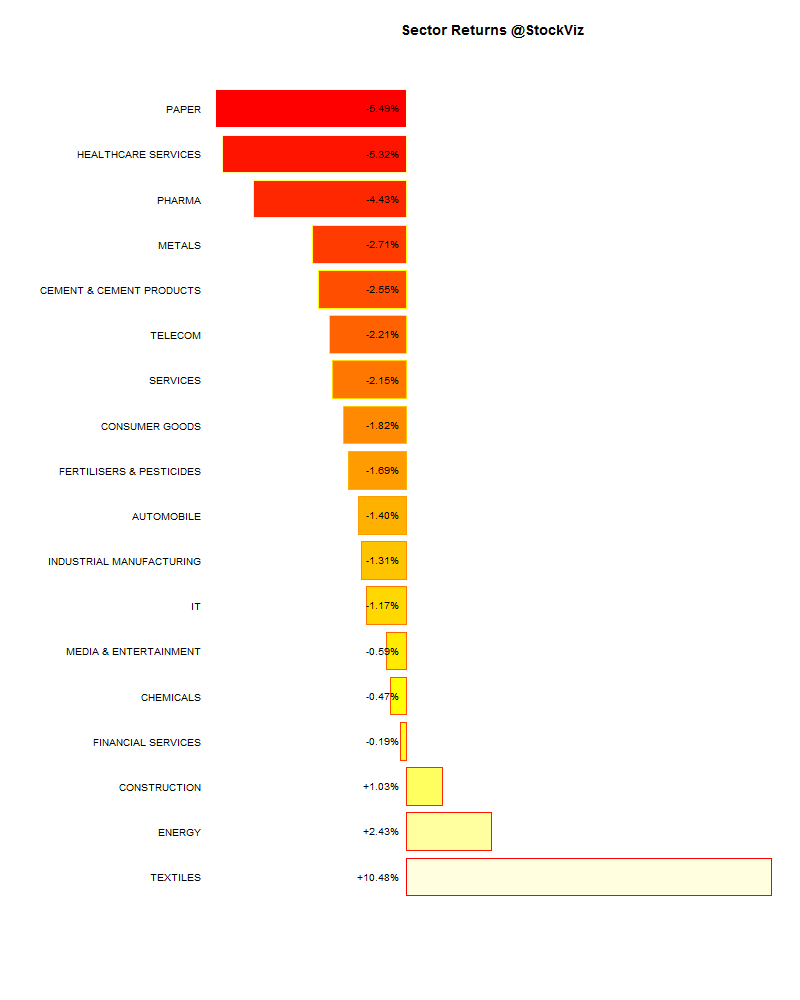
Sector Performance

sector performance.2014-10-10.2014-10-17

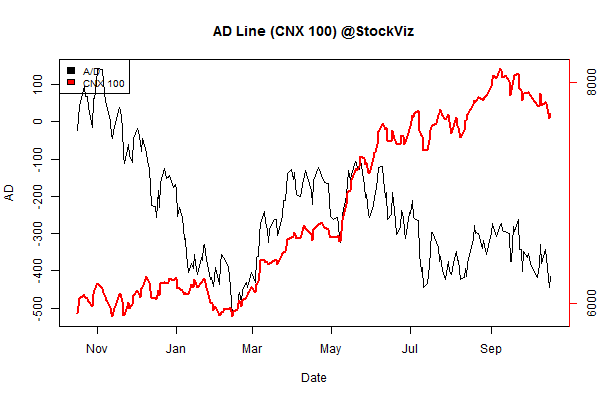
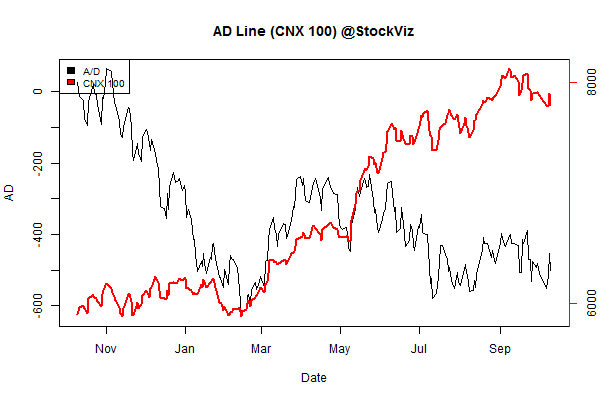
Advance Decline

advance.decline.line2.2014-10-10.2014-10-17

Market cap decile performance

Decile Mkt. Cap. Adv/Decl
1 (micro) -9.23% 70/65
2 -3.31% 56/79
3 -3.21% 58/78
4 -2.90% 59/75
5 -3.38% 58/77
6 -2.42% 60/75
7 -3.11% 59/77
8 -1.58% 61/73
9 -2.56% 71/64
10 (mega) -0.98% 67/69
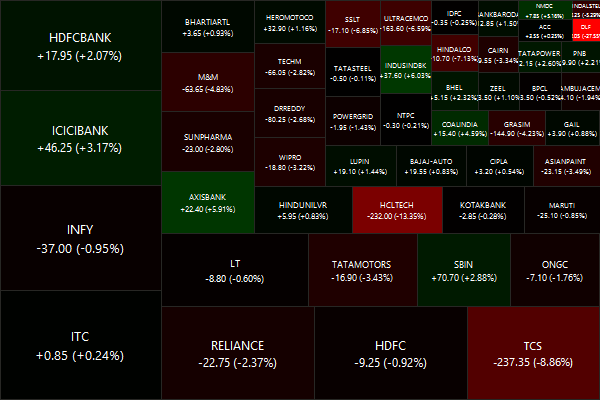
A total bloodbath beyond the mega-caps.

Top winners and losers

LICHSGFIN +6.63%
BANKINDIA +7.90%
UNIONBANK +8.26%
DLF -27.55%
HCLTECH -13.35%
TCS -8.86%
Are rate-cut expectations running ahead of themselves? Rally in banking and home-finance stocks feel a bit overdone. TCS and HCLTECH sold off on earnings. But read this. DLF got royally fcuked by the SEBI.

ETFs

BANKBEES +2.96%
PSUBNKBEES +1.98%
GOLDBEES +1.06%
CPSEETF +0.25%
JUNIORBEES -0.04%
NIFTYBEES -1.11%
INFRABEES -1.63%
A surprising rally in banks while infrastructure remains sick…

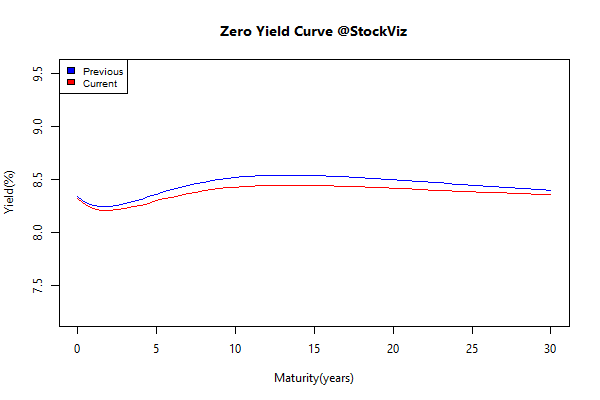
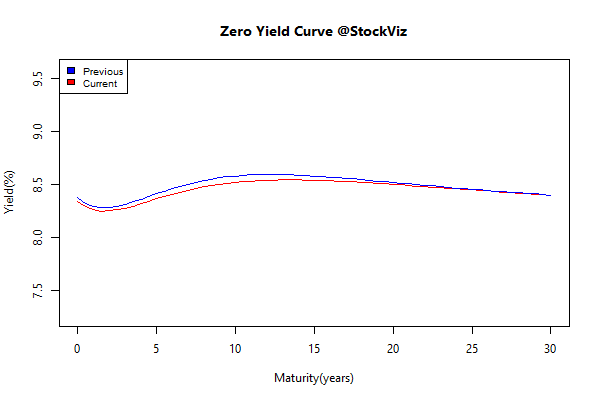
Yield Curve

yield Curve.2014-10-10.2014-10-17

Bond Indices

Sub Index Change in YTM Total Return(%)
GSEC TB -0.29 +0.24%
GSEC SUB 1-3 -0.65 -0.25%
GSEC SUB 3-8 +0.01 -0.59%
GSEC SUB 8 +0.03 +0.11%
Curve can’t get any flatter…

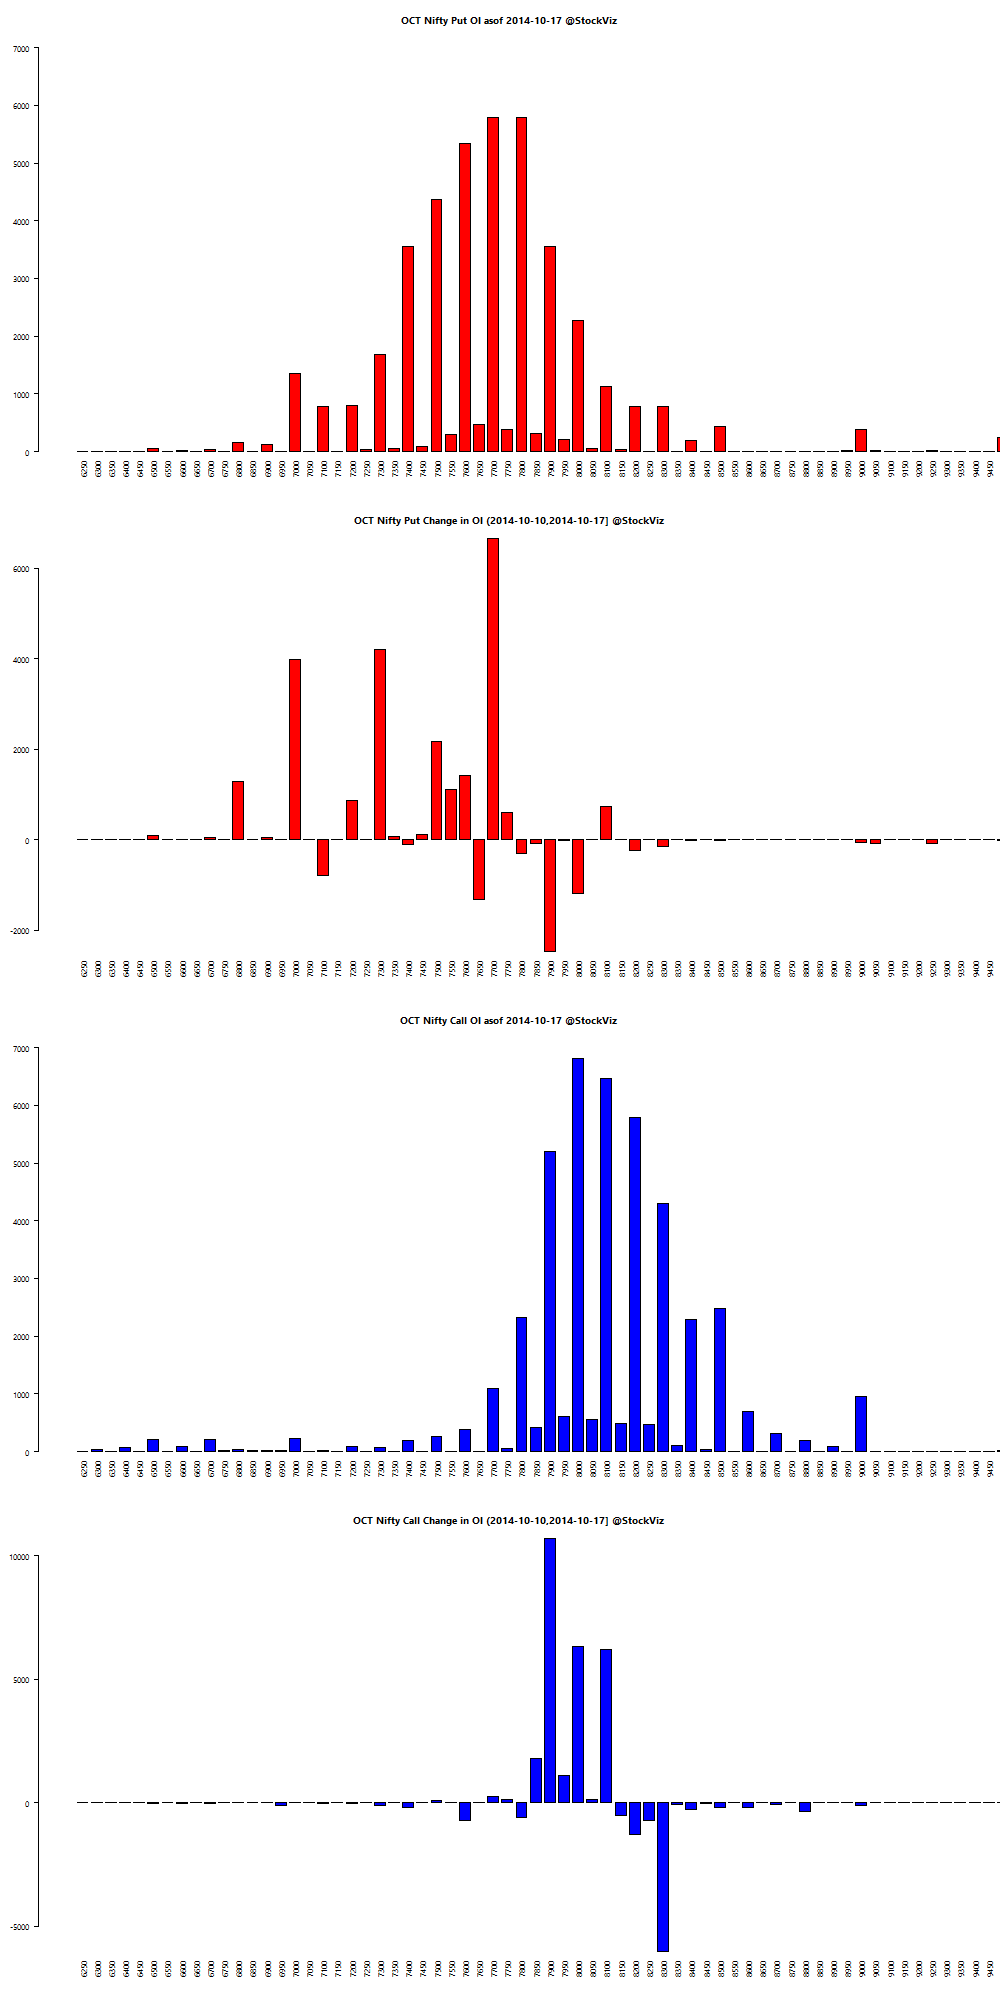
Nifty OI

nifty.puts.calls.OCT.2014-10-10.2014-10-17

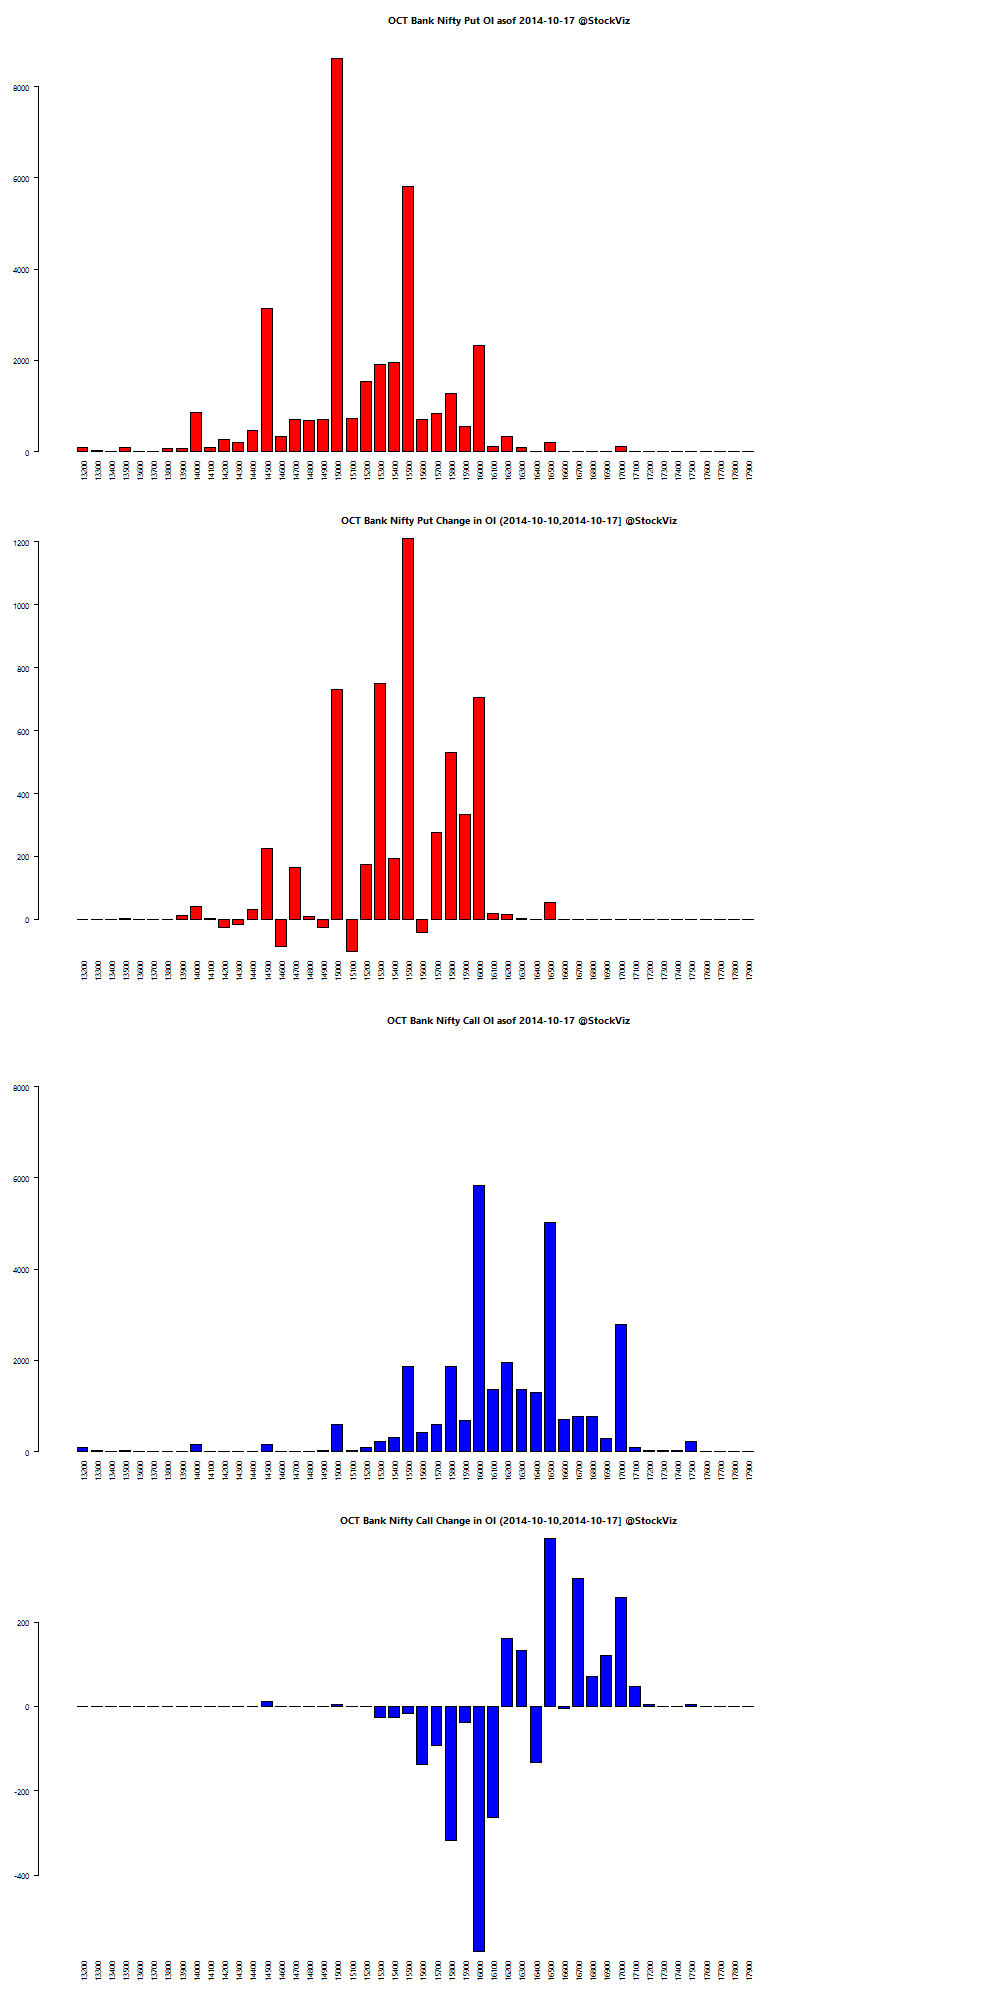
Bank Nifty OI

bank-nifty.puts.calls.OCT.2014-10-10.2014-10-17

Theme Performance

The CNX 100 Tactical Theme spent the whole week in cash. Both value and momentum strategies got pummeled.

Thought for the weekend

Fearing the future is natural, as is the conviction that ultimately we each must depend on ourselves. But in truth, our safest asset is our collective prosperity. Technological progress and productivity gains continue to make us richer on the supply side.

It would be tragic if productivity gains end up making most of us poorer, just because we find it uncomfortable to face the euthanasia of the rentier.

Source: safe assets, secular stagnation, and financial repression

Decisions Under Uncertainty

TCS has been a tremendous wealth creator. Between 2004-8-25 and now, its has turned in a cumulative return of 1164% with an IRR of 28.35% during that period. So you should just “buy right and sit tight”, yeah?
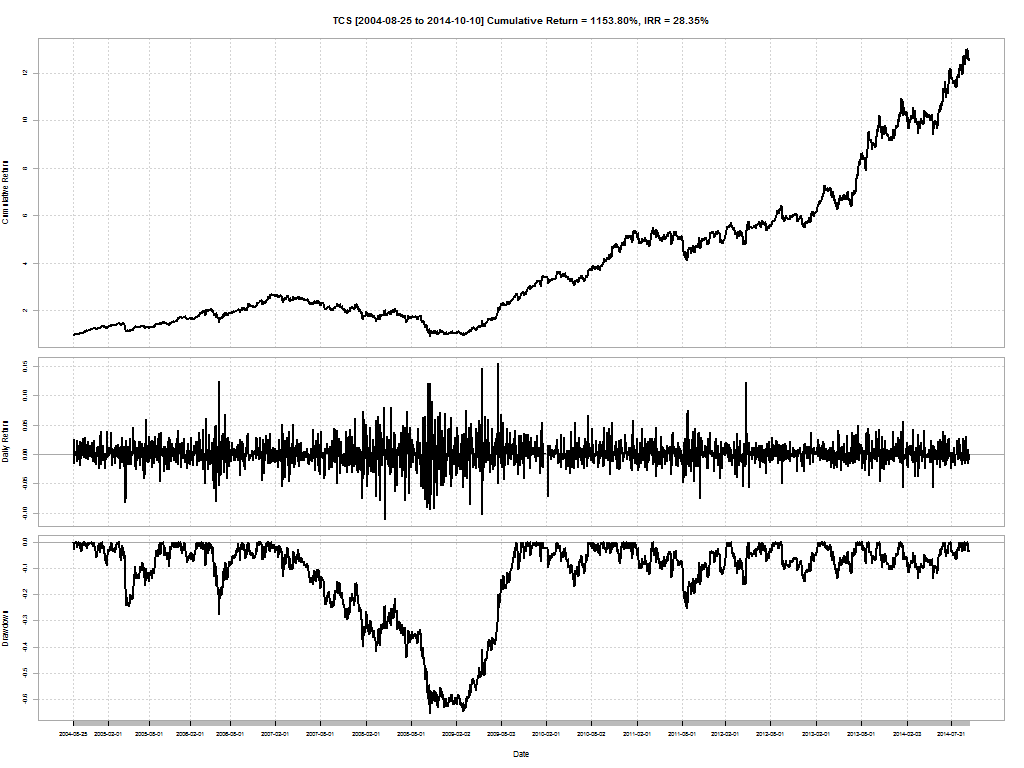
TCS.performance

But before you hang that on your wall, let me take you back to Jan 2007. TCS started sliding on global worries and did stop until losing 65.52% of its value. It took 458 days to make a bottom and another 249 days to climb back up from it. If you think the meltdown in 2007/8 was a once-in-a-lifetime affair, then let me point out that the second worst drawdown for TCS was 27.40% back in 2006. And before that, 24% in 2005.

tcs drawdown

In my experience, 99% of the investors out there would have dumped the stock. That 28.35% IRR is wishful thinking for most investors because not only would they have dumped the stock at maximum pain (peak drawdown) but they would have failed to get back into the stock as well.

But does this mean you should never sell a stock? Have a look at Reliance Infrastructure as a counter example.
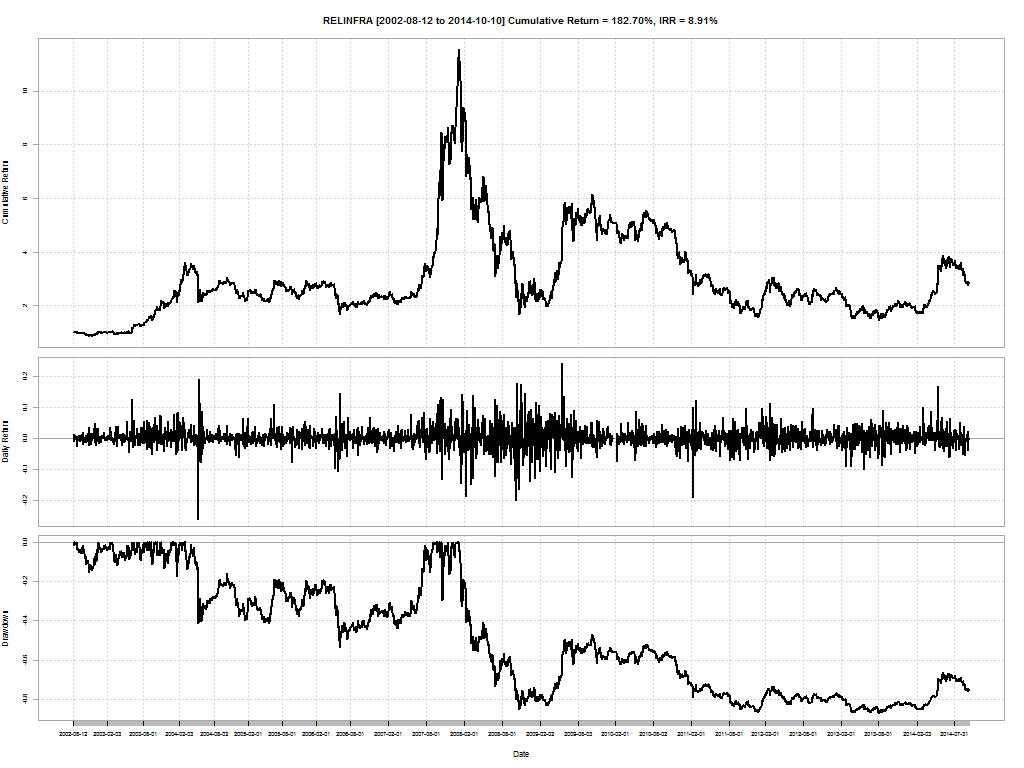
RELINFRA.performance

It is yet to recover from the 87% drawdown in 2008! It has been a value destroyer since early 2008.

relinfra drawdown

So does this mean that you should have a “stop loss”? How should you manage whiplash? How do you keep track of all the reasons you bought a stock and if it still fits that criteria? If you sell a stock, what do you replace it with?

The key to making decisions under uncertainty is to have a process. A process that

  1. identifies investment opportunities based on pre-selected parameters (value, momentum, factor, beta, etc…),
  2. has a set holding period, based on the intricacies from (a) and current market conditions, and
  3. forces stocks out of the portfolio based on (a) and (b)

This where StockViz Themes come into the picture. Themes are technology wrappers around different investment strategies that make it convenient for investors to follow a process.

To know what combinations of Themes are right for your risk appetite and investment horizon, get in touch with us now!
Weekly Recap: October

world.2014-10-1.2014-10-10

Equities

Major
DAX(DEU) -6.32%
CAC(FRA) -6.68%
NKY(JPN) -4.86%
SPX(USA) -2.16%
MINTs
JCI(IDN) -3.46%
INMEX(MEX) -2.65%
NGSEINDX(NGA) -1.86%
XU030(TUR) -0.82%
BRICS
IBOV(BRA) +4.47%
SHCOMP(CHN) +0.45%
NIFTY(IND) -1.08%
INDEXCF(RUS) -2.55%
TOP40(ZAF) -4.05%

Commodities

Energy
Brent Crude Oil -4.18%
Ethanol +4.04%
Heating Oil -3.48%
Natural Gas -4.43%
RBOB Gasoline -7.66%
WTI Crude Oil -5.83%
Metals
Copper +0.00%
Gold 100oz +0.69%
Palladium +0.44%
Platinum -1.99%
Silver 5000oz +0.58%

Currencies

USDEUR:-0.13% USDJPY:-1.46%

MINTs
USDIDR(IDN) +0.72%
USDMXN(MEX) +0.18%
USDNGN(NGA) +0.49%
USDTRY(TUR) +0.20%
BRICS
USDBRL(BRA) -2.06%
USDCNY(CHN) -0.14%
USDINR(IND) -0.45%
USDRUB(RUS) +1.70%
USDZAR(ZAF) -1.23%
Agricultural
Cattle +1.77%
Cocoa +1.08%
Coffee (Arabica) +10.84%
Coffee (Robusta) +5.01%
Corn +4.28%
Cotton +3.95%
Feeder Cattle +0.92%
Lean Hogs +1.99%
Lumber +0.38%
Orange Juice -3.85%
Soybean Meal +10.54%
Soybeans +0.60%
Sugar #11 +3.25%
Wheat +4.13%
White Sugar +1.08%

Credit Indices

Index Change
Markit CDX EM -14.82%
Markit CDX NA IG +2.60%
Markit CDX NA IG HVOL +22.00%
Markit iTraxx Asia ex-Japan IG +18.07%
Markit iTraxx Australia +11.93%
Markit iTraxx Europe +4.57%
Markit iTraxx Europe Crossover +93.24%
Markit iTraxx Japan +7.25%
Markit iTraxx SovX Western Europe -0.82%
Markit LCDX (Loan CDS) -0.17%
Markit MCDX (Municipal CDS) +3.90%
Markets seesawed between “good news is bad news” (US recovery means end of ZIRP) and “bad news is bad news” (slowing global growth) resulting in some serious whiplash. Credit blew out, European markets tanked and oil got crushed…

Nifty Heatmap

CNX NIFTY.2014-10-1.2014-10-10

Index Returns

index performance.2014-10-1.2014-10-10

Sector Performance

sector performance.2014-10-1.2014-10-10

Advance Decline

advance.decline.line2.2014-10-1.2014-10-10

Market cap decile performance

Decile Mkt. Cap. Adv/Decl
1 (micro) -6.80% 69/66
2 -2.31% 63/70
3 -0.18% 66/69
4 -2.54% 65/70
5 +0.24% 62/72
6 -1.06% 60/75
7 +0.00% 72/63
8 -0.35% 74/61
9 -0.53% 66/69
10 (mega) -1.15% 66/69
Small-caps bore the brunt of the market correction.

Top winners and losers

RCOM +5.06%
UNIONBANK +5.37%
BHEL +11.11%
NMDC -8.95%
JINDALSTEL -8.72%
IDEA -8.45%
JSPL continued to get pummeled, it is now -38.74% for the year.

ETFs

GOLDBEES +0.67%
BANKBEES +0.45%
INFRABEES +0.45%
CPSEETF -0.41%
NIFTYBEES -1.03%
PSUBNKBEES -1.09%
JUNIORBEES -3.01%
Negative for the most part…

Yield Curve

yield Curve.2014-10-1.2014-10-10

Bond Indices

Sub Index Change in YTM Total Return(%)
GSEC TB -0.03 +0.21%
GSEC SUB 1-3 +0.04 +0.36%
GSEC SUB 3-8 -0.06 +0.66%
GSEC SUB 8 +0.05 -0.04%
The long end was affected by RBI’s OMO – apparently they were mopping up excess liquidity…

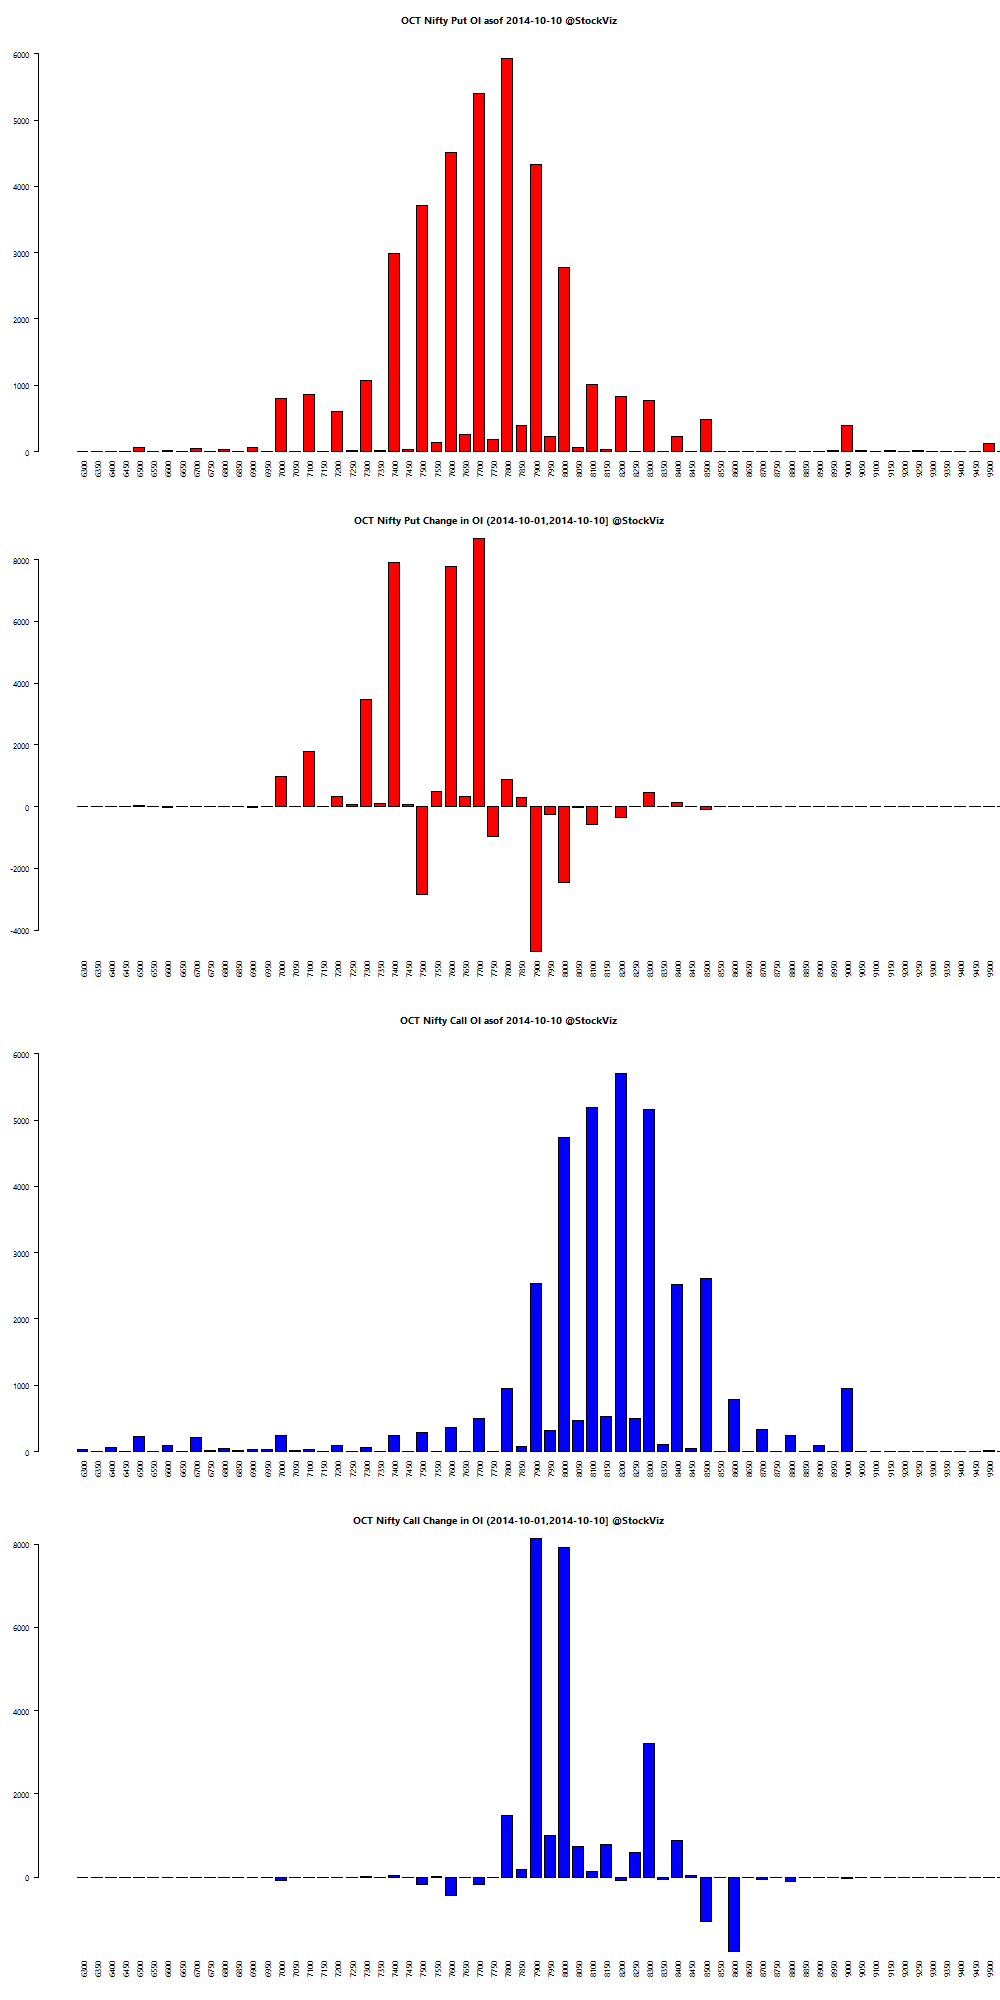
Nifty OI

nifty.puts.calls.OCT.2014-10-01.2014-10-10

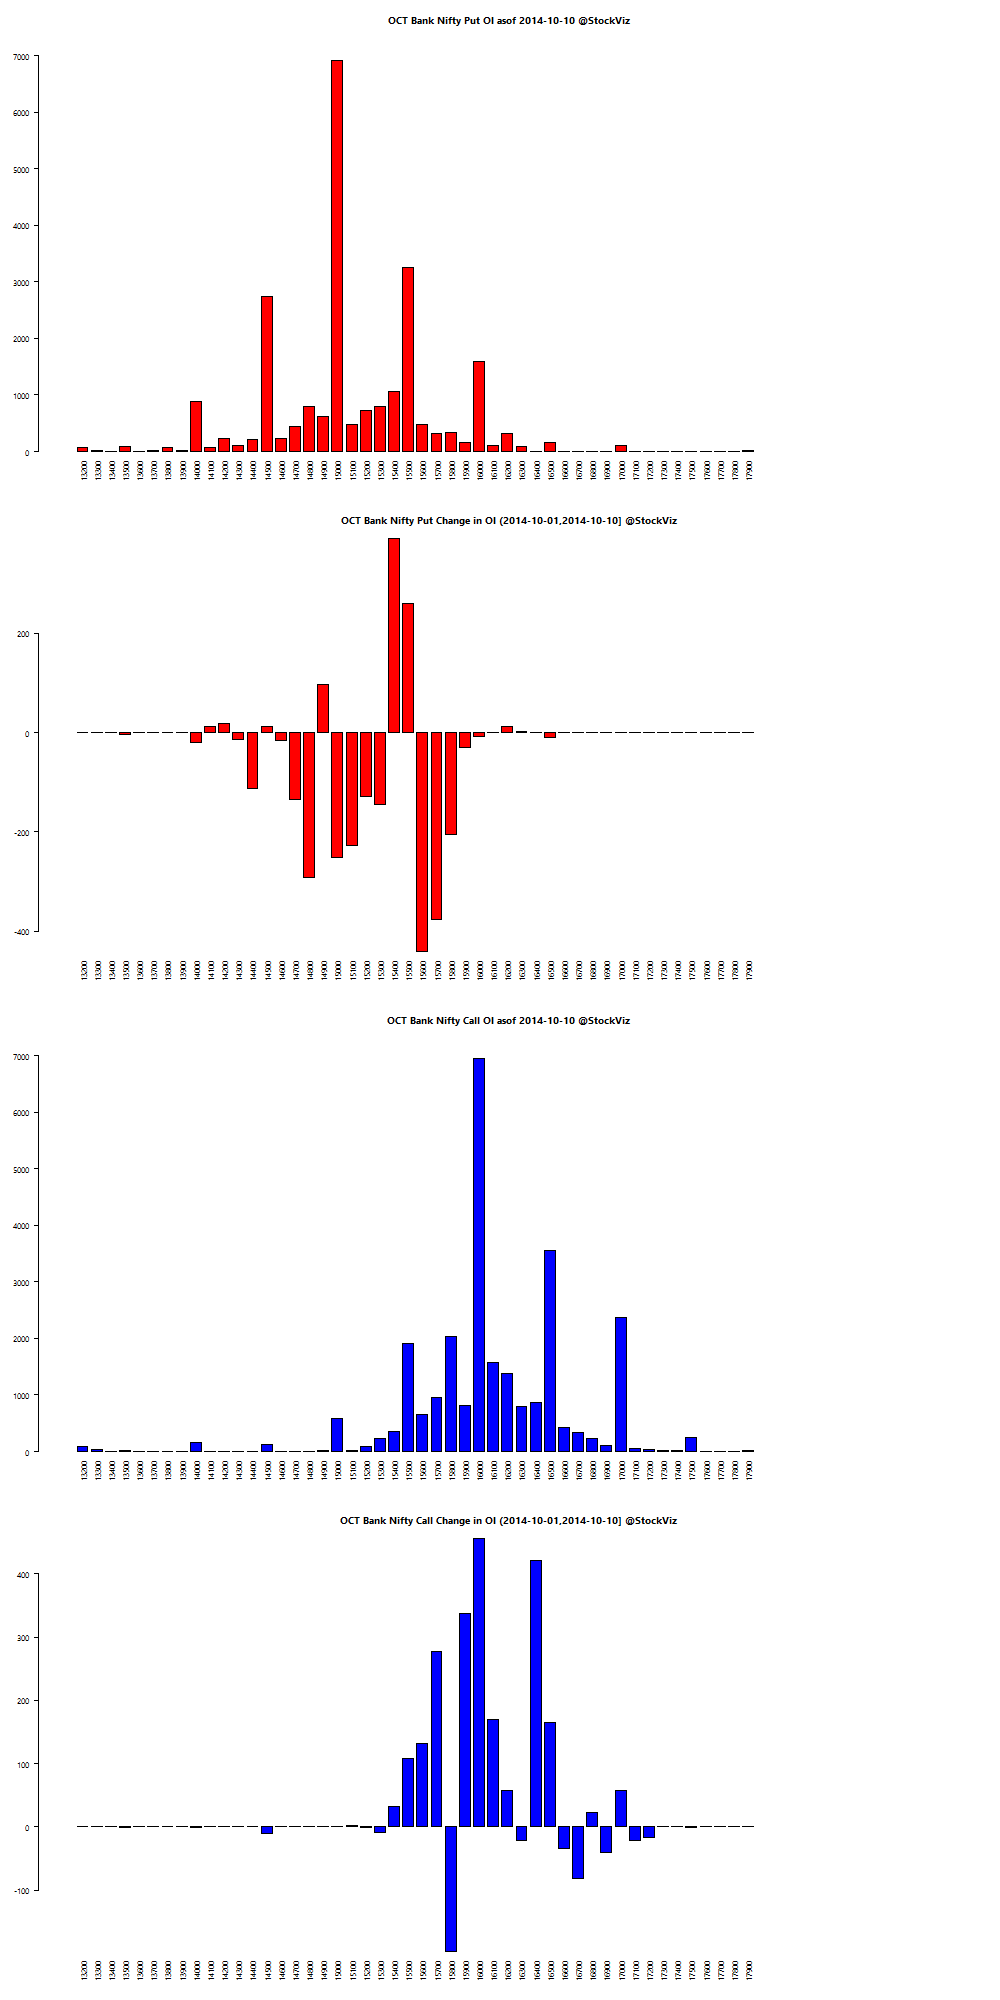
Bank Nifty OI

bank-nifty.puts.calls.OCT.2014-10-01.2014-10-10

Theme Performance

Momentum carried through this week, but barely. Most themes ended in the red.

Thought for the weekend

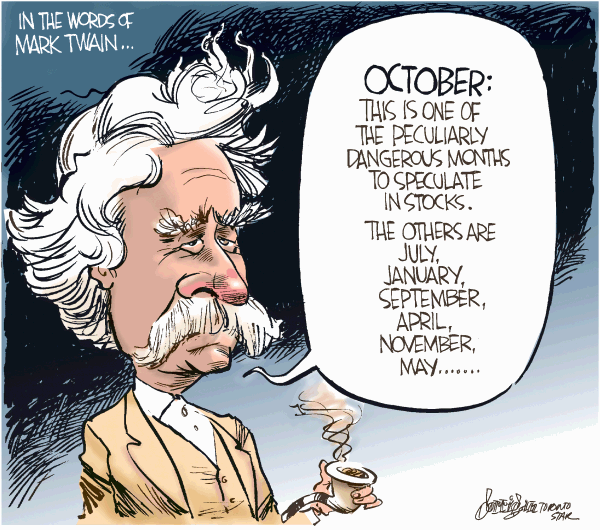
twain october

Google Asset Management

Facebook, with all the data they are collecting about you, your interests, your social “klout”, etc. could soon make the role of your bank manager redundant. And they have been trying to wedge into the financial services for a while now. Back in April, we surfaced a story about how Facebook is entering the remittances market and is planning to allow its users to store money on Facebook and use it to pay and exchange money with others. “Facebook wants to become a utility in the developing world, and remittances are a gateway drug to financial inclusion.”

Where Facebook goes, can Google be far behind?

Google has commissioned research on how it could enter the asset management industry, adding weight to widespread fears in the fund sector that the world’s biggest internet companies could destroy the livelihoods of established fund houses.

However, Silicon Valley tech firms with their “move fast and break things” motto may be ill suited to meet the fiduciary standards set by regulators to protect investors. Apple sending out a flawed update to new iPhones is a minor irritation, screwing up somebody’s retirement account is a big deal.

It will be interesting to see how this plays out.

Source: Google study heightens fund industry fears

Broken Funds

Cycles usually turn and the most hated sectors end up bouncing back and out-performing the broader markets. Does the same apply to actively managed mutual funds? Should you bet on the asset manager’s luck turning and getting off to the races? Here are some “broken” funds that maybe of interest.

Escorts Infrastructure Fund

Since 2007-09-21, Escorts Infrastructure Fund has returned a cumulative -38.19% vs. CNX 500’s +58.39%. This fund should get a bad-timing award, having launched in 26-Jul-2007, if MorningStar is to be believed (factsheet.) If you are bullish on Indian infrastructure, you may be better off buying the INFRABEES ETF. [stockquote]INFRABEES[/stockquote]

JM Equity Fund

I wonder what the holdings of this fund were in 2008? It lost -71.81% (CNX 500: -64.26%) in value during the crash and is yet to recover. Seeing how well it tracked the broader market, it might make sense to just hold a CNX 500 index fund instead of paying this manager to actively run your investment to the ground.

JM Basic Fund

Since 2006-04-03, JM Basic Fund has returned a cumulative 4.72% vs. CNX 500’s cumulative return of 117.04%.

jm basic fund

Looks like the fund blew up pretty much every year of its existence.

HSBC Progressive Themes Fund

Something happened in Oct-2010 that permanently changed the course of this fund.

Since 2006-04-03, HSBC Progressive Themes Fund has returned a cumulative 36.18% vs. CNX 500’s cumulative return of 117.04%. And since 2013-01-01, the number is 25.73% vs. 31.98%.

Progressively losing client’s money.

Taurus Bonanza Fund

This fund was a bonanza for the asset manager who continues to charge 2.83% on Rs. 250.8M of assets (MorningStar.) Since 2006-04-03, Taurus Bonanza Fund has returned a cumulative 51.66% vs. CNX 500’s cumulative return of 117.04%.

It is yet to recover from the 2008 crash and you are probably better off buying a CNX 100 or CNX 500 index fund instead of chasing this bonanza.

Conclusion

It is said that there is a lot you can learn from studying failure. By looking at the track records of these broken funds, I think the key take-away here is that buy-and-hold only works if you (a) understand what it is that you are holding, and (b) stick to a strict re-balance frequency. Moreover, betting on reversion to mean might only work if you are betting that an out-performing manager will fall back to mediocrity. The other direction is a tough ask.

You can run the comparison tool here: FundCompare


Please get in touch with Shyam for advice on investing in mutual funds.
You can either WhatsApp him or call him at 080-2665-0232.
He is an AMFI registered IFA who can advice you on Mirae, HDFC, ICICI Pru, UTI and Birla Sun Life funds.