Category: Your Money

Index Update 18.04.2015

MOMENTUM

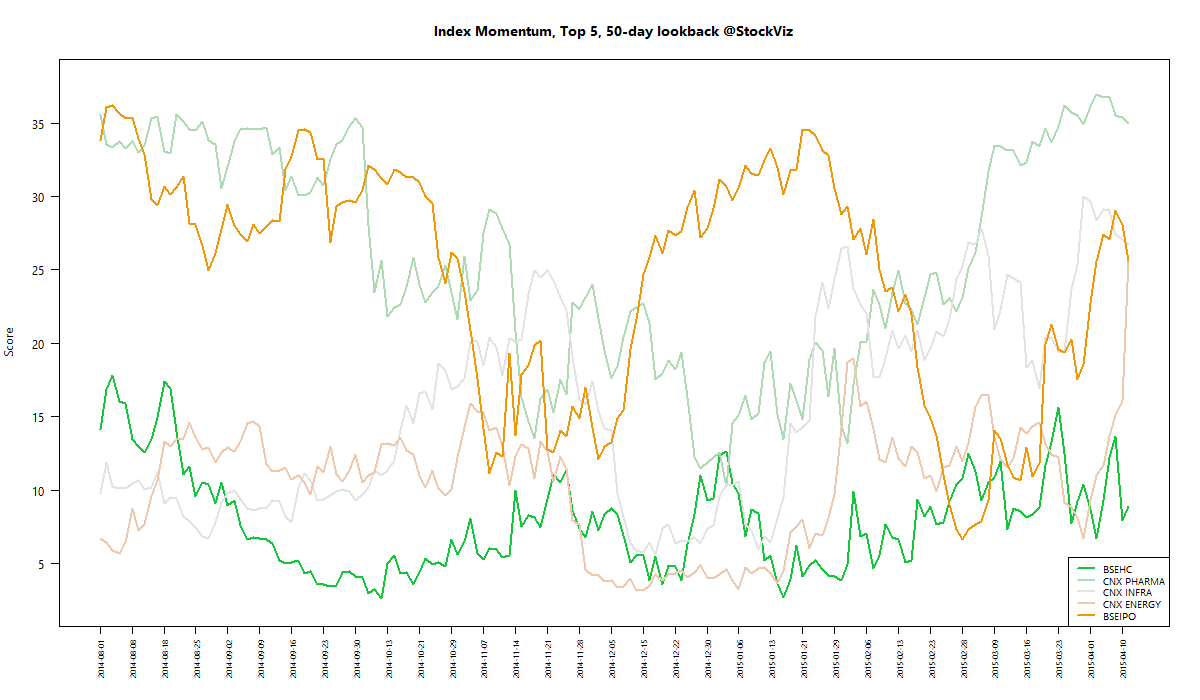
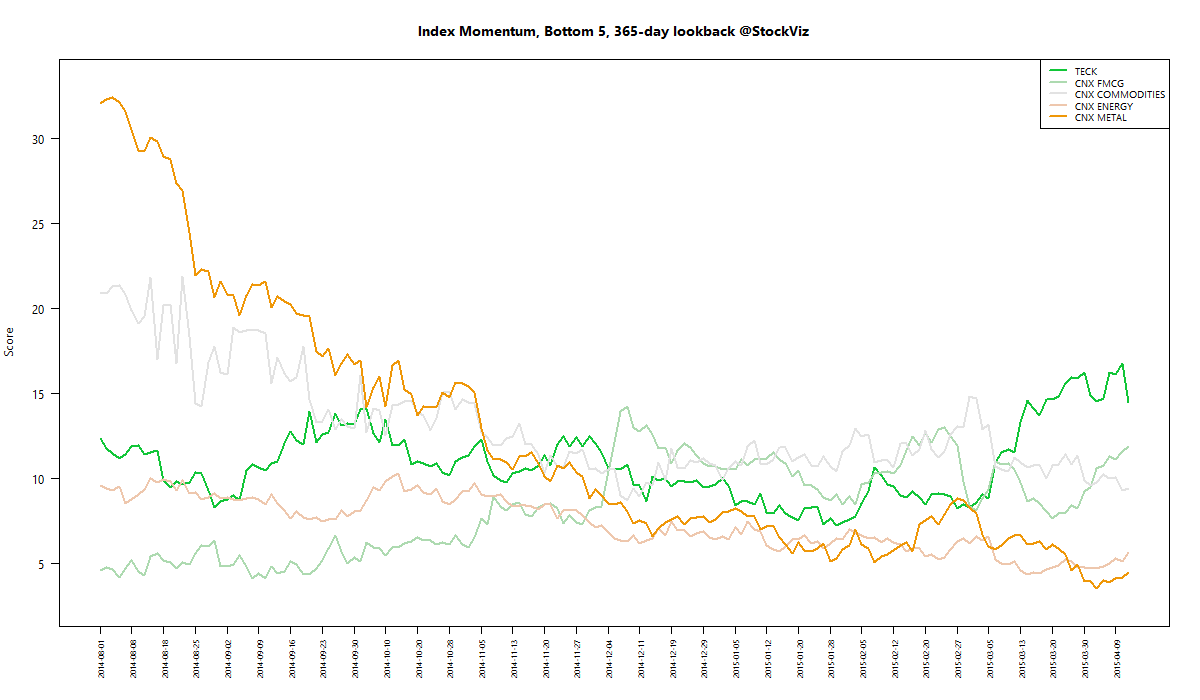
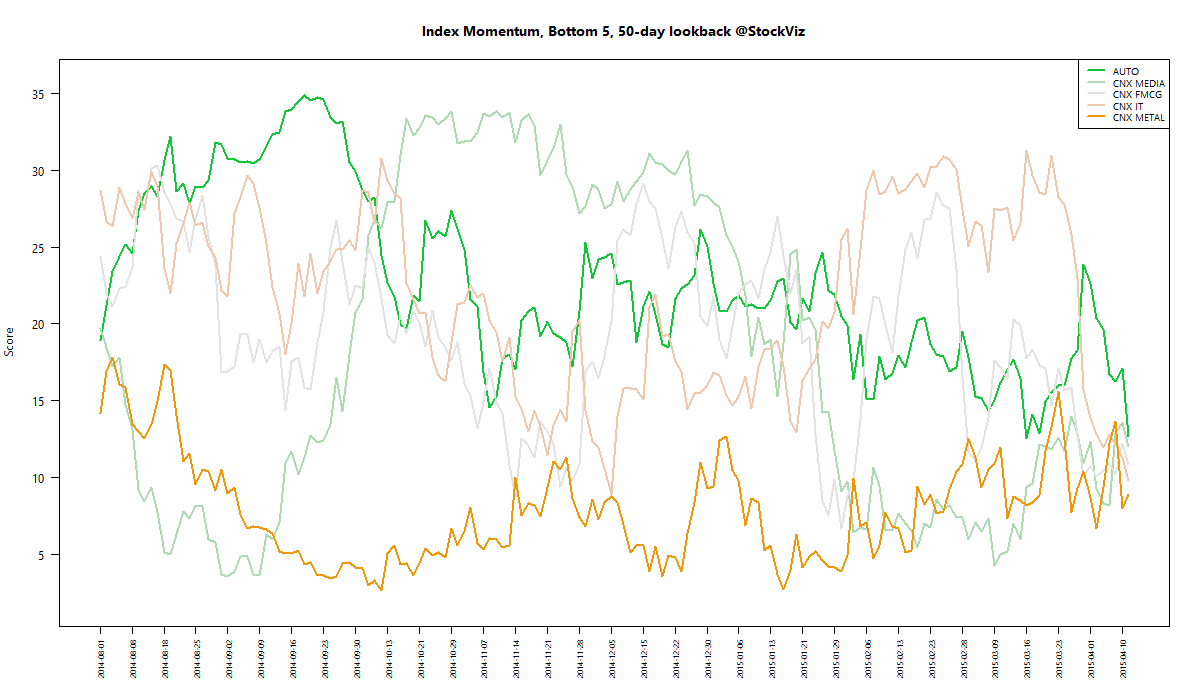
We run our proprietary momentum scoring algorithm on indices just like we do on stocks. You can use the momentum scores of sub-indices to get a sense for which sectors have the wind on their backs and those that are facing headwinds.

Traders can pick their longs in sectors with high short-term momentum and their shorts in sectors with low momentum. Investors can use the longer lookback scores to position themselves using our re-factored index Themes.

You can see how the momentum algorithm has performed on individual stocks here.

Here are the best and the worst sub-indices:

index momentum best 365 2015-04-15 png

index momentum best 50 2015-04-15 png

index momentum worst 365 2015-04-15 png

index momentum worst 50 2015-04-15 png

Refactored Index Performance

50-day performance, from February 03, 2015 through April 17, 2015:

Correlation Update 18.04.2015

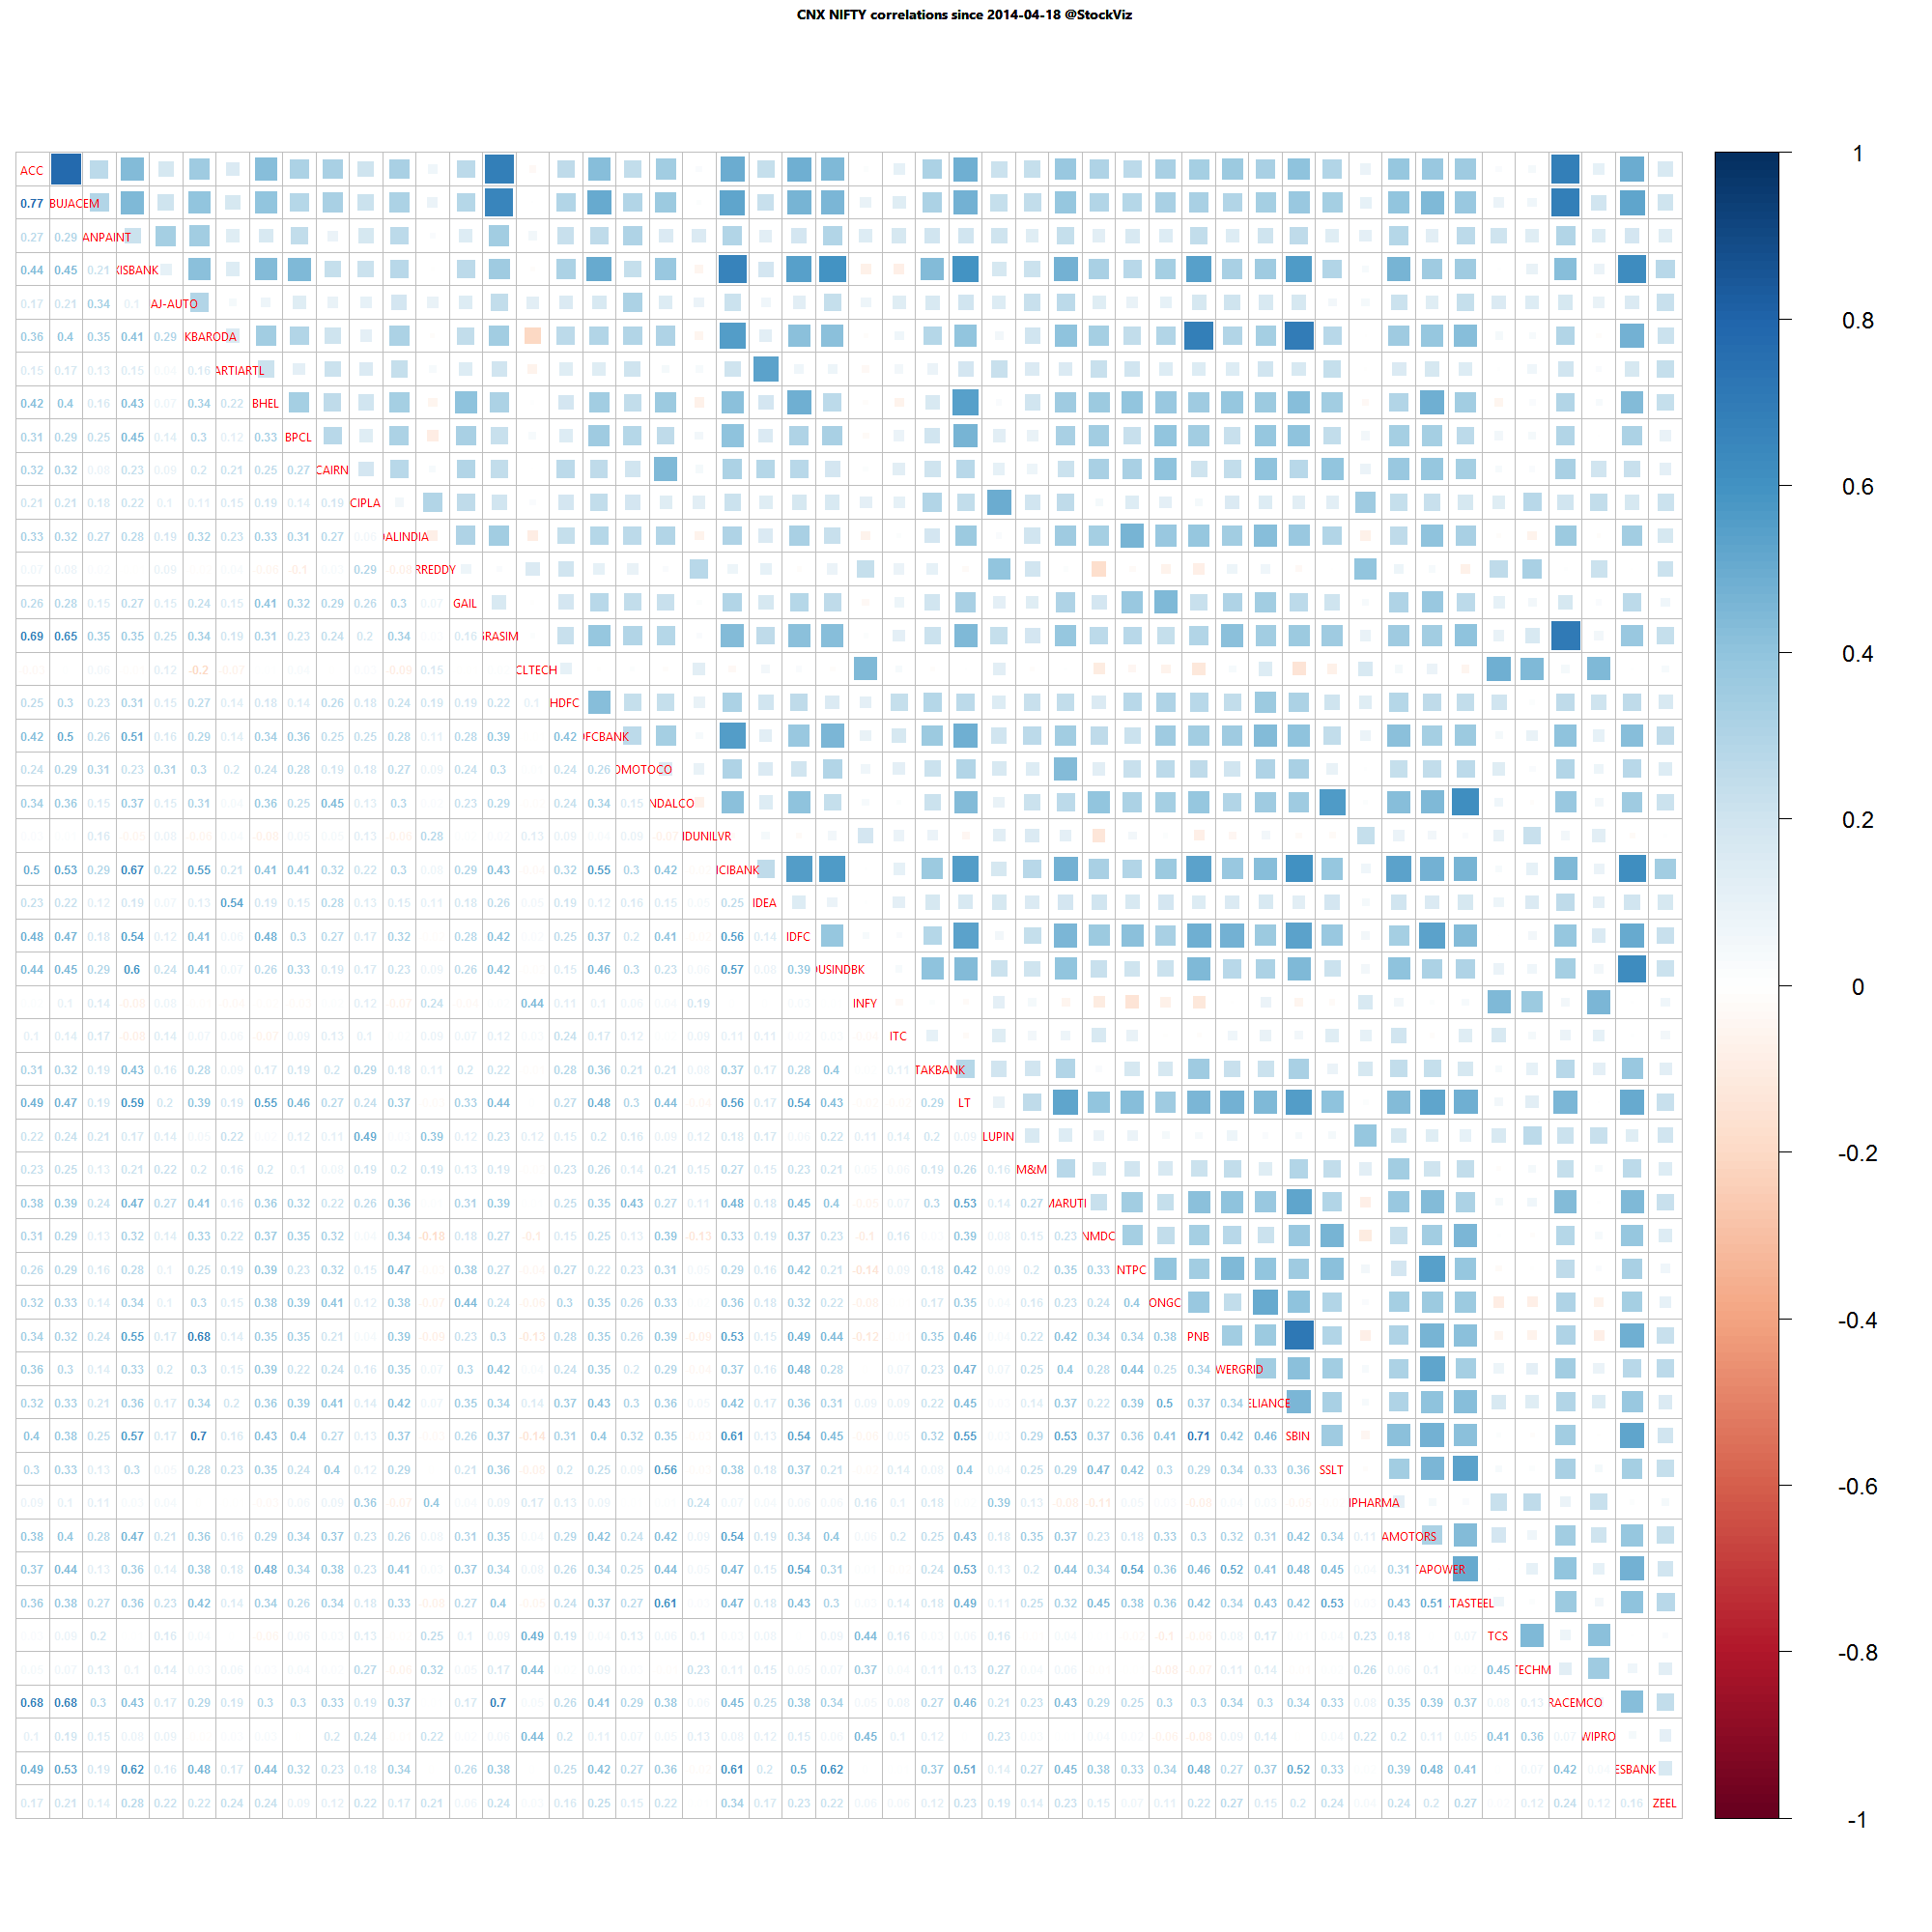
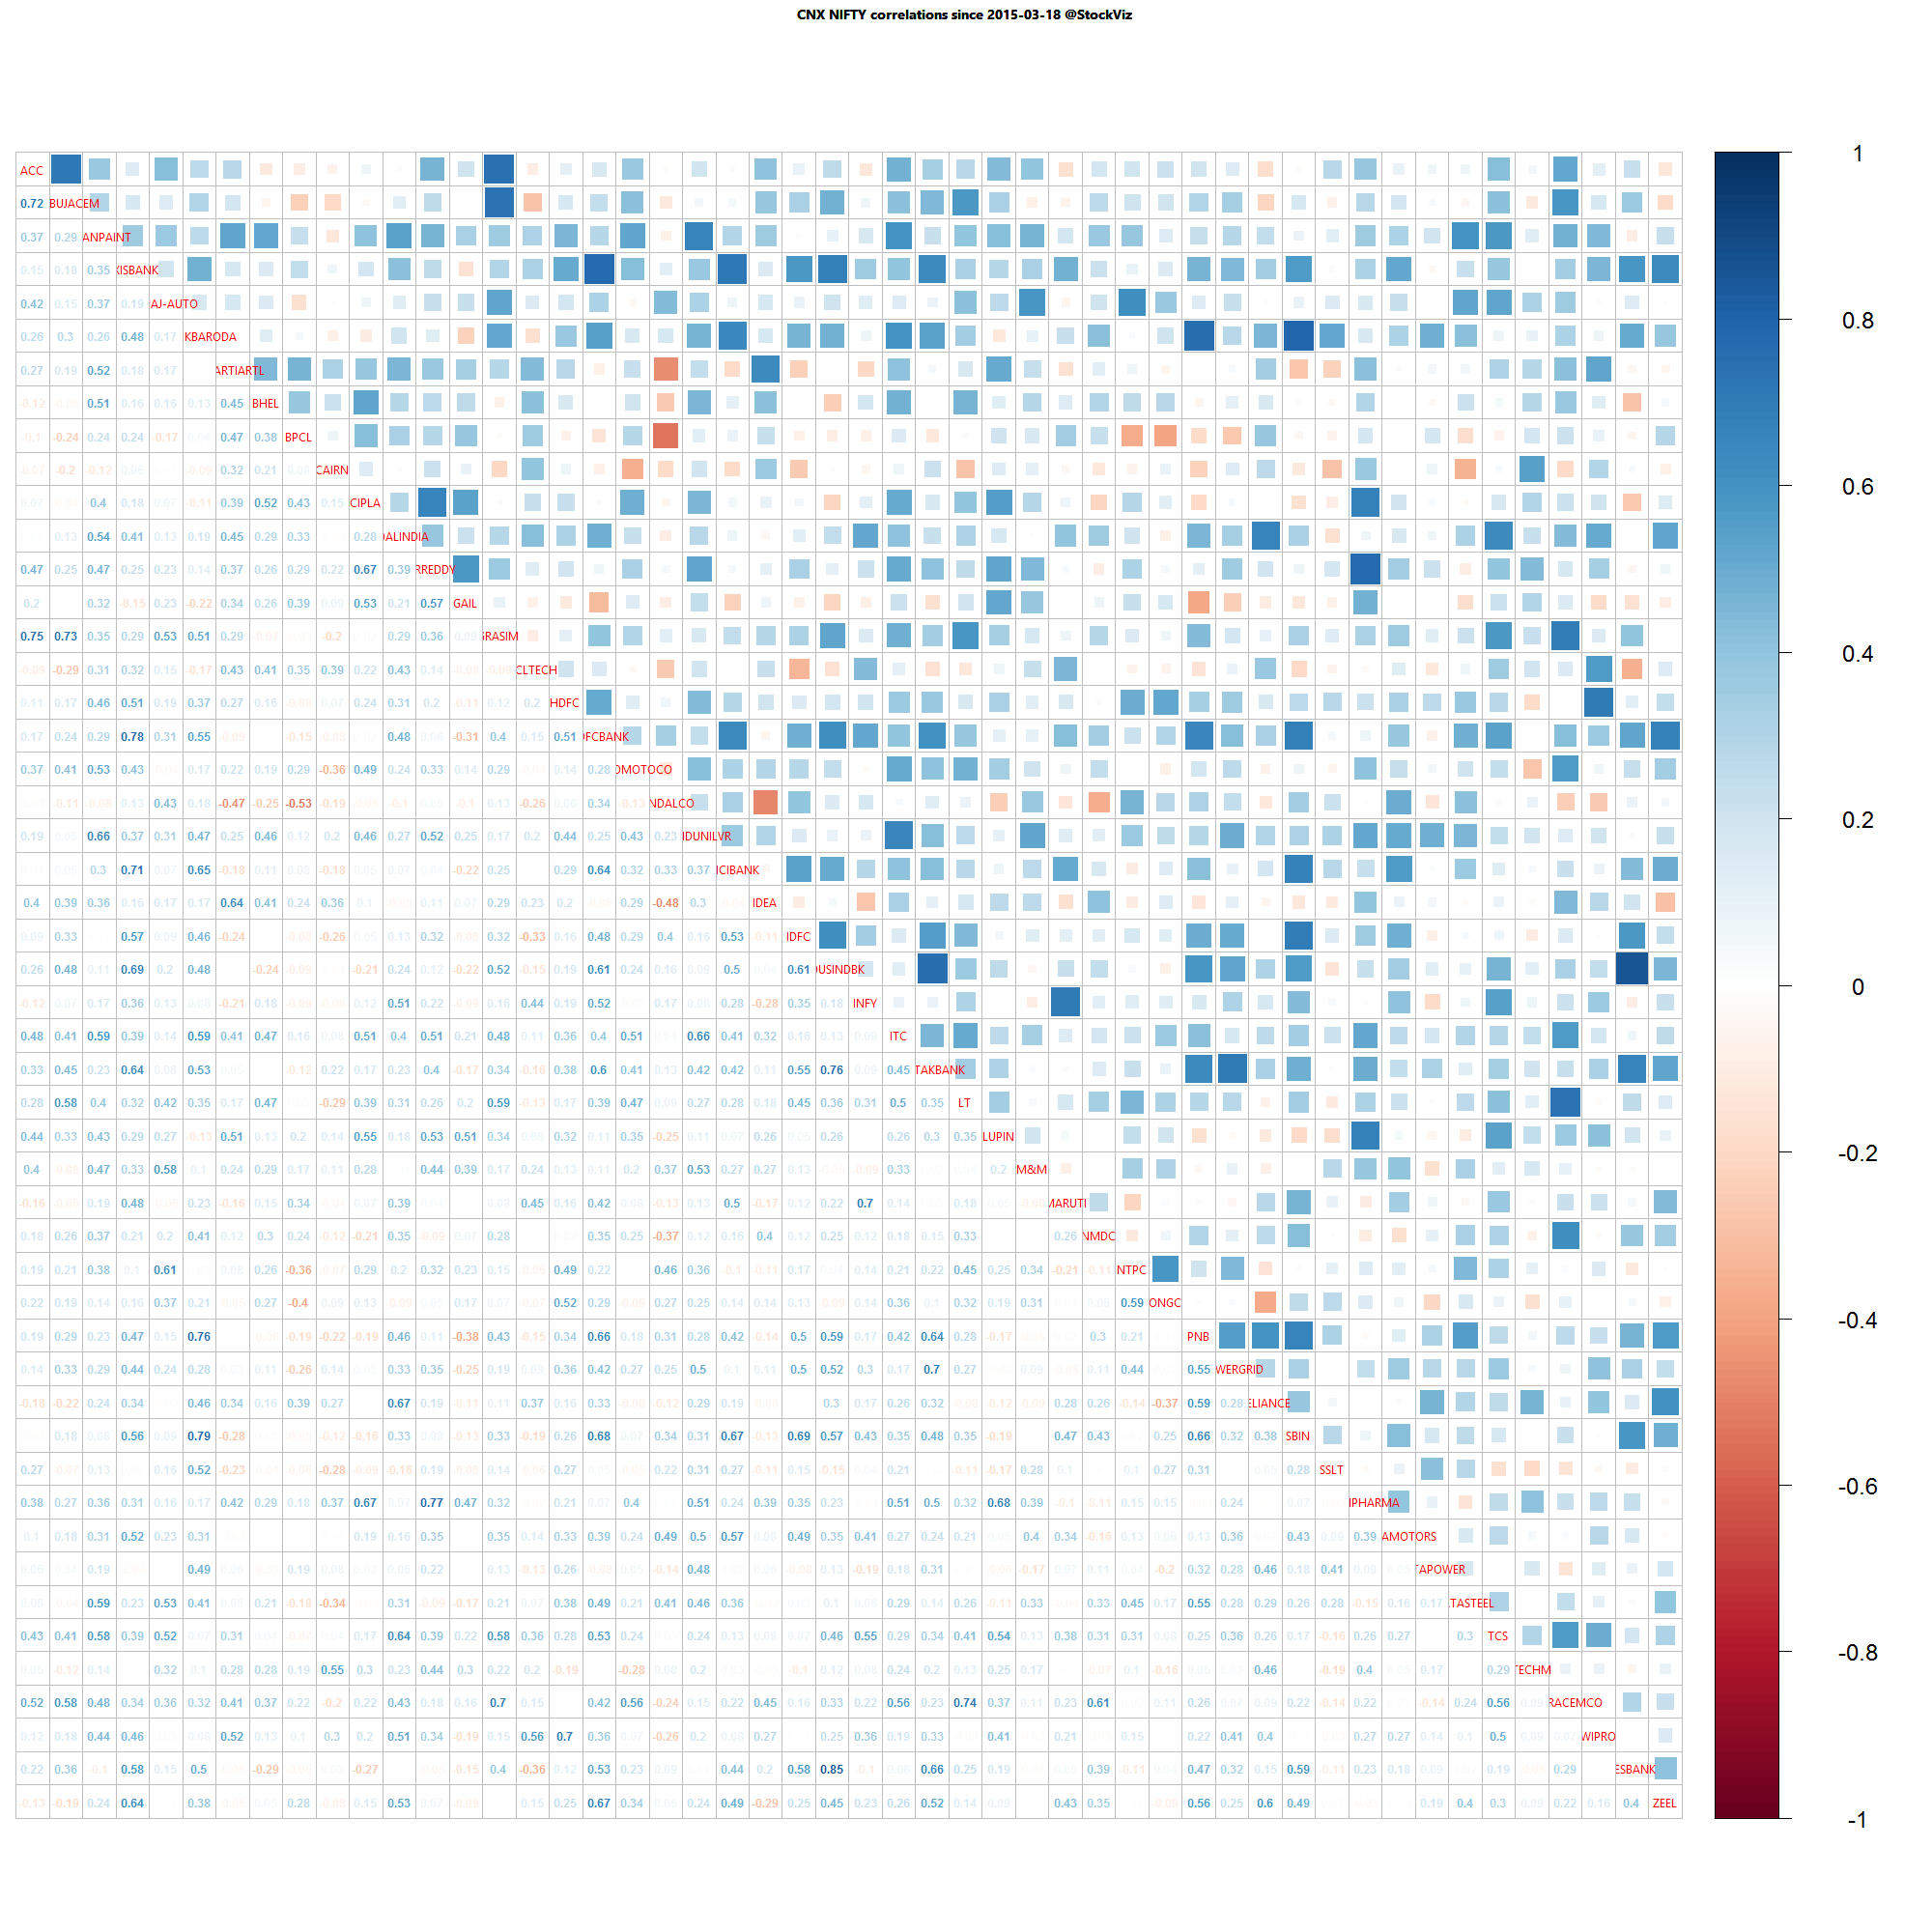
Nifty one year daily return correlations

Nifty one year daily return correlations

Nifty one month daily return correlations

Nifty one month daily return correlations

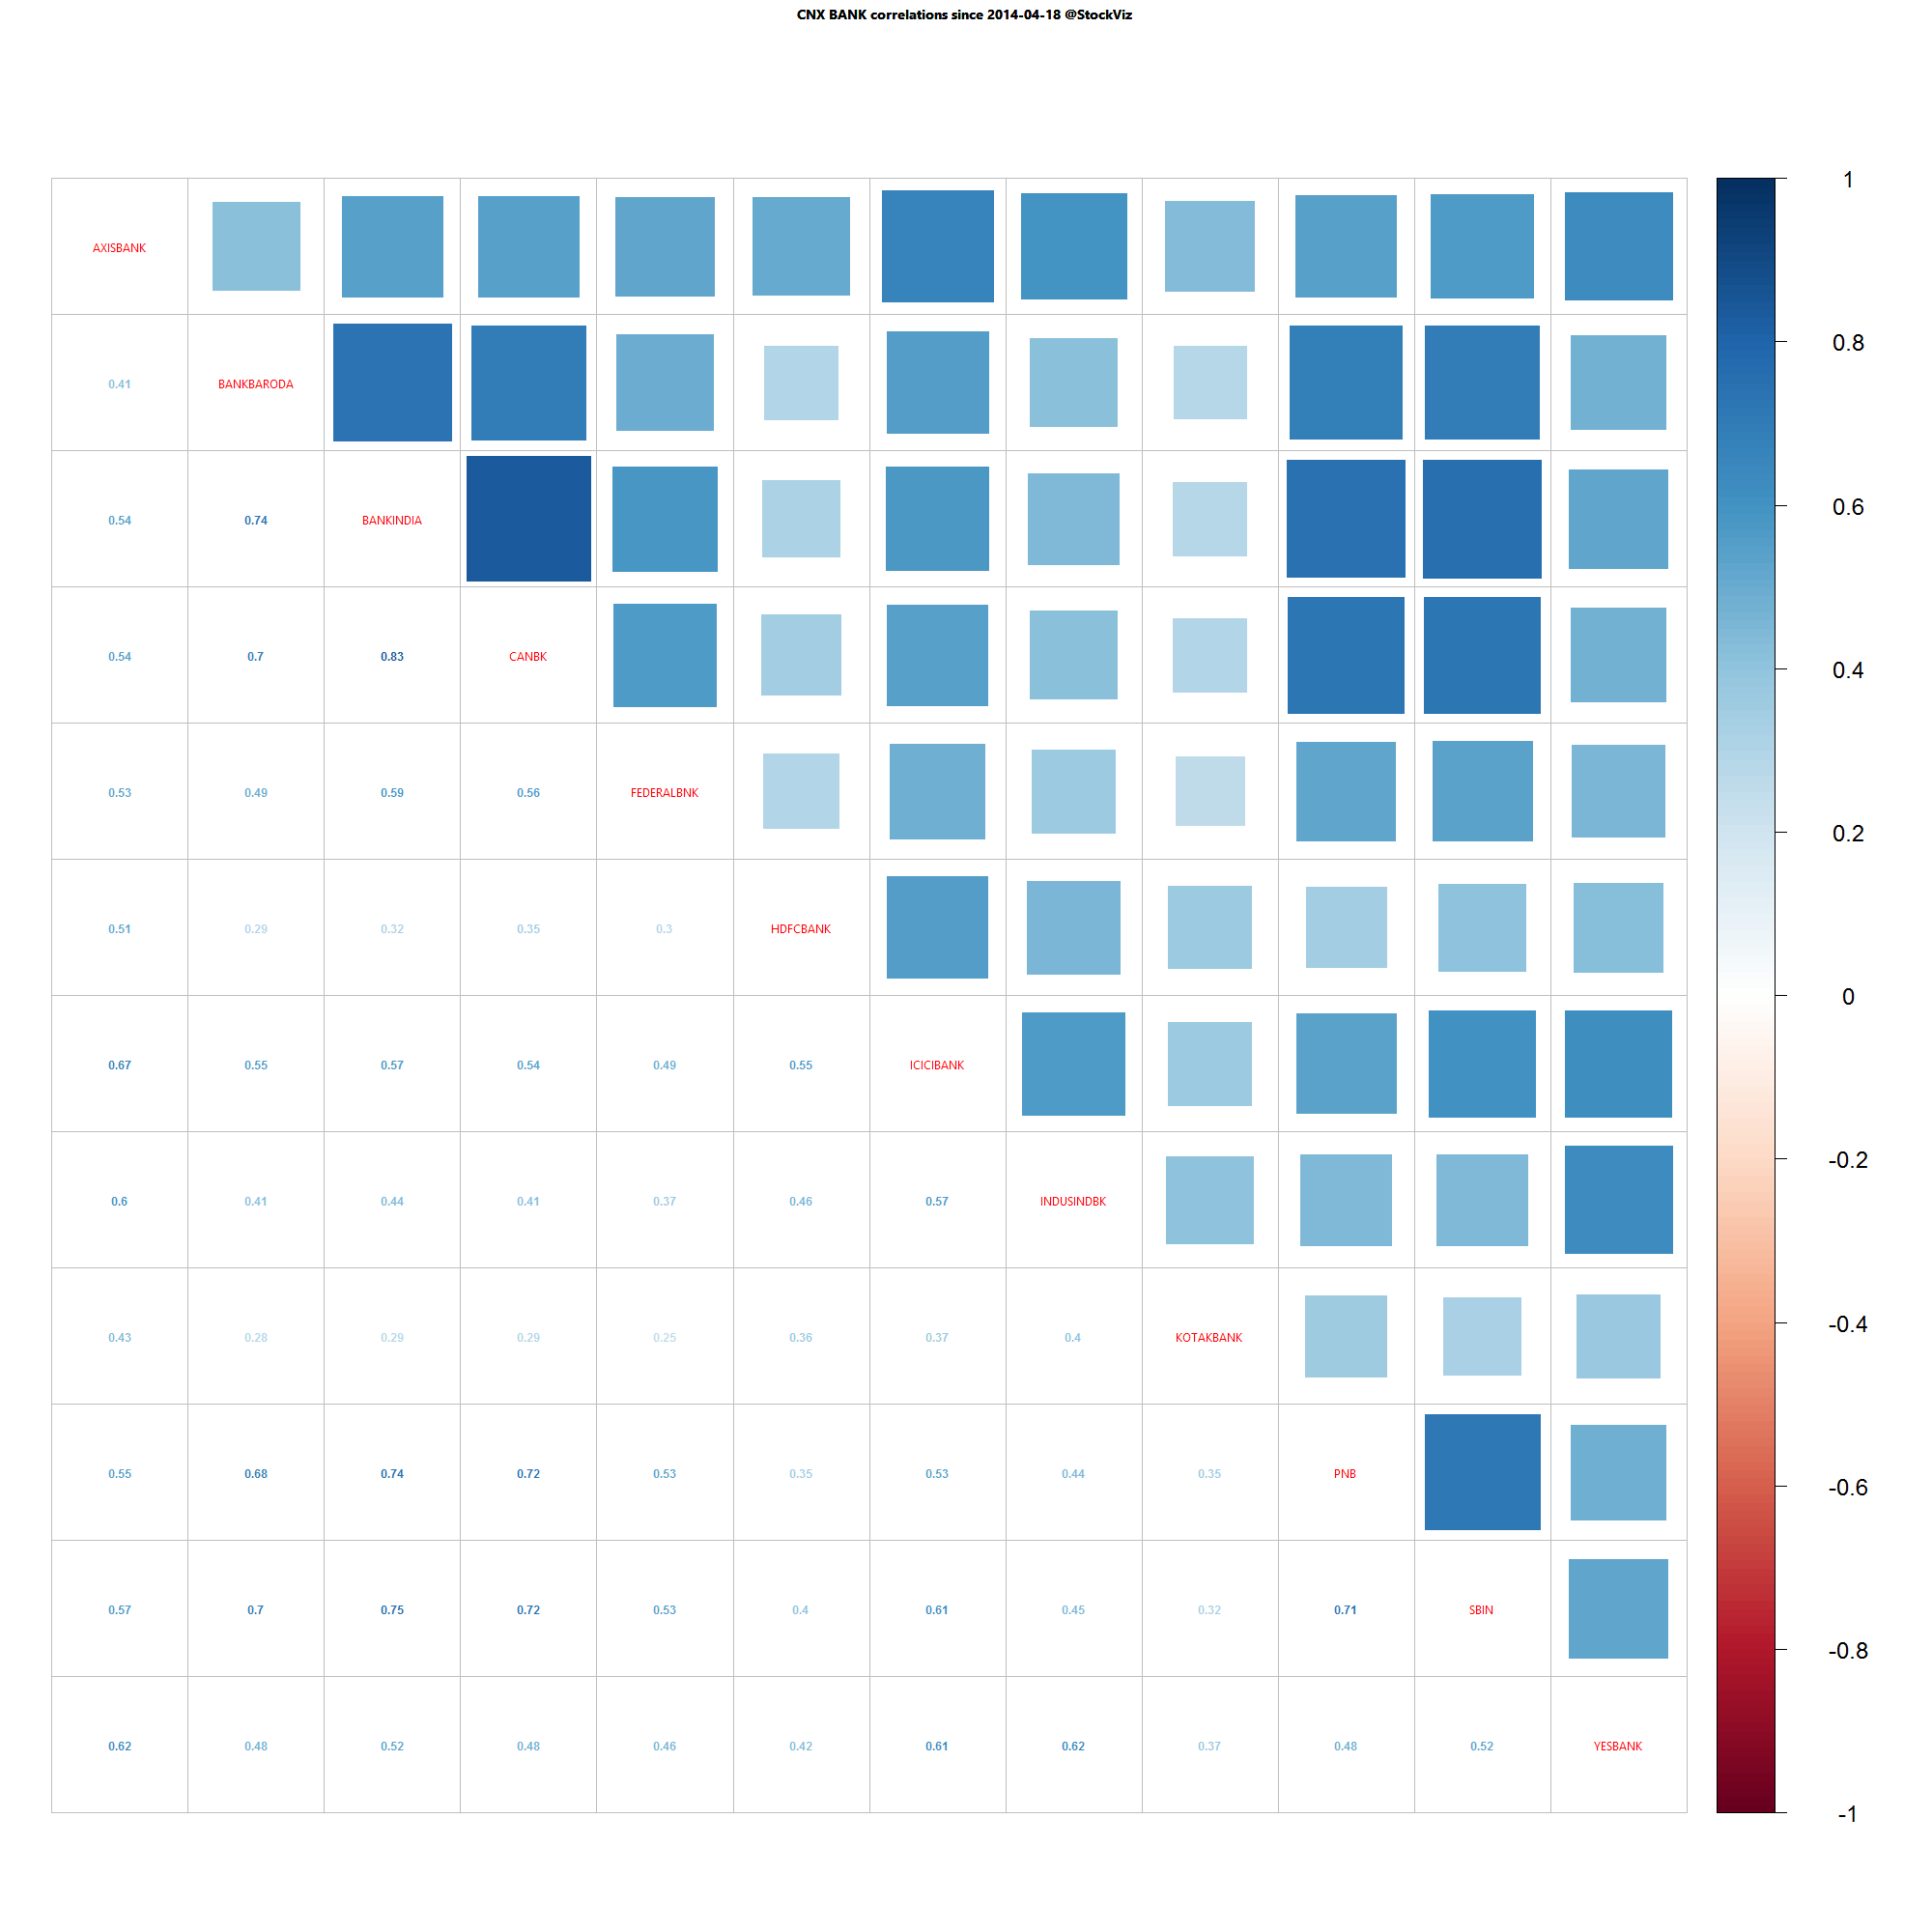
Bank Nifty one year daily return correlations

Bank Nifty one year daily return correlations

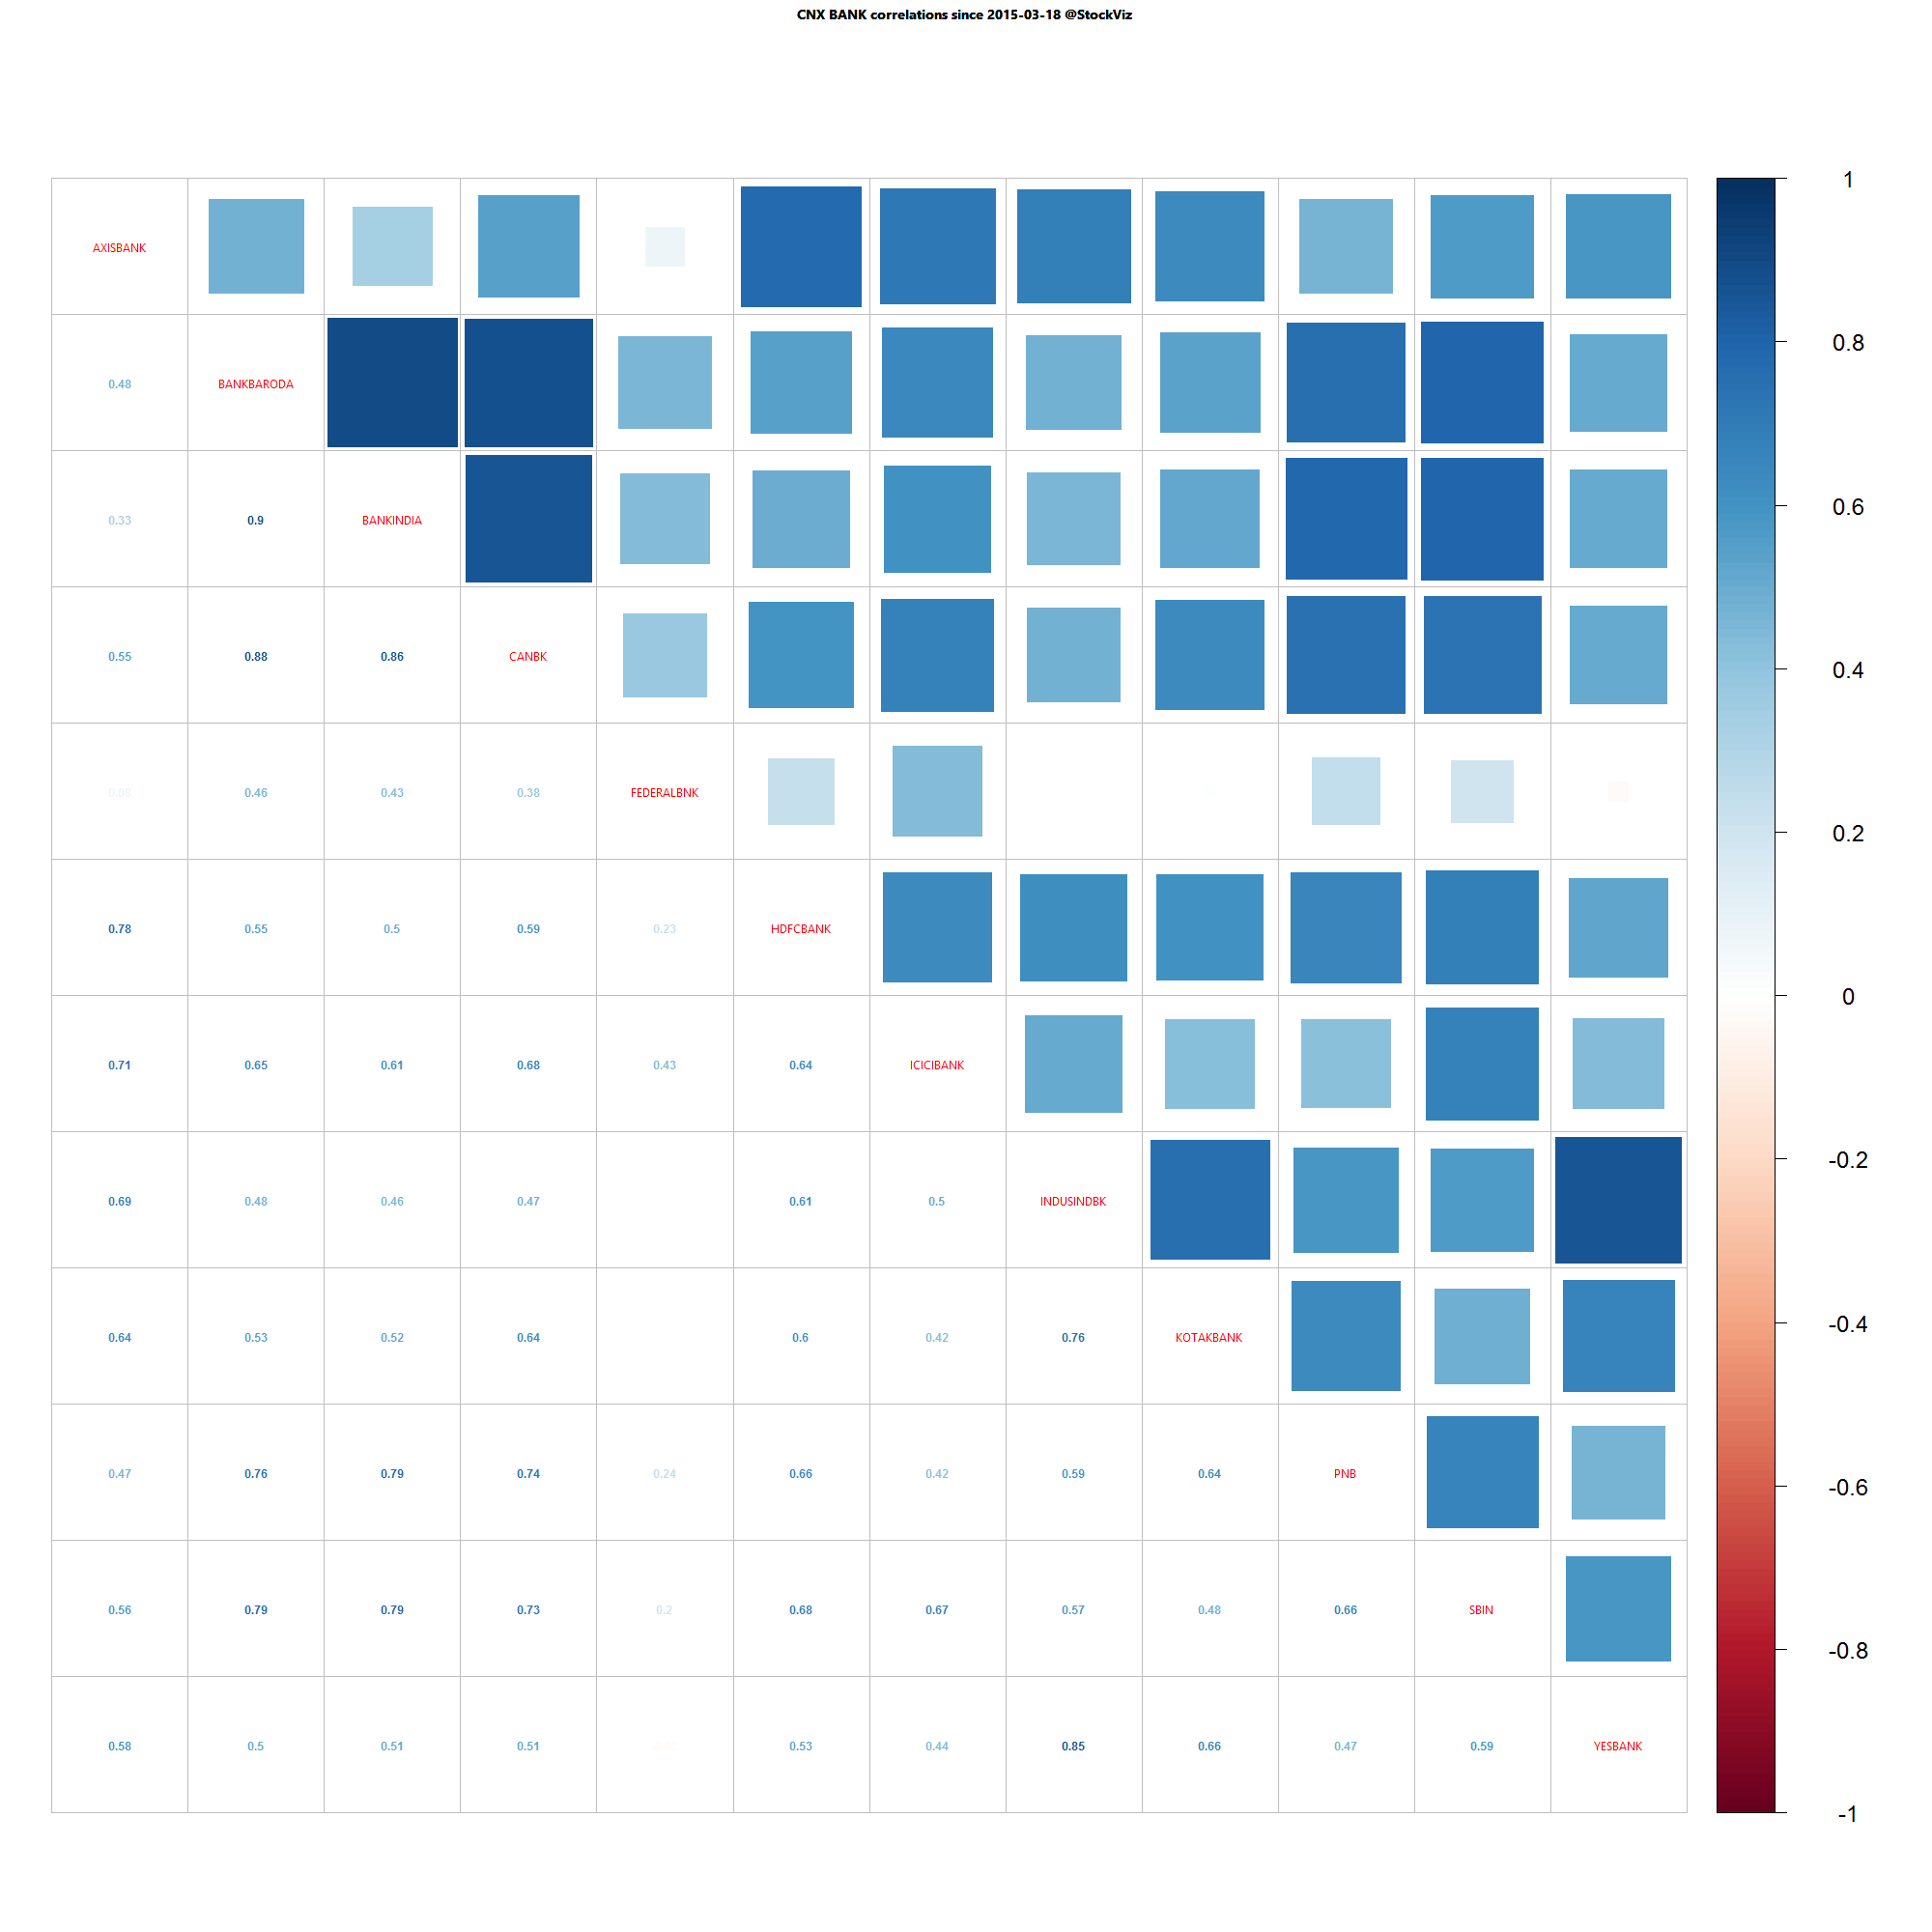
Bank Nifty one month daily return correlations

Bank Nifty one month daily return correlations

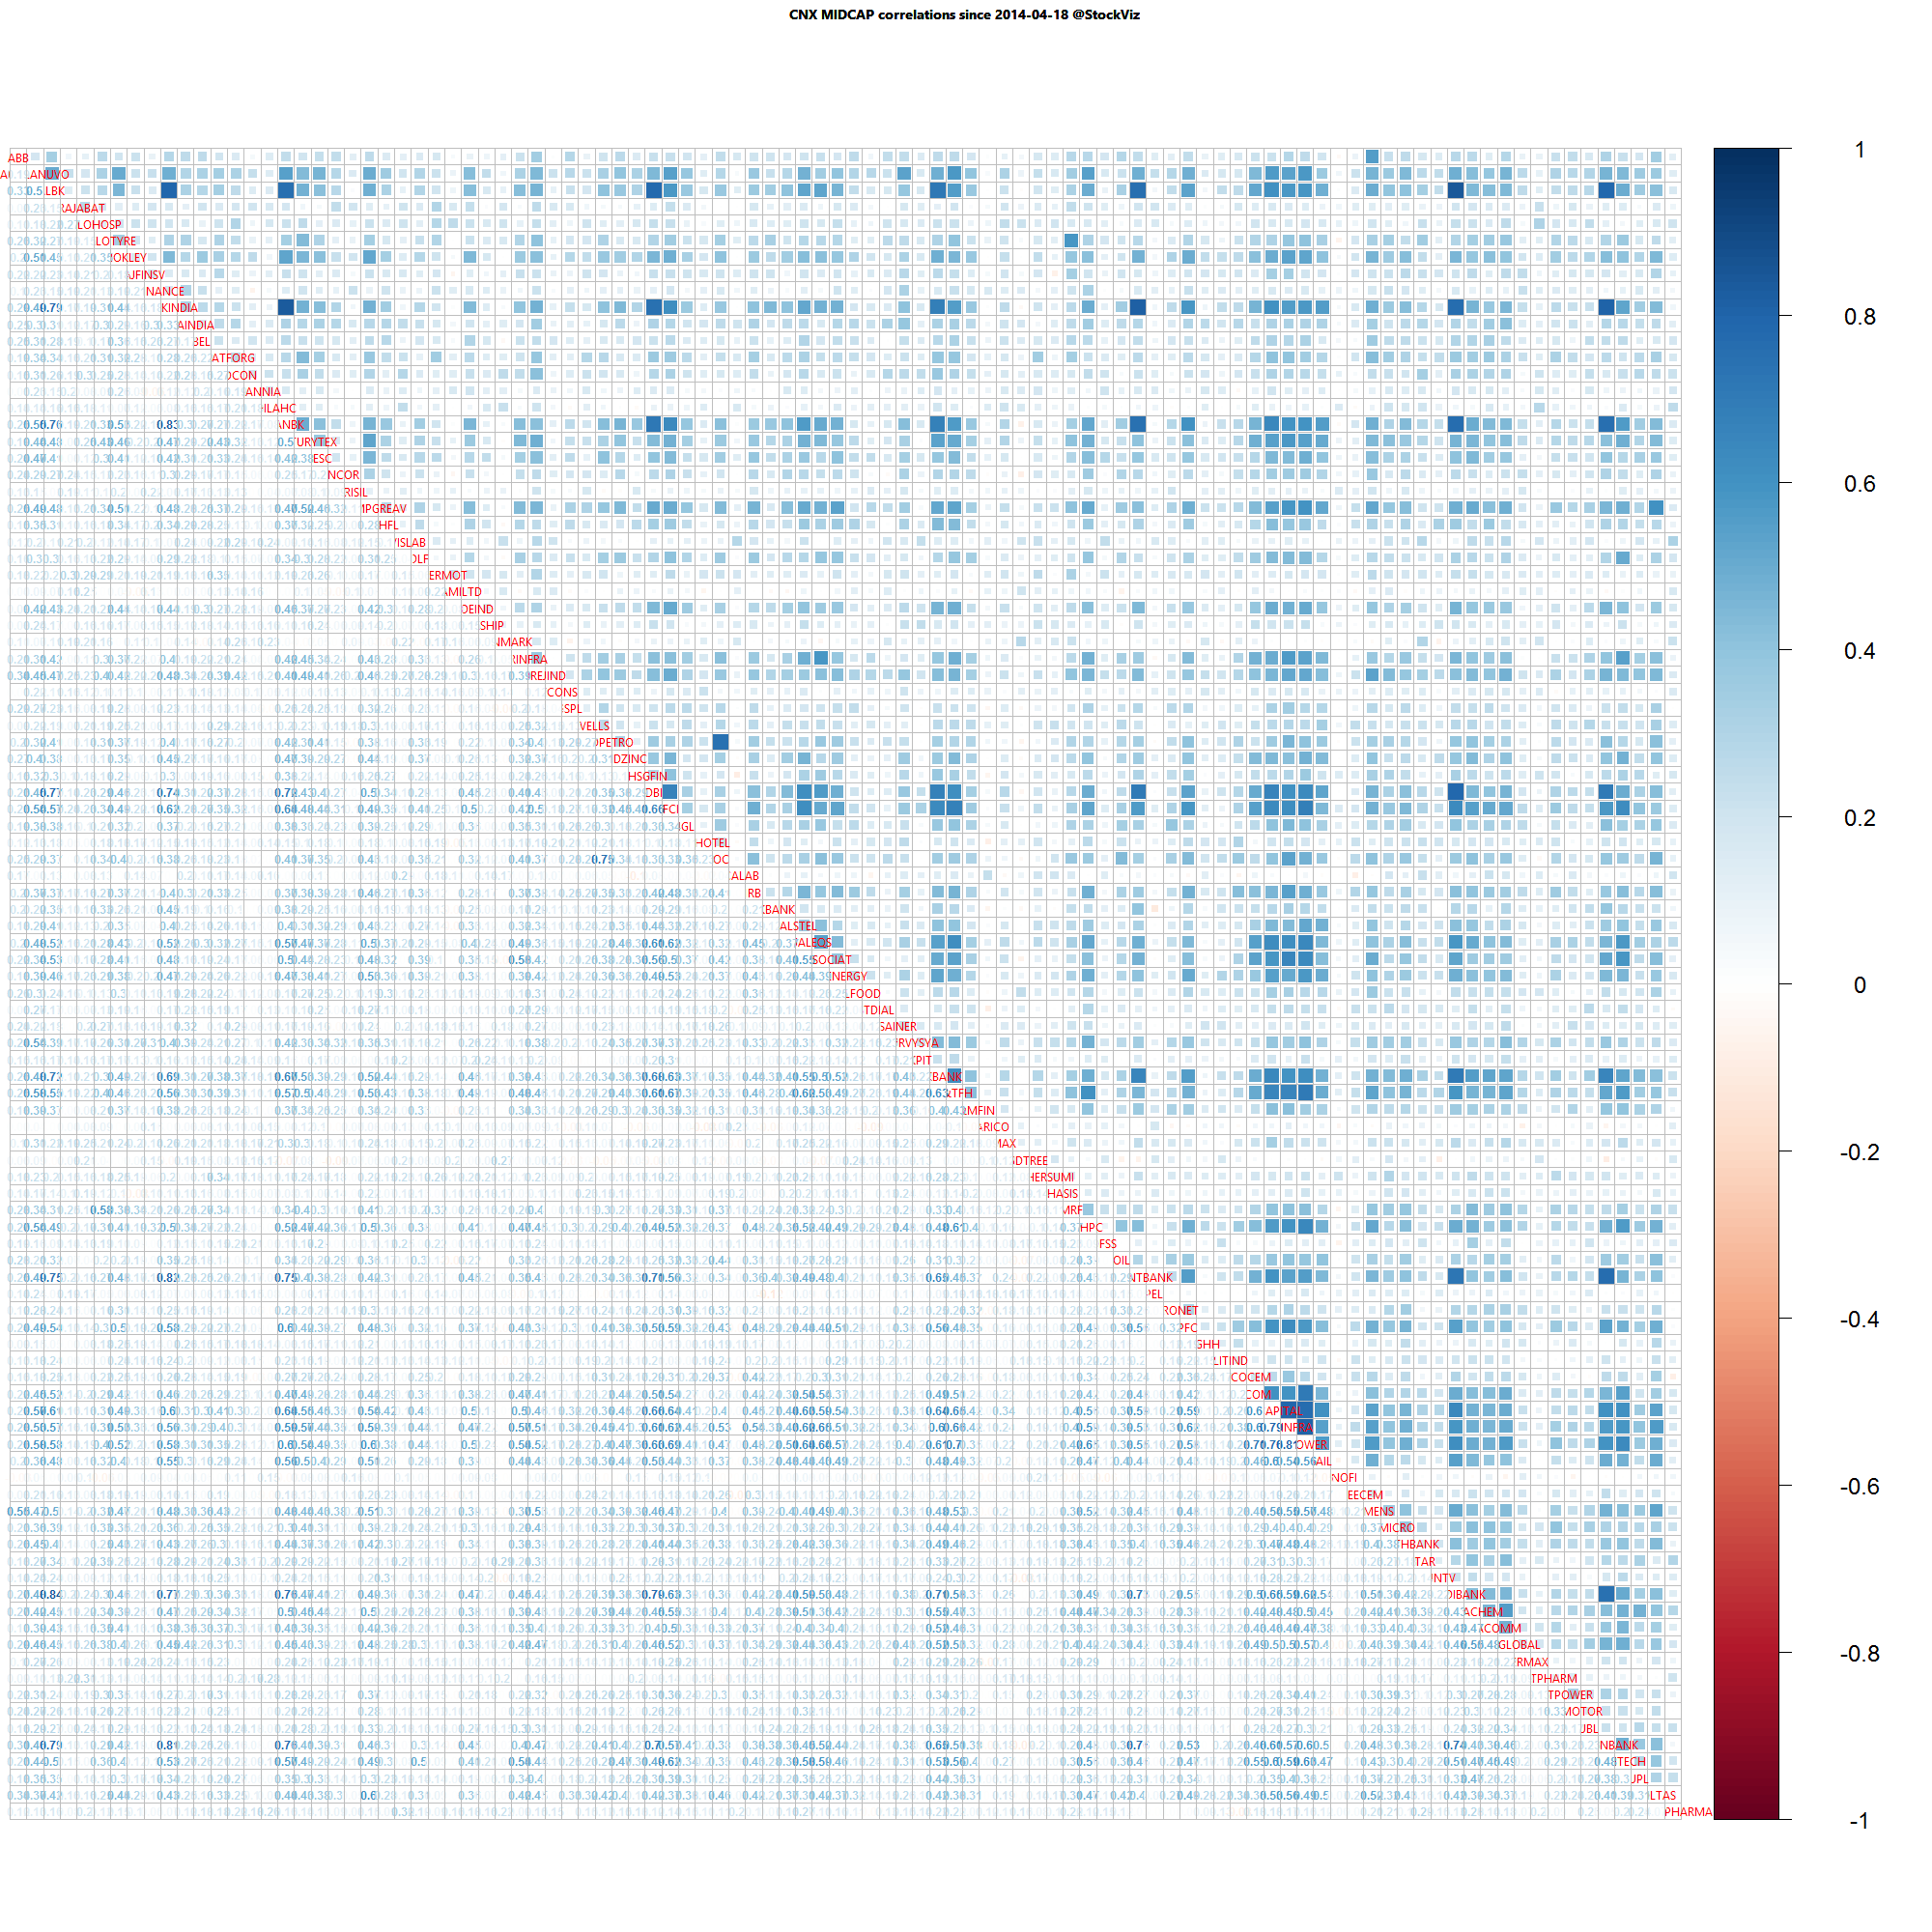
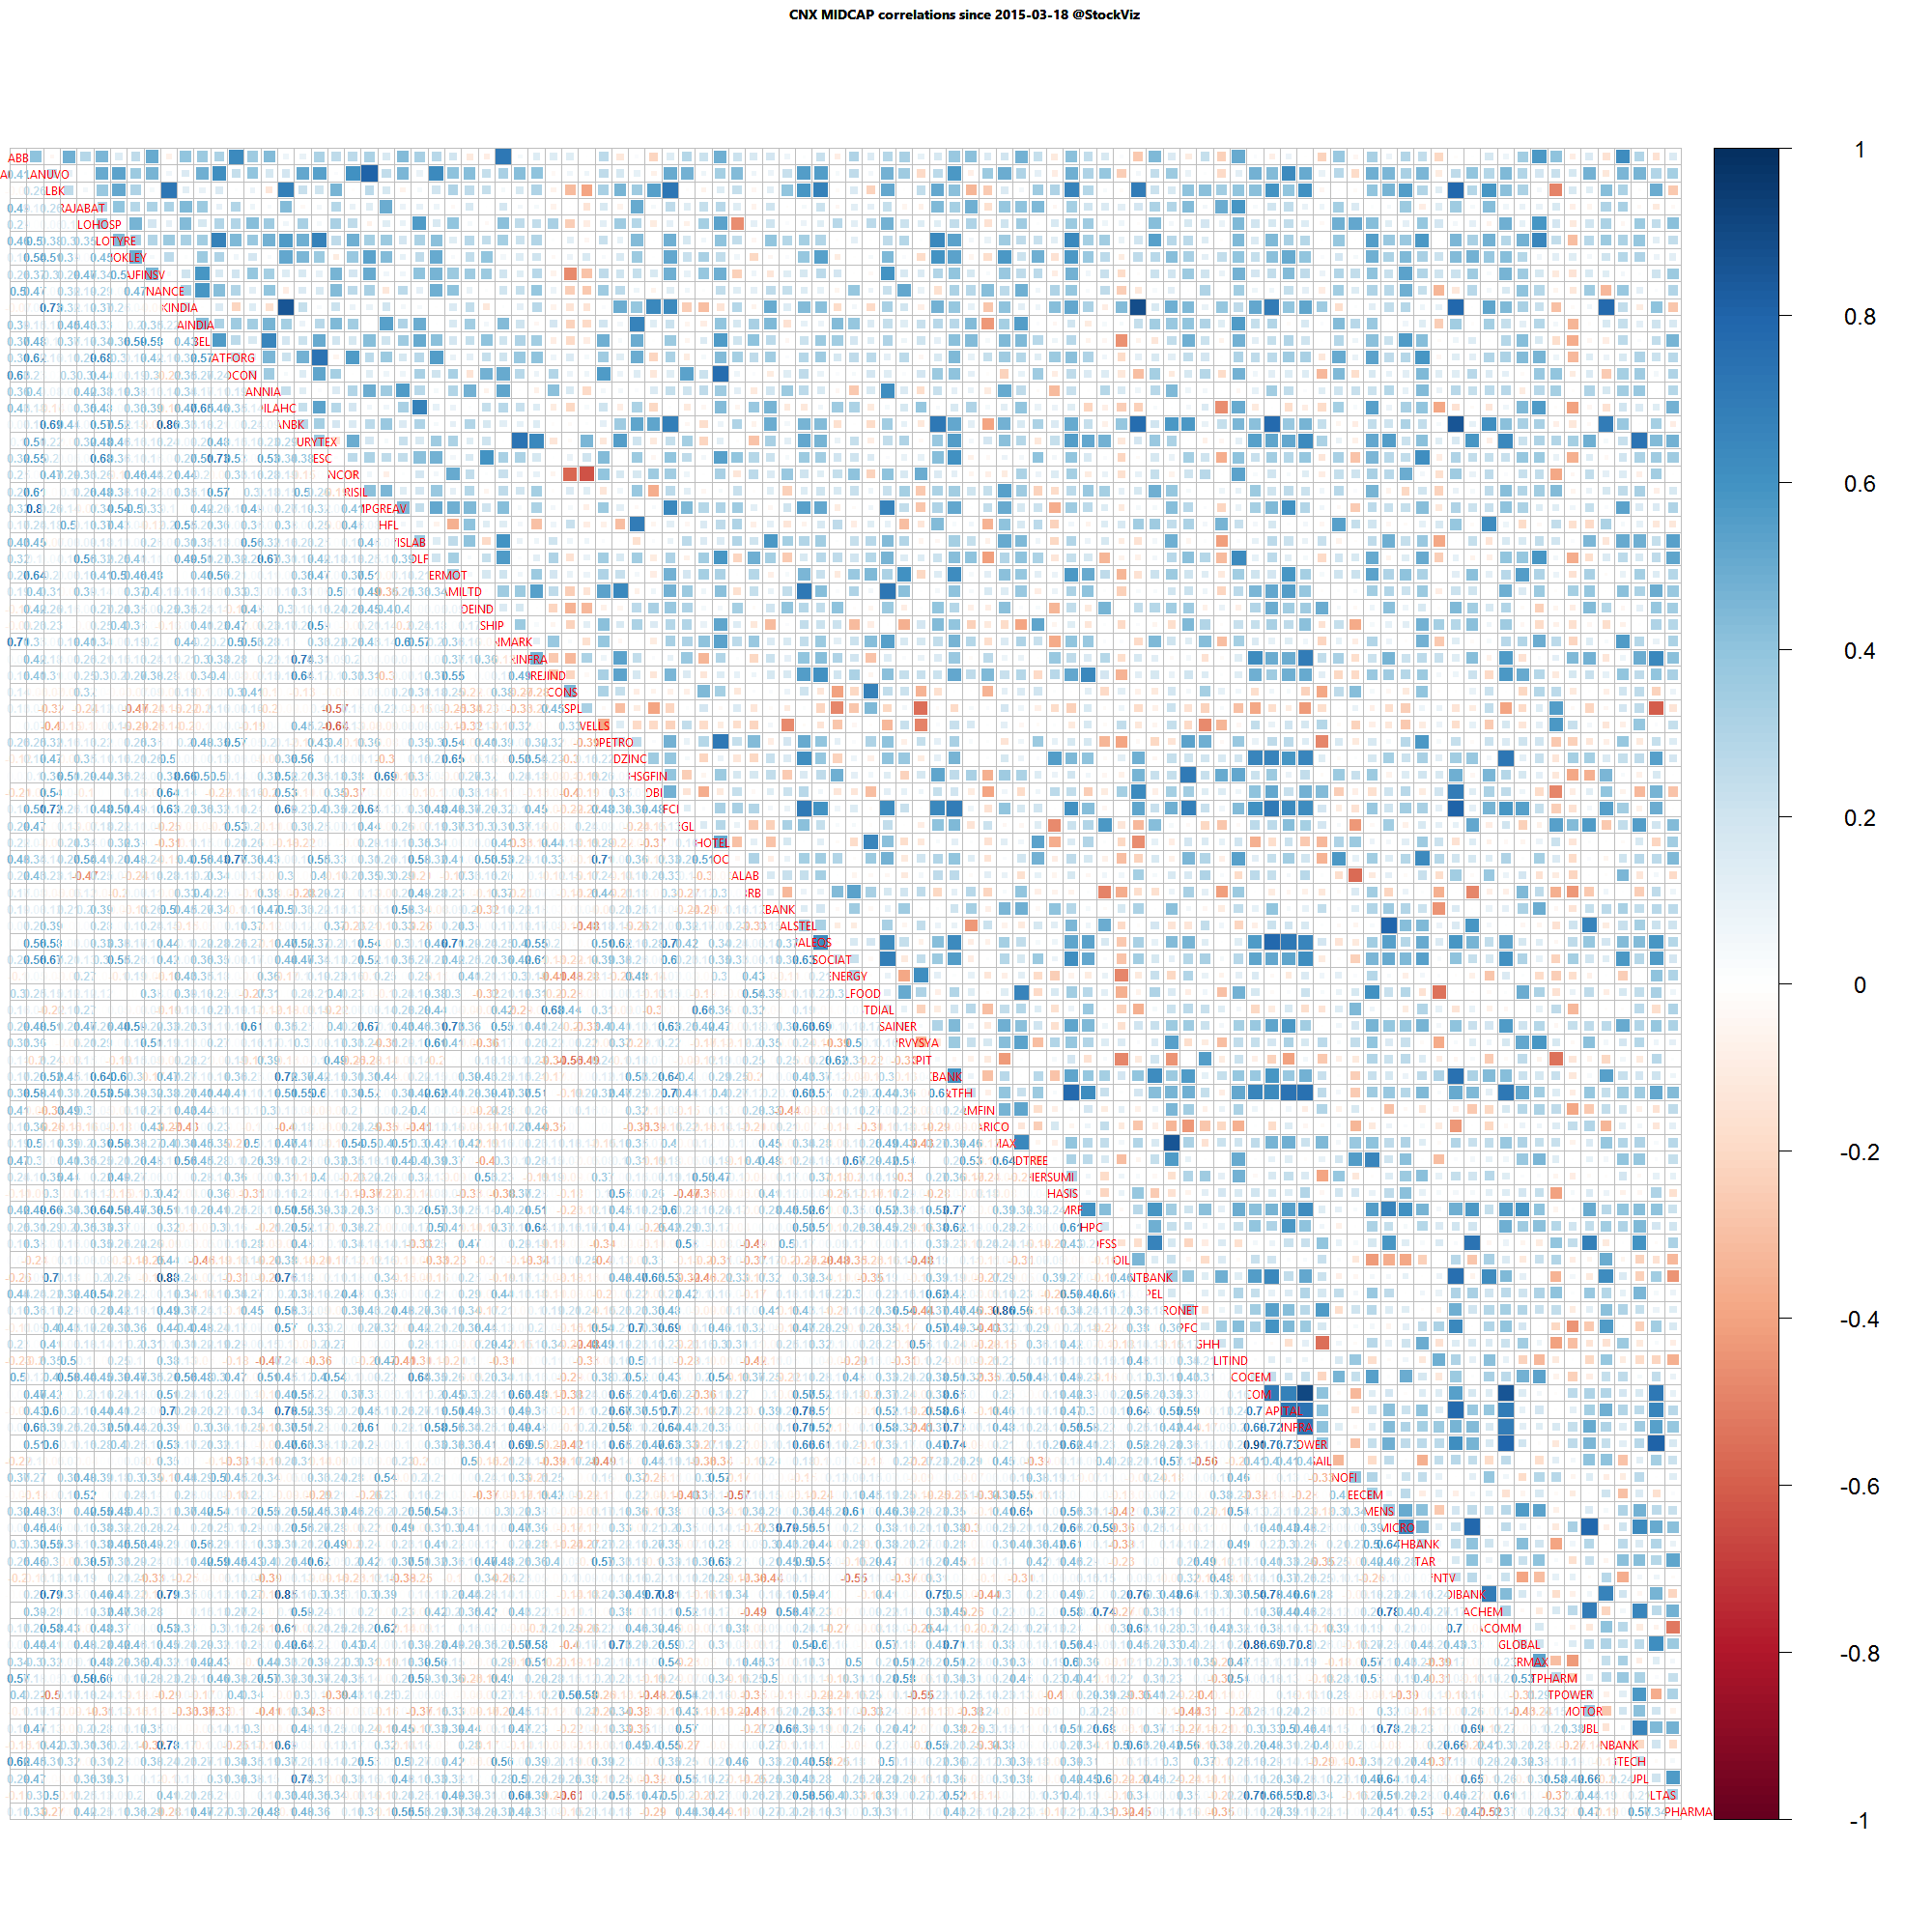
Midcap one year daily return correlations

Midcap one year daily return correlations

Midcap one month daily return correlations

Midcap one month daily return correlations

A lot of thick blue squares mean that positive correlations are high. Red squares mean negative correlations are high. Whites are the doldrums.

Holiday Bell 14.04.2015

Your world at 9am

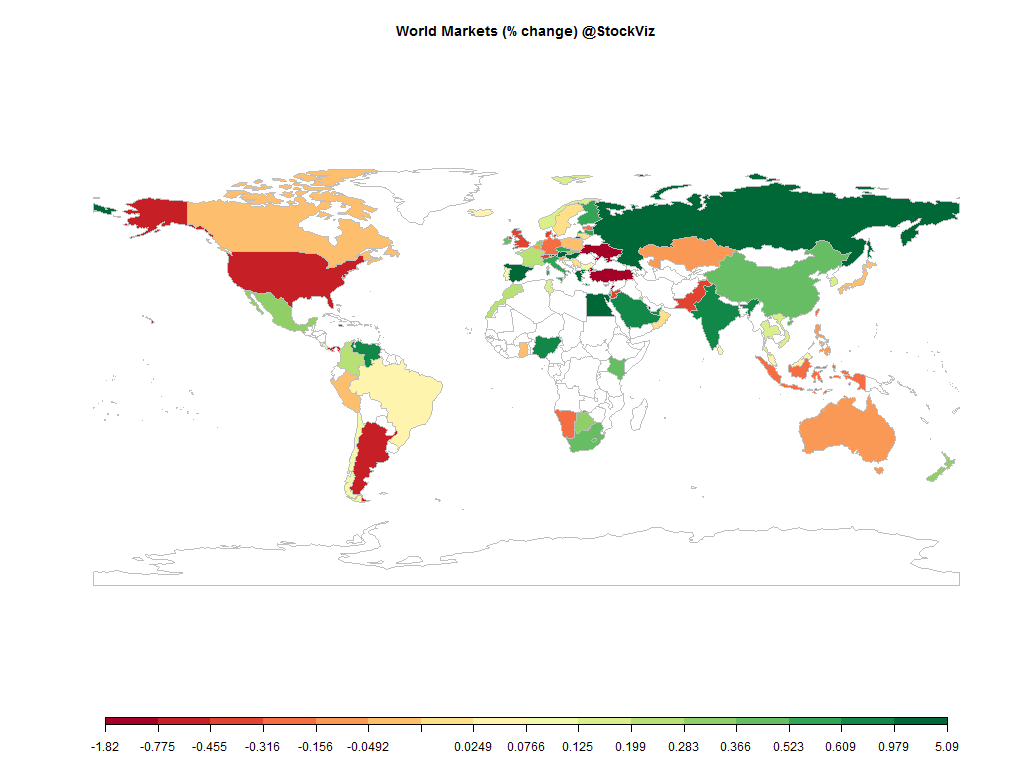
world.2015-04-14

Equities

Major
DAX(DEU) -0.29%
CAC(FRA) +0.26%
UKX(GBR) -0.36%
NKY(JPN) -0.04%
SPX(USA) -0.46%
MINTs
JCI(IDN) -0.17%
INMEX(MEX) +0.30%
NGSEINDX(NGA) +0.74%
XU030(TUR) -1.03%
BRICS
IBOV(BRA) +0.05%
SHCOMP(CHN) +0.49%
NIFTY(IND) +0.61%
INDEXCF(RUS) +1.28%
TOP40(ZAF) +0.37%

Commodities

Energy
Brent Crude Oil +0.86%
Ethanol +0.00%
Heating Oil +0.85%
Natural Gas +0.48%
RBOB Gasoline +0.57%
WTI Crude Oil +0.98%
Metals
Copper +0.00%
Gold 100oz +0.11%
Palladium -0.74%
Platinum +0.29%
Silver 5000oz +0.00%

Currencies

USDEUR:-0.13% USDJPY:-0.24%

MINTs
USDIDR(IDN) +0.09%
USDMXN(MEX) -0.13%
USDNGN(NGA) -0.00%
USDTRY(TUR) -0.26%
BRICS
USDBRL(BRA) +1.49%
USDCNY(CHN) -0.03%
USDINR(IND) +0.30%
USDRUB(RUS) -0.29%
USDZAR(ZAF) -0.48%
Agricultural
Cattle +0.00%
Coffee (Robusta) +0.00%
Lumber -1.66%
Wheat +0.10%
White Sugar +0.00%
Corn +0.13%
Orange Juice -2.09%
Cocoa +0.00%
Coffee (Arabica) -0.74%
Cotton -0.08%
Feeder Cattle +0.00%
Lean Hogs +0.00%
Sugar #11 +1.17%
Soybean Meal +0.42%
Soybeans +0.21%

Must reads

S&P: India’s hard-won fiscal improvement is vulnerable to financial or commodity shock, because of high subsidy and public debt. (ET, #economy)

Consumer price inflation hit a three-month low of 5.17% in March. (FE, #inflation)

Soon, we will all be totally jobless:

  • Robot cook: A pair of dexterous robotic hands, suspended from the ceiling, assemble the ingredients, mix them, and cook them in pots and pans as required, on a hob or in an oven. When the dish is ready, they then serve it with the flourish of a professional. (Economist)
  • On-call scheduling: Software that forecasts staffing needs based on real-time sales and traffic information. (WSJ)
  • Proof that income inequality cannot be fixed by education: High-skilled workers have moved down the occupational ladder and have begun to perform jobs traditionally performed by lower-skilled workers. (NBER)

Markets closed today on account of Dr. Baba Saheb Ambedkar Jayanti
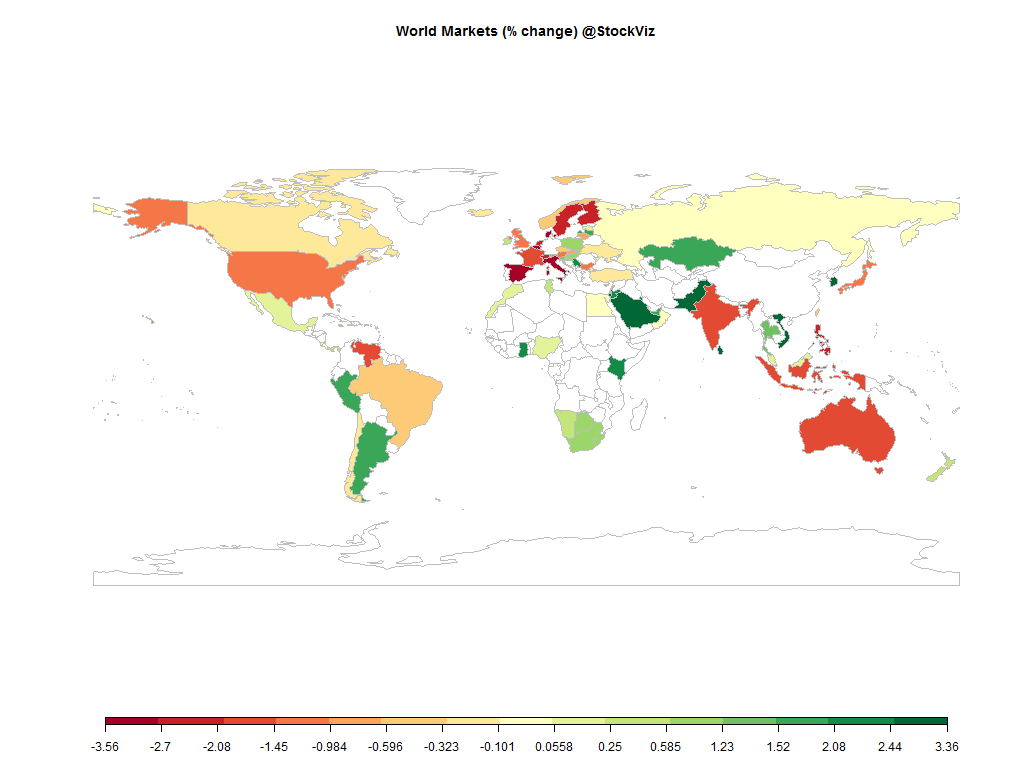
Weekly Recap: What Causes Recessions?

world.2015-04-1.2015-04-10

Equities

Major
DAX(DEU) +3.11%
CAC(FRA) +3.52%
UKX(GBR) +4.12%
NKY(JPN) +4.59%
SPX(USA) +2.24%
MINTs
JCI(IDN) +0.45%
INMEX(MEX) +2.01%
NGSEINDX(NGA) +1.57%
XU030(TUR) +1.23%
BRICS
IBOV(BRA) +3.42%
SHCOMP(CHN) +5.88%
NIFTY(IND) +2.26%
INDEXCF(RUS) -0.29%
TOP40(ZAF) +2.18%

Commodities

Energy
Heating Oil +1.02%
Brent Crude Oil +1.01%
Ethanol +1.03%
Natural Gas -4.35%
RBOB Gasoline -1.32%
WTI Crude Oil +3.27%
Metals
Silver 5000oz -1.20%
Palladium +3.72%
Platinum +0.60%
Copper -0.36%
Gold 100oz +0.17%

Currencies

USDEUR:+1.61% USDJPY:+0.50%

MINTs
USDIDR(IDN) -0.93%
USDMXN(MEX) +0.66%
USDNGN(NGA) +0.01%
USDTRY(TUR) +1.17%
BRICS
USDBRL(BRA) -3.03%
USDCNY(CHN) +0.17%
USDINR(IND) -0.28%
USDRUB(RUS) -6.78%
USDZAR(ZAF) +0.07%
Agricultural
Sugar #11 +4.55%
Coffee (Arabica) +1.08%
Coffee (Robusta) +6.95%
Corn -1.18%
Feeder Cattle -3.00%
White Sugar +2.18%
Cotton +3.65%
Lean Hogs -0.53%
Lumber -2.52%
Orange Juice -9.96%
Soybean Meal -6.64%
Soybeans -3.82%
Cattle -1.88%
Cocoa +0.99%
Wheat -0.57%

Credit Indices

Index Change
Markit CDX EM +1.47%
Markit CDX NA HY +0.49%
Markit CDX NA IG -3.14%
Markit iTraxx Asia ex-Japan IG -4.97%
Markit iTraxx Australia -4.50%
Markit iTraxx Europe -0.71%
Markit iTraxx Europe Crossover -11.21%
Markit iTraxx Japan -1.42%
Markit iTraxx SovX Western Europe -0.56%
Markit LCDX (Loan CDS) -0.09%
Markit MCDX (Municipal CDS) -0.14%
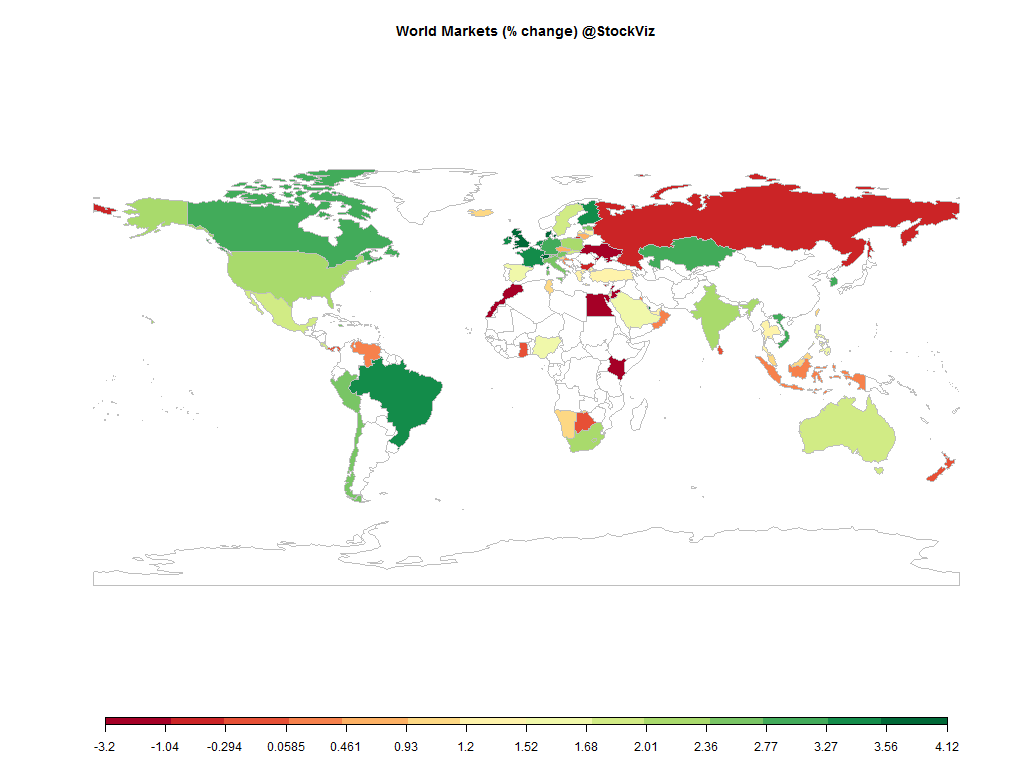
It was a good week for the equity markets. Ruble strength came as a surprise and credit gauges were bullish.

Nifty Heatmap

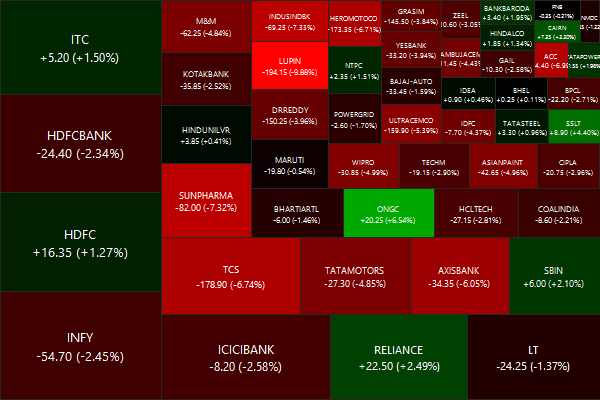
CNX NIFTY.2015-04-1.2015-04-10

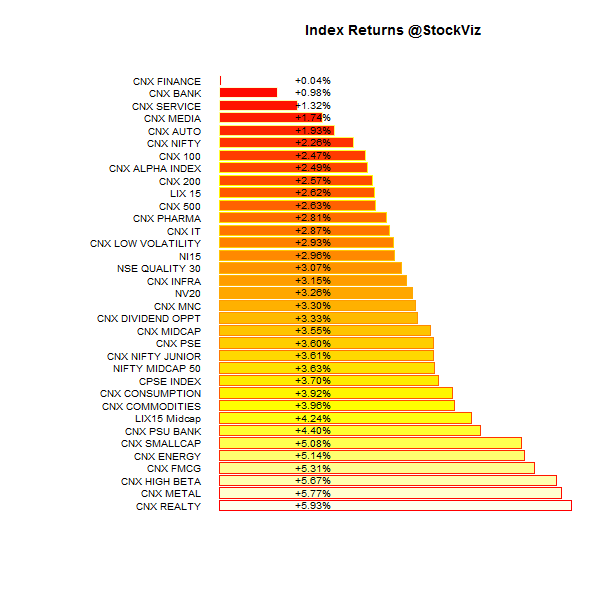
Index Returns

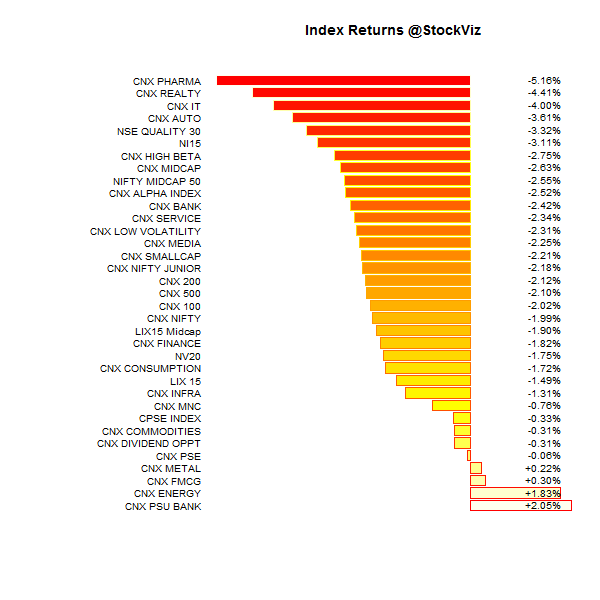
index performance.2015-04-1.2015-04-10

Sector Performance

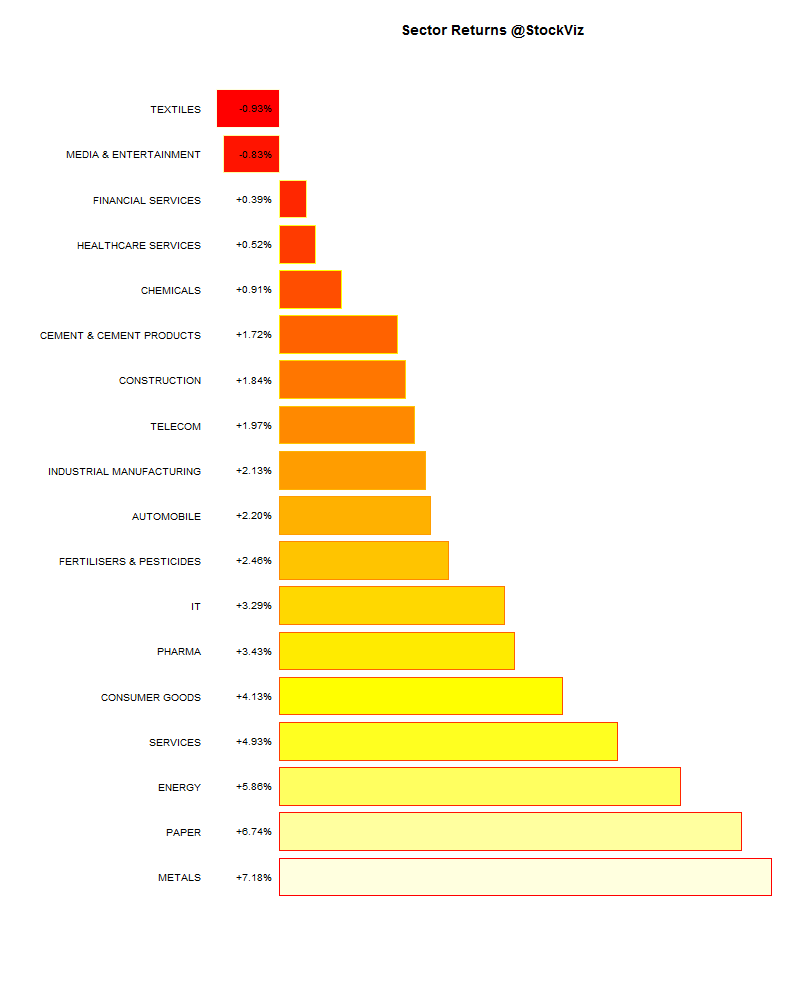
sector performance.2015-04-1.2015-04-10

Advance Decline

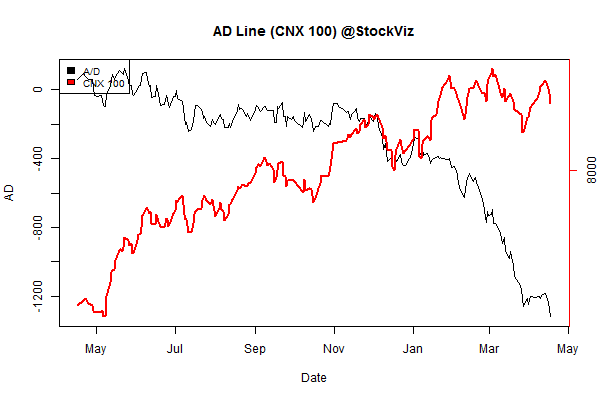
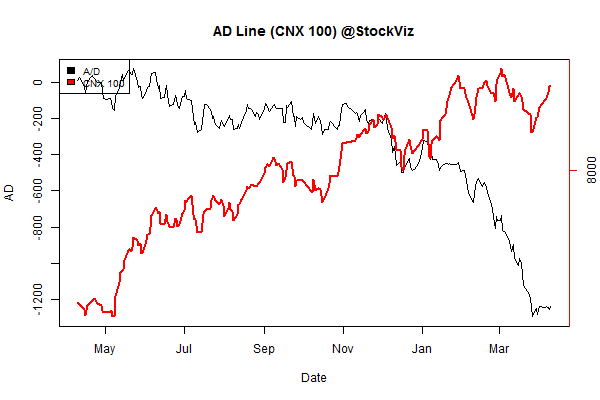
advance.decline.line2.2015-04-1.2015-04-10

Market Cap Decile Performance

Decile Mkt. Cap. Adv/Decl
1 (micro) +10.90% 78/53
2 +11.87% 85/46
3 +12.22% 86/45
4 +11.65% 83/47
5 +9.90% 86/45
6 +8.36% 79/52
7 +8.67% 78/52
8 +5.18% 73/58
9 +4.27% 70/61
10 (mega) +3.25% 71/60
A broad-based rally saw mid- and small-caps out-perform the large-caps.

Top Winners and Losers

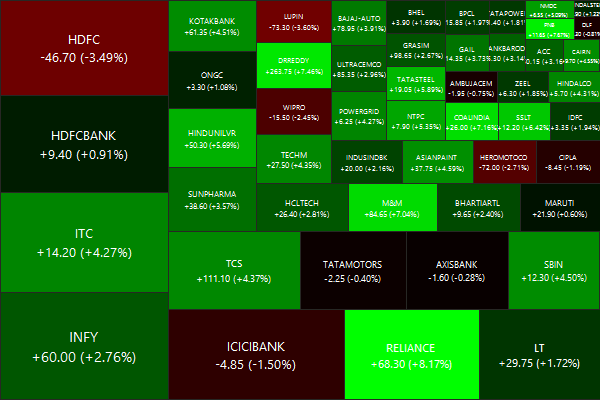
GODREJCP +10.90%
UBL +14.68%
RCOM +18.53%
LUPIN -3.60%
HDFC -3.49%
FEDERALBNK -3.38%
Rally in RCOM seems a bit premature…

ETF Performance

JUNIORBEES +4.48%
CPSEETF +3.62%
PSUBNKBEES +3.57%
NIFTYBEES +2.22%
BANKBEES +1.07%
INFRABEES +1.07%
GOLDBEES +0.83%
Green across the board, but gold under-performed equities…

Gold vs. Midcaps

You can send this to your mother-in-law. (http://svz.bz/1CCWifr)

Yield Curve

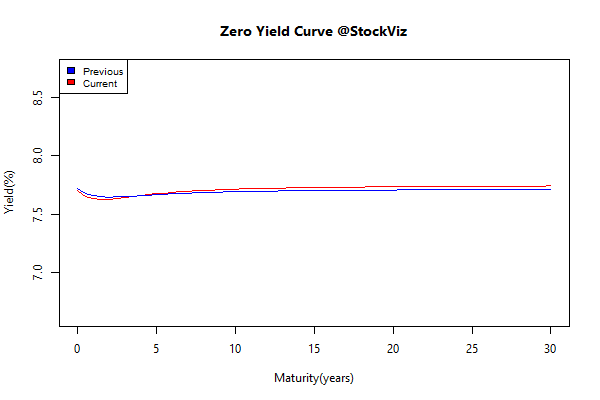
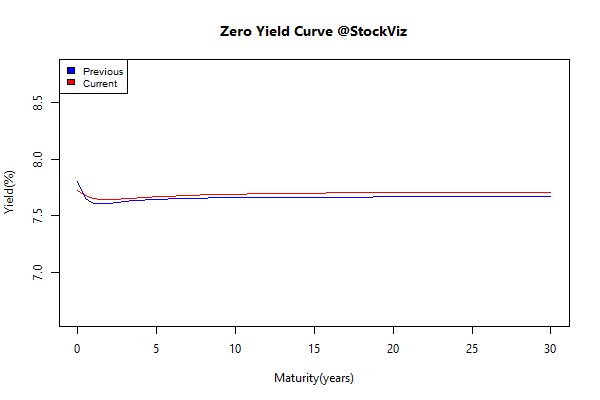
yield Curve.2015-03-31.2015-04-10

Bond Indices

Sub Index Change in YTM Total Return(%)
GSEC TB +0.01 +0.21%
GSEC SUB 1-3 +0.14 +0.19%
GSEC SUB 3-8 +0.09 -0.00%
GSEC SUB 8 +0.11 -0.48%
Rates went up a smidgen. One would think that with the Moody’s change in outlook to “Positive”, we would have seen a rally in bonds…

Investment Theme Performance

Equity Mutual Funds

Bond Mutual Funds

Thought for the weekend

The market adjusts by the price mechanism. If the cost of something goes up, the price goes up to match. If demand falls, the price drops until the market clears. But prices themselves can’t adjust in response to events. This phenomenon is called “sticky prices.”

When prices are even a little sticky, bursts of technological progress actually hurt the economy for a short while, by causing a burst of deflation, before eventually boosting growth.

Source: How sticky prices might be the cause of recessions

Index Update 11.04.2015

MOMENTUM

We run our proprietary momentum scoring algorithm on indices just like we do on stocks. You can use the momentum scores of sub-indices to get a sense for which sectors have the wind on their backs and those that are facing headwinds.

Traders can pick their longs in sectors with high short-term momentum and their shorts in sectors with low momentum. Investors can use the longer lookback scores to position themselves using our re-factored index Themes.

You can see how the momentum algorithm has performed on individual stocks here.

Here are the best and the worst sub-indices:

index momentum best 365 2015-04-10 png

index momentum best 50 2015-04-10 png

index momentum worst 365 2015-04-10 png

index momentum worst 50 2015-04-10 png

Refactored Index Performance

50-day performance, from January 28, 2015 through April 10, 2015: