Category: Your Money

Can Beta Dispersion be used for Market-Timing?

The paper Beta Dispersion and Market-Timing (SSRN) argues that one can predict crashes by tracking the dispersion of betas of the constituents of an index. The intuition presented in the paper is that when beta dispersion is high, any shock to the high beta stocks could spill over to the low beta stocks and create a broad market correction.

Although the paper proceeds to present a back-test on the US S&P 500 index, there some questions that need to be answered before deploying this strategy:

  1. What is the performance if you remove 2000 and 2008 from the data? Perhaps most of the out-performance can be attributed to skipping these two periods purely due to chance?
  2. Are the results robust over different markets? Perhaps it is unique to the US?
  3. What happens if you change the look-back period of beta calculations? Perhaps it is being data-mined?
  4. What happens if the calculations are continuous rather than sampled at the end of the month? Perhaps its an end-of-the-month effect?

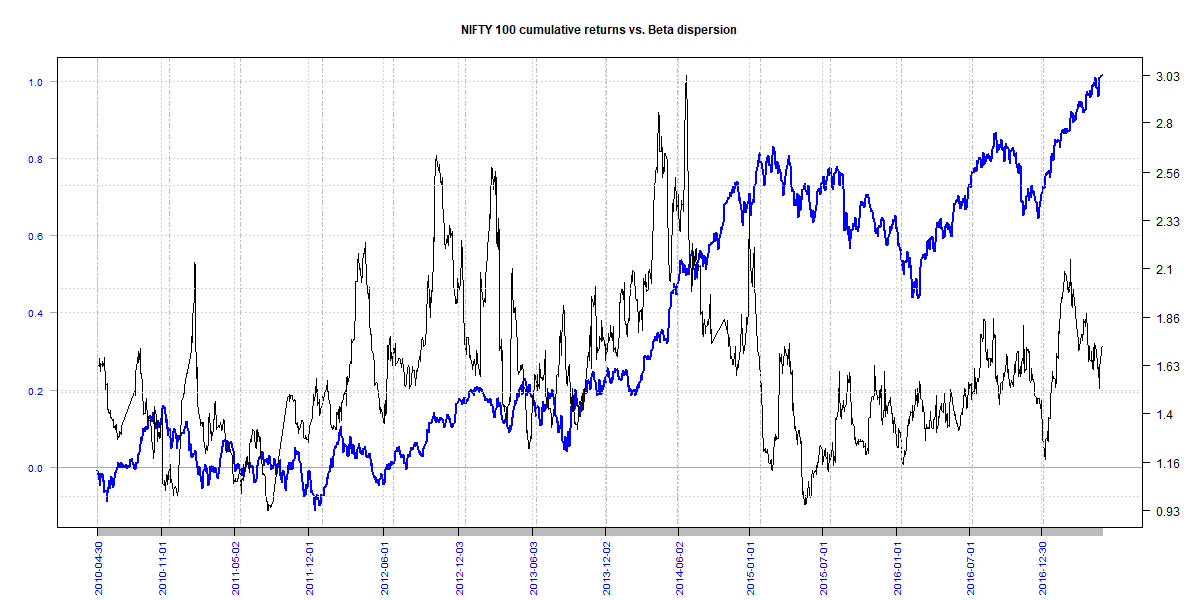
Unfortunately, we don’t have a robust data-set to put this theory to test. However, the chart of the cumulative returns of the NIFTY 100 index vs. the beta-dispersion of its components does not lead to the same conclusion made in the paper.

The code for this analysis is on github.

Mutual fund portfolio overlap and Active Share

There is a problem of plenty when it comes to mutual funds – direct growth schemes alone number into the high 200s. Investors have responded to this bewildering array of choices by going in for the ‘unlimited buffet’ option. They end up making small investments into a large number of funds. By doing so, they end up owning the whole market – paying active management fee for a passive investment. There are two things investors should keep in mind before adding a new fund to their investment:

  1. What is the new fund’s portfolio overlap with the existing investments?
  2. How different is the new fund’s portfolio from a large-cap and mid-cap index?

The first answer will tell you whether to add the new fund to your portfolio. The second will tell you if you should just replace the fund with an index ETF.

For example, say you own HDFC Mid Cap Opportunities and you are wondering if you should also buy the Birla Sun Life Midcap fund. Here’s how the fund portfolios overlap:

The funds have about 18 stocks in common and a fairly large number of stocks that are not in any of the indices. Given the differing styles, perhaps it makes sense to add the new fund to the portfolio.

The second, also called “Active Share,” shows how different the portfolio is from an index. For example, DSP Blackrock Technology.com Fund has a 26% overlap with NIFTY 100 and a 5% overlap with NIFTY MID100 FREE. Whereas, the HDFC Large cap Fund has a 95% overlap with the NIFTY 100 index. It probably makes sense to replace the latter with an index fund.

For more details about the analysis and its results, please peruse the notebook on github.

An Equity, Bond and Gold Portfolio

How did diversification across Midcap equity, bonds and gold work out for Indian investors over the last 10 years? Not too shabby, as it turns out:

Combined portfolio – Annualized: 12.16%; Max drawdown: -42.42%
Gold only portfolio – Annualized: 9.69%; Max drawdown: -21.49%
Equity only portfolio – Annualized: 12.55%; Max drawdown: -59.39%
Bond only portfolio – Annualized: 7.99%; Max drawdown: -8.52%
*Not including transaction charges/taxes.

The Setup

  • Annual rebalance.
  • Bonds start at 1%, the rest is divided between Gold (10%) and Equities.
  • The total return index for the 5-10 year tenure published by CCIL is used as a proxy for Bonds.
  • The MID100 FREE index is used as a proxy for Equities.
  • The GOLDBEES ETF is used as a proxy for Gold.
  • Period under observation: 2007-04-01 through 2017-03-31.

The idea is that you start with mostly Equity and Gold in the portfolio and rebalance at the end of every year so that at the end of 10 years, you end up with mostly Bonds.

Returns

Notice the drawdown of the equity vs. that of the portfolio. You end up with similar returns but with lower volatility.

If you remove Gold from the equation and go with only Equity and Bonds:

Combined portfolio – Annualized: 11.38%; Max drawdown: -49.90%
Equity only portfolio – Annualized: 12.55%; Max drawdown: -59.39%
Bond only portfolio – Annualized: 7.99%; Max drawdown: -8.52%

Even though a diversified, rebalanced portfolio makes sense on the surface, the tax treatment on Gold and Bonds make an annual rebalance an expensive affair.

Code and detailed results are on Github.

Can NIFTY be modeled using ARIMA?

A recent paper on SSR, Testing Random Walk Hypothesis: An Empirical Analysis of National Stock Exchange Indices (pdf), had me wondering if the NIFTY could indeed be modeled as an ARIMA(1,1,1) process as the author asserts.

As a first step, I wanted to check if ARIMA(1,1,1) is a given. What would be best fit be across rolling windows of different sizes? Turns out that for the most part, the best fit is ARIMA(0,0,0) aka, white noise. And the second best fits apply less than 20% of the time (Code and Results.)

Second, I wanted to check if ARIMA(1,1,1) has any forecasting ability. It does appear so (Code and Results.)

Buy & Hold Annualized return: 13.25% vs. Long/short NIFTY with different look-backs:
200: 16.75%; 500: 17.41% and 1000: 14.28%
*Not including transaction costs.

Although there is a slight advantage in using an ARIMA(1,1,1) model, I have a hard time reconciling the first set of results with the second. The advantage could very well be random.