Category: Your Money

Volatility Surface: RELIANCE

image

Volatility surfaces is an important trading tool for option traders. Here’s a vol chart of RELIANCE OCT25 options. Note the spike in IV around earnings announcement, the fall-off in IV above and below the ATM strike (800), the spike in vol and the dramatic drop in lambda due the “fat finger” trade on the 5th. [stockquote]RELIANCE[/stockquote]

Our option strategy model, however, is not flashing any profitable trades in this scrip right now, owing to the uncertainty around the trend of the underlying and the high IV around earnings season.

Enhanced by Zemanta

Analysis: RELIANCE

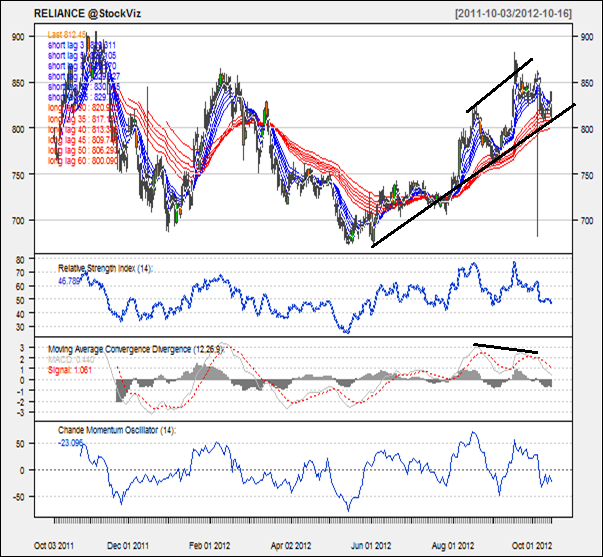
This week’s pick is [stockquote]RELIANCE[/stockquote]. Trading at around the same price as an year ago, the stock has made a meager return of 3% over the last 12 month period. The stock is in constant uptrend since May, with a few small corrections in between after it found the support at 670 levels.

Untitled

Oscillators like RSI and CMO are at currently at 47 and -23. At this level of RSI, the uptrend has no potential stops in the very near future. And looking at the previous highs of RSI, the stock can see an up-move till RSI reaches close to 75. The CMO as well is in the middle, and moving close to the -50 levels. If it gets too close to -50, it will signal a buy.

MACD line and signal line are drifting apart from each other and histogram levels are stagnant, but a higher high in the prices with lower highs in the MACD line is a divergence. This behavior can be suggesting the imminent change in the direction of the prices.

Looking at GMMA for a medium to long term outlook is not giving a lot of indication. The long term lines are moving close to each other (signaling a probable change of previous trend). The decreasing separation in the short term lines also suggests a lookout period for the near term.

image

Reliance’s average correlation of 0.73 with the Niftybees suggests that the correlation is quite strong and positive, and the movements will be of the similar magnitude as Niftybees. [stockquote]NIFTYBEES[/stockquote]

image

Reliance has volatility in the range of 0.2 to 0.6 for the most part, which is not a very big range. The volatility is currently at sky high levels of beyond 0.7, higher compared to the recent past. A constant eye is required on the scrip in case it makes a sudden move.

The up-trend is quite prominent. Looking at these technical, a short term buy is good but for the long term you might want to be cautious as the stock can check for the resistance levels at Rs. 900.

Enhanced by Zemanta

Weekly Recap

NIFTY.2012-10-08.2012-10-12

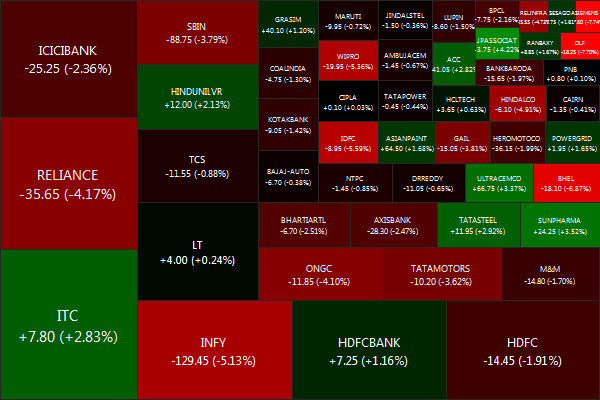
The NIFTY ended on a negative tone, drifting down -0.64% for the week.
Biggest losers were DLF (-9.57%), SIEMENS (-7.74%) and BHEL (-7.01%).
And the biggest winners were SUNPHARMA (+4.50%), JPASSOCIAT (+4.45%) and ULTRACEMCO (+3.73%).
Decliners eclipsed advancers 32 vs 18
fii.2012-10-08.2012-10-12Gold: +0.46%, Banks: -1.14%. Infrastructure: -1.50%

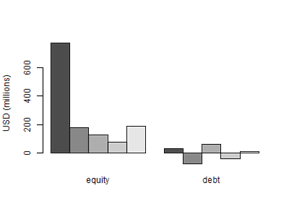
Net FII flows for the week: $1,345.00 mm (Equity) and -$20.21 mm (Debt)


Daily news summaries are here.

Analysis: ITC

This week’s pick is [stockquote]ITC[/stockquote]. Trading at 52 week high of Rs. 280, the stock has a return of close to 40% over the last 12 month period. The stock has been in a consistent uptrend for the last year, a small correction happened close to Rs. 250, but a pullback was seen from the Rs. 227 levels with affirming volumes. 

imageimage

Oscillators like RSI and CMO are at currently at the levels of 66 and 60. At this high level, there surely can be a correction in the short term. Although looking at the previous highs of RSI, the stock can see an up move till RSI reaches 80. MACD line and signal line are drifting apart from each other and histogram levels are on a rise. Not suggesting any corrections.

Looking at GMMA for a medium to long term outlook is not giving a lot of indication. The long term lines are moving away from each other (signaling a continuation of the previous trend). The increasing separation in the short term lines also suggests a positive outlook for the near term. The stock seems to be on a roll. It is a long term green flag for this stock.

image

ITC’s average correlation of 0.49 with the [stockquote]NIFTYBEES[/stockquote] suggests that the correlation is strong and positive, Although the movements will not be of the same magnitude as Niftybees.

image

ITC has volatility in the range of 0.4 to 0.6 for the most part (except for the high regions during 2010) which is not a very big range. The volatility is currently at 0.70, higher compared to the recent past. A constant eye is required on the scrip in case it makes a sudden move.

The up-trend is quite prominent. For a short term until the RSI levels start to decrease it is suggested to hold the scrip. And for the long term we do not have any standard to measure if it has any resistance at any levels. This stock can just be another example to prove the proverb “the trend is your friend” true.

Enhanced by Zemanta

Setting Trailing Stop Loss Percentages

Using a Trailing Stop Loss (TSL) is one of the best ways to limit your downside and protect your winning trades. Instead of relying on your gut, here’s a straight-forward way to derive the appropriate TSL percentage for your trades.

ATR based TSL Percentage

ATR stands for Average True Range. It provides a measure of volatility that incorporates gap/limit moves. The range of a day’s trading is simply high – low. The true range extends it to yesterday’s closing price if it was outside of today’s range.1

To set a TSL percentage, just multiply the latest daily ATR value by 2 and divide by the previous close.

What you are doing here is simply attaching a risk tolerance level (2) based on the stock’s intra-day moves averaged over a period of time.

Example

technical analysis chart

For example, if you were trading [stockquote]COLPAL[/stockquote] today, you would set the TSL to

2 * 30.5/1,250.65 = 4.88%

You can use StockViz to set a TSL alerts for your trades. Read this to see how.