Category: Your Money

Theme: Momentum Update 04.07.2016

held since returns (%)
KWALITY
2016-Jan-01
-20.99
COSMOFILMS
2016-Feb-02
+22.18
GAYAPROJ
2016-Mar-02
+6.55
HIMATSEIDE
2016-Apr-04
+17.75
GENUSPOWER
2016-Apr-04
-7.99
TRIVENI
2016-Apr-04
+28.86
TRIDENT
2016-Apr-04
-2.48
MINDAIND
2016-Jun-08
+0.43
APLAPOLLO
2016-Jun-08
+0.98
NEULANDLAB
2016-Jun-08
+8.67
RUSHIL
2016-Jun-08
+12.19
SUPPETRO
2016-Jun-08
+0.79
GHCL
2016-Jun-08
+11.24
UNIPLY
2016-Jun-08
-10.03
ITDCEM
2016-Jun-08
+9.22
IOLCP
2016-Jun-08
+14.47
MANAPPURAM
2016-Jun-08
+25.84
ORIENTPPR
2016-Jun-08
+10.38
MEGH
2016-Jun-08
+0.13
A2ZINFRA
2016-Jun-08
+55.33
Since the last rebalance on 2016-Jun-08 till 2016-Jul-01, this strategy has returned +6.53%

You can find more details about the Momentum Theme here.

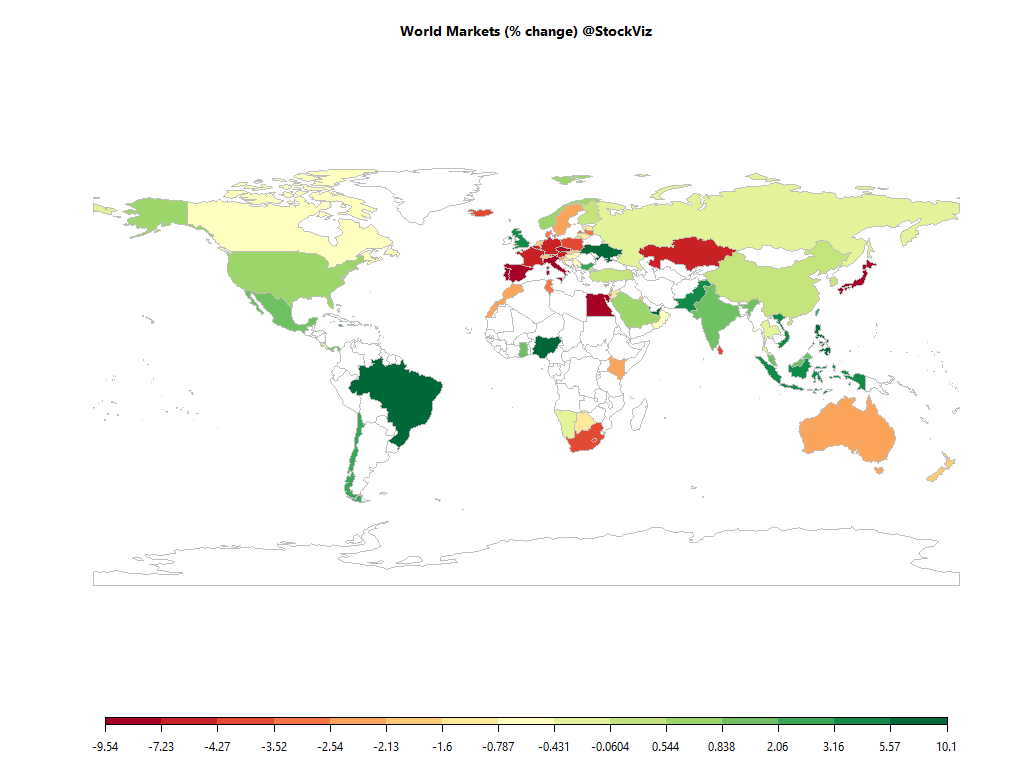
Monthly Recap: JunExit

world.2016-05-31.2016-06-30

Equities

Major
DAX(DEU) -4.74%
CAC(FRA) -5.14%
UKX(GBR) +5.57%
NKY(JPN) -9.01%
SPX(USA) +0.66%
MINTs
JCI(IDN) +3.64%
INMEX(MEX) +0.84%
NGSEINDX(NGA) +5.91%
XU030(TUR) +0.49%
BRICS
IBOV(BRA) +7.23%
SHCOMP(CHN) +0.54%
NIFTY(IND) +2.06%
INDEXCF(RUS) -0.13%
TOP40(ZAF) -4.08%

Commodities

Energy
Natural Gas +30.17%
WTI Crude Oil +0.16%
Ethanol -1.09%
RBOB Gasoline -5.50%
Heating Oil +2.04%
Brent Crude Oil +1.21%
Metals
Copper +6.22%
Platinum +8.45%
Silver 5000oz +23.75%
Gold 100oz +10.46%
Palladium +10.93%

Currencies

USDEUR:+0.00% USDJPY:-7.26%

MINTs
USDIDR(IDN) -3.91%
USDMXN(MEX) -0.63%
USDNGN(NGA) +41.74%
USDTRY(TUR) -1.71%
BRICS
USDBRL(BRA) -10.71%
USDCNY(CHN) +1.13%
USDINR(IND) +0.09%
USDRUB(RUS) -3.88%
USDZAR(ZAF) -7.32%
Agricultural
Cocoa +7.39%
Soybean Meal +2.12%
Soybeans +8.41%
Cattle -6.71%
Lean Hogs +2.70%
Lumber +1.68%
Wheat -10.73%
Coffee (Robusta) +4.29%
Corn -12.72%
Cotton -1.80%
White Sugar +17.27%
Coffee (Arabica) +19.34%
Feeder Cattle -3.30%
Orange Juice +19.45%
Sugar #11 +19.14%

Credit Indices

Index Change
Markit CDX EM +0.24%
Markit CDX NA HY -0.98%
Markit CDX NA IG +8.31%
Markit iTraxx Asia ex-Japan IG +6.85%
Markit iTraxx Australia +8.24%
Markit iTraxx Europe +22.86%
Markit iTraxx Europe Crossover +86.86%
Markit iTraxx Japan +8.40%
Markit MCDX (Municipal CDS) +5.17%
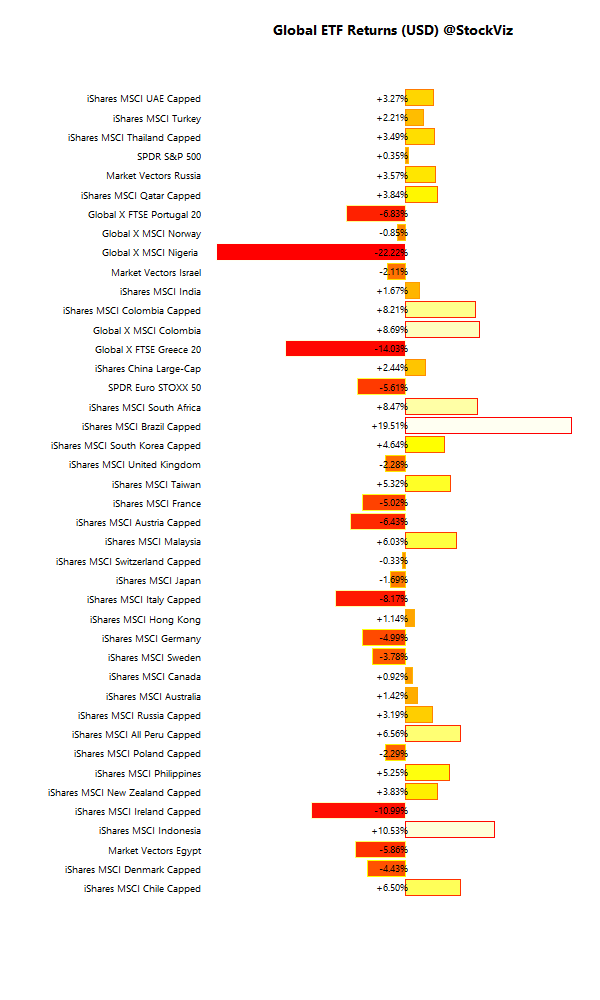
Brexit! Rexit! What, me worry?

International ETFs (USD)

global.etf.performance.2016-05-31.2016-06-30

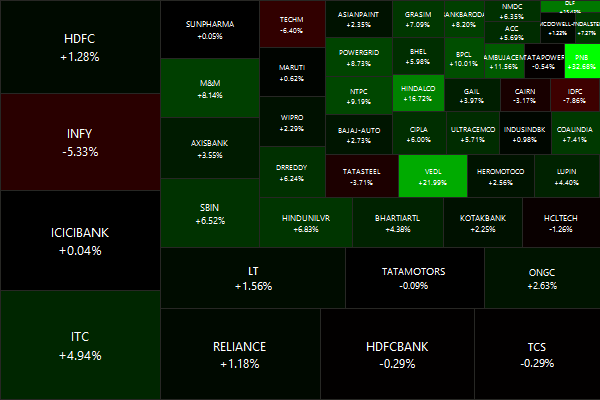
Nifty Heatmap

NIFTY 50.2016-05-31.2016-06-30

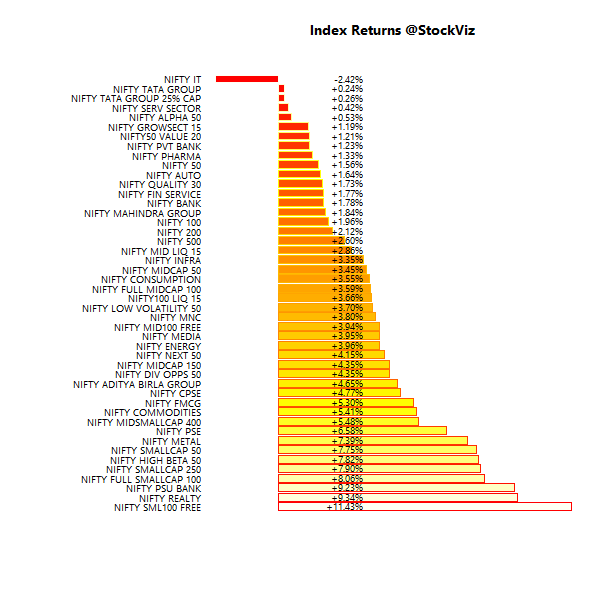
Index Returns

index.performance.2016-05-31.2016-06-30
Check out our dashboard here.

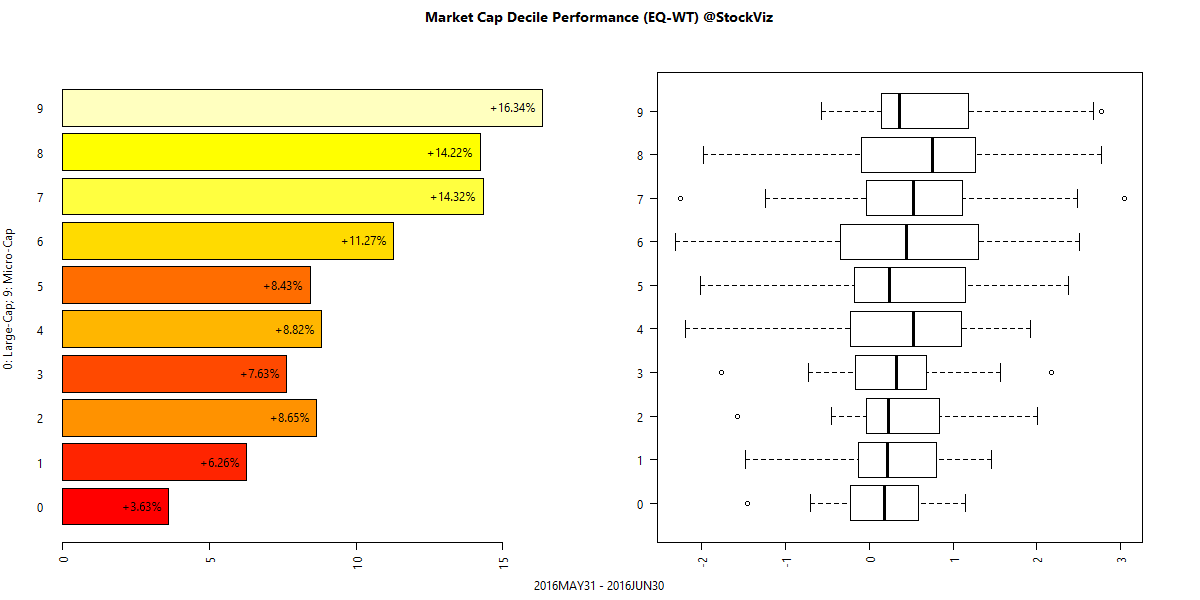
Market Cap Decile Performance

deciles.perf.2016-06-30

Top Winners and Losers

VEDL +21.56%
BAJAJFINSV +27.51%
PNB +34.05%
ASHOKLEY -9.73%
INFRATEL -7.88%
UPL -7.62%
Have commodities bottomed out? Is the government’s bank capitalization and merger plan a “game changer?”

ETF Performance

PSUBNKBEES +10.71%
GOLDBEES +4.98%
CPSEETF +4.70%
JUNIORBEES +3.98%
BANKBEES +2.69%
NIFTYBEES +1.96%
INFRABEES +1.52%
PSU banks – because tax payer money is free!

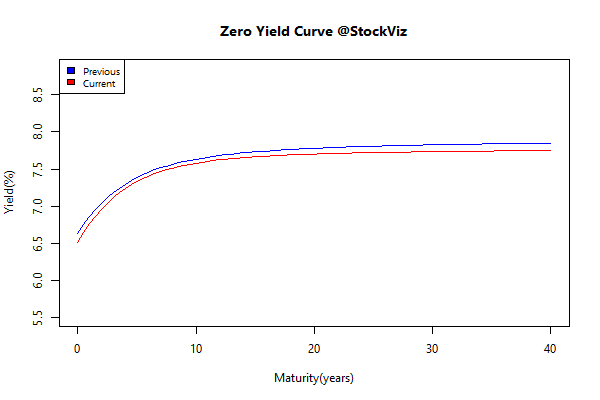
Yield Curve

yieldCurve.2016-05-31.2016-06-30

Bond Indices

Sub Index Change in YTM Total Return(%)
0 5 -0.07 +0.83%
5 10 -0.07 +0.98%
10 15 -0.01 +0.71%
15 20 -0.08 +1.37%
20 30 -0.12 +1.88%
Bonds rallied across the board. Note the shift in the yield curve.

Investment Theme Performance

Momentum strategies regained their thrones after spending months in the boondocks…

Equity Mutual Funds

Bond Mutual Funds

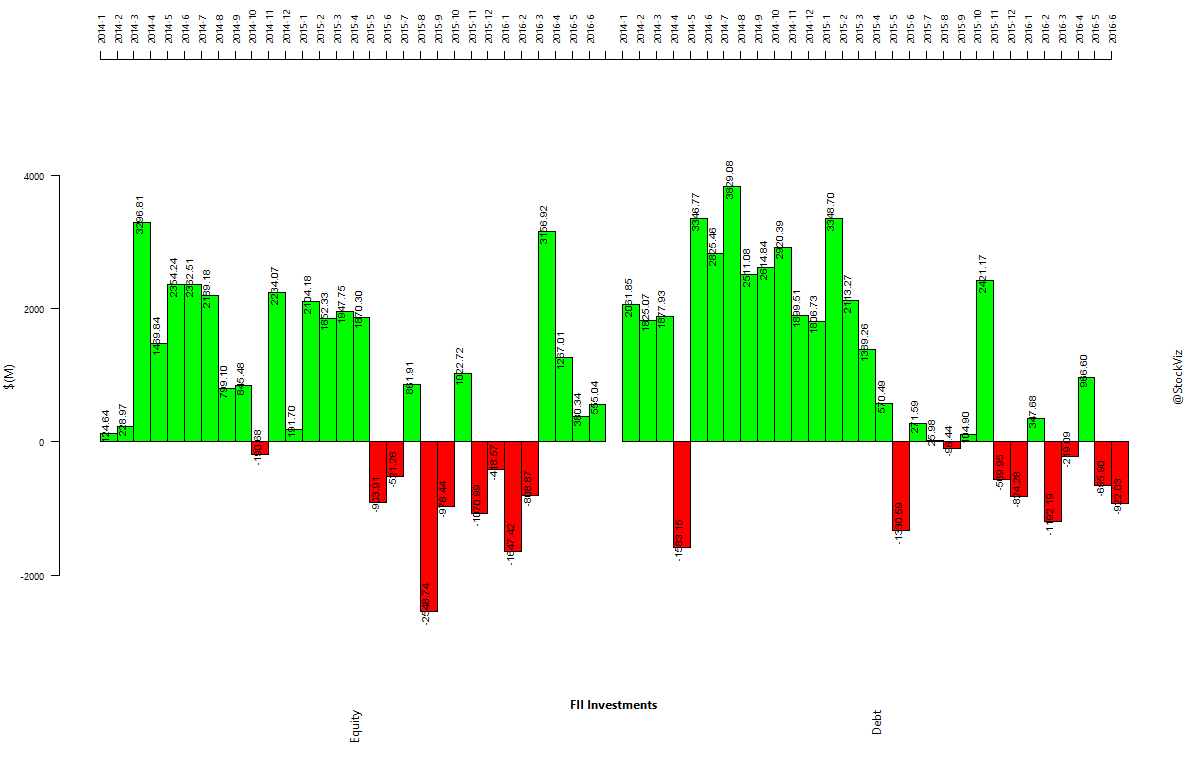
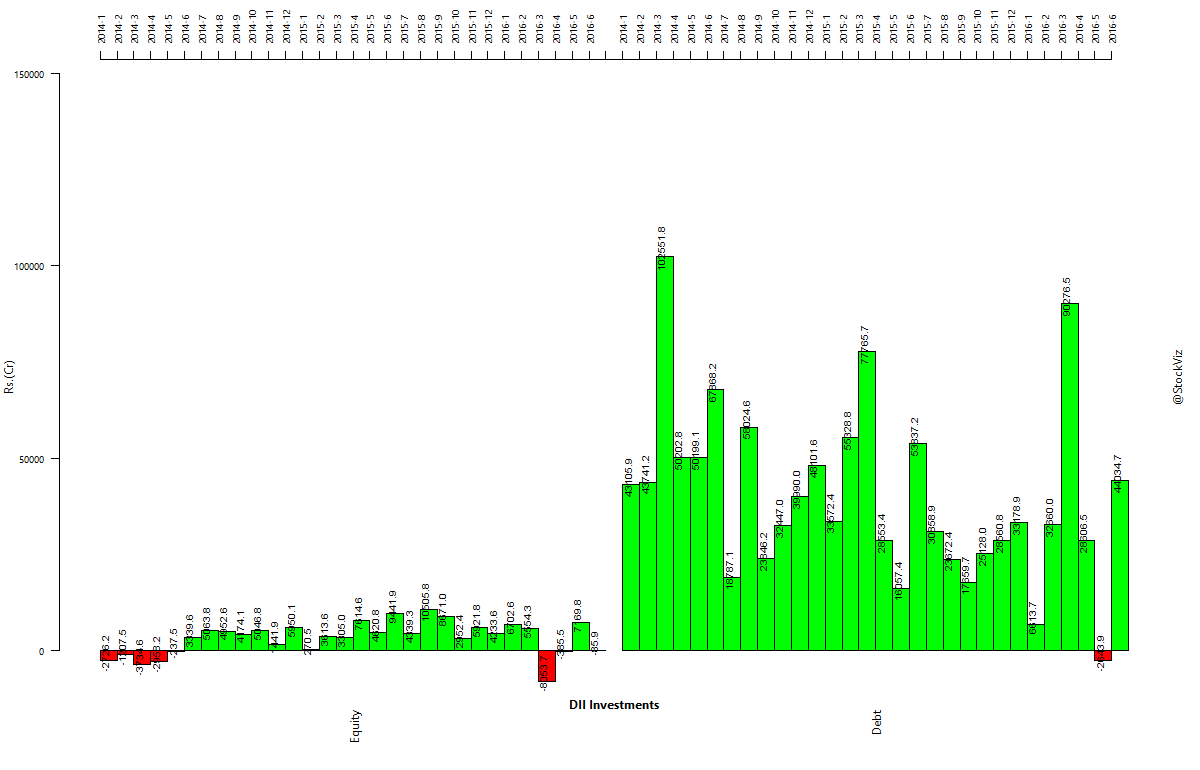
Institutional flows

FIIs sold out bonds and bought into equities. DIIs did the opposite…
fii-investments.2014-01-01.2016-06-30

dii-investments.2014-01-01.2016-06-30

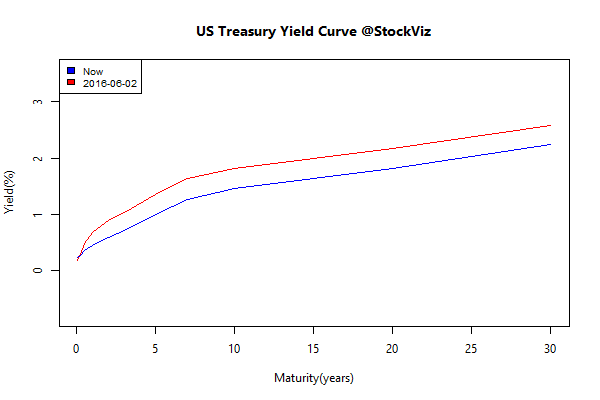
US Treasuries

ust-yield-curve.2011-01-18

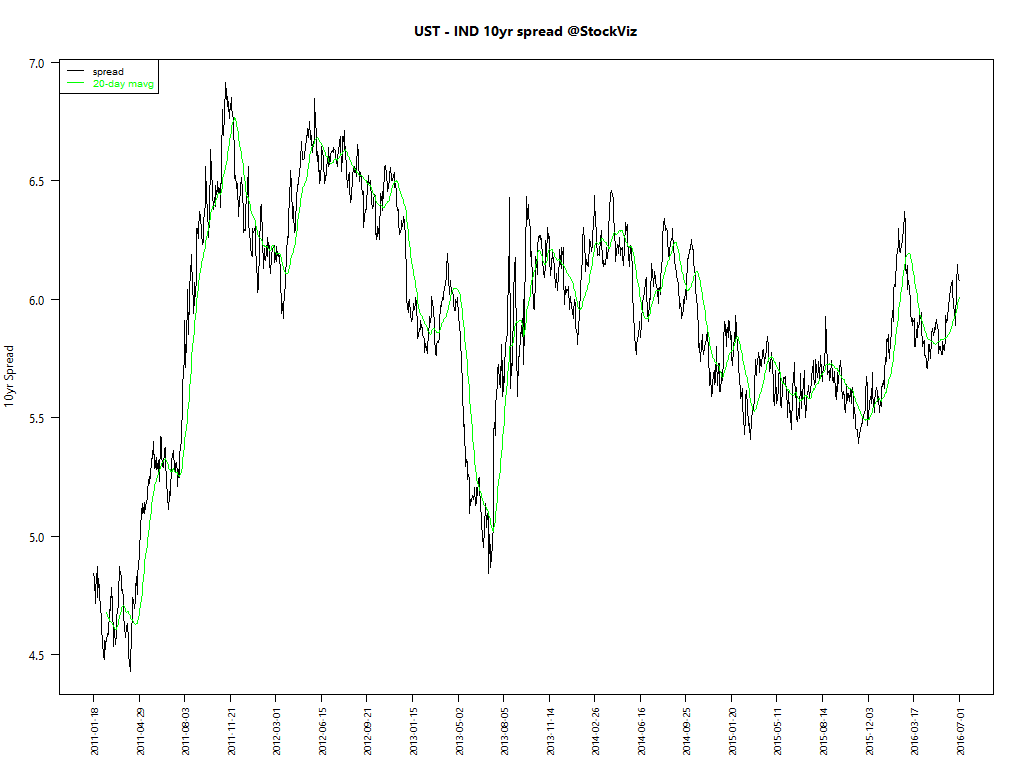
Looks like Indian bonds are no where near overbought compared to US Treasuries.
ust-ind-10yr-spread.2011-01-18

Book of the month

Black Box Thinking: Why Most People Never Learn from Their Mistakes–But Some Do (Amazon)

The only way to improve decision making is to record everything and use the telemetry to deconstruct failure. Once we know why something went wrong, we can go back to improving the decision making process. Much like how every airline crash is an opportunity to learn and improve flight safety. Investors will find a lot of takeaways from this book.

Internal Bar Strength

Definition

Internal Bar Strength (IBS) is based on the position of the day’s close in relation to the day’s range: it takes a value of 0 if the closing price is the lowest price of the day, and 1 if the closing price is the highest price of the day. The IBS effect may be related to intraday over-reactions to news or market movements, which are then “corrected” the next day.

IBS = (Close – Low)/(High – Low)

It is a mean-reversion strategy.

Back test

The paper from Alexander Soffronow Pagonidis claims that low IBS values are associated with high returns, while high IBS values are associated with low returns. Average returns when IBS is below 0.20 are .35% while average returns when IBS is above 0.80 are -0.13%.

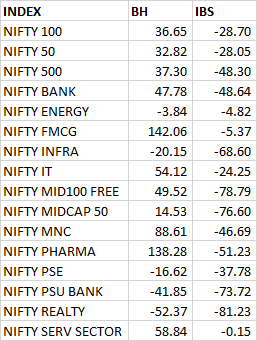
We put this to the test on 16 NSE indices. Calculating IBS and trading at the close. To keep things simple, we assumed that we can trade at closing prices. Buy at the close if IBS is below 0.2, and sell at the close if IBS exceeds 0.8, exit the position at the following market close. If a back test on indices proved promising, we figured we would try this out on individual stocks next. However, IBS returns trailed buy-and-hold by a significant margin.

ibs

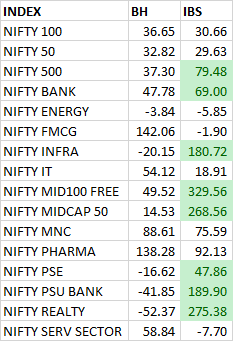
Using IBS to trade mean reversion, as the author intended, is a losing proposition. What if we do the reverse?

ibs_inverse

It “works” for about half the indices – could be pure luck.

Conclusion

It looks like IBS either doesn’t hold for Indian markets or for the indices we tested.

Source: The IBS Effect: Mean Reversion in Equity ETFs (pdf)

Equity curves: IBS Mean Reversion (pdf)

Trading turnover throughout the day

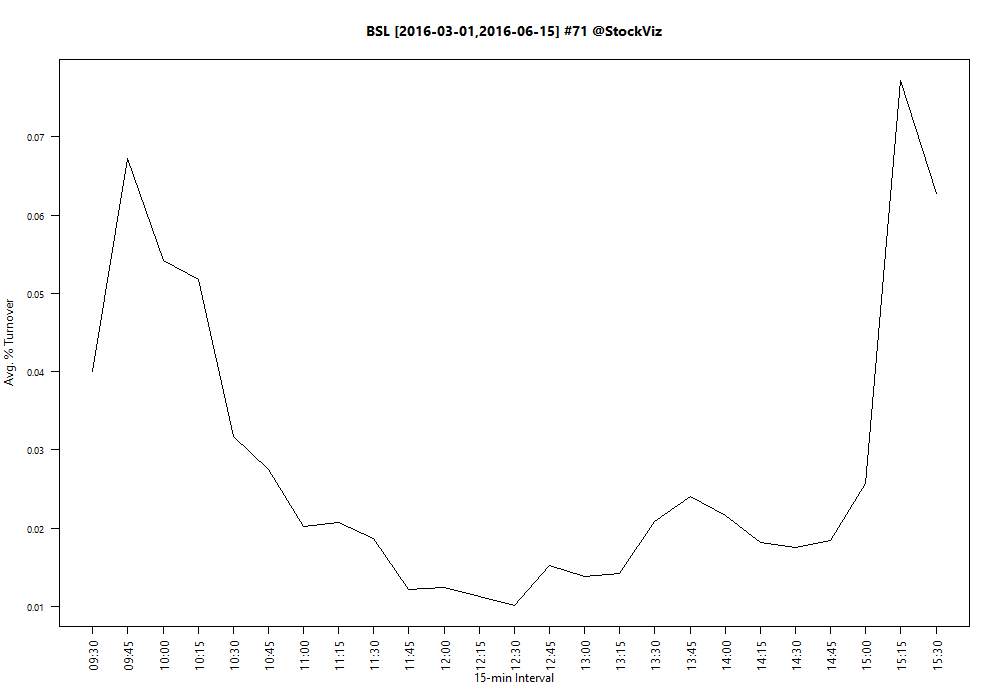
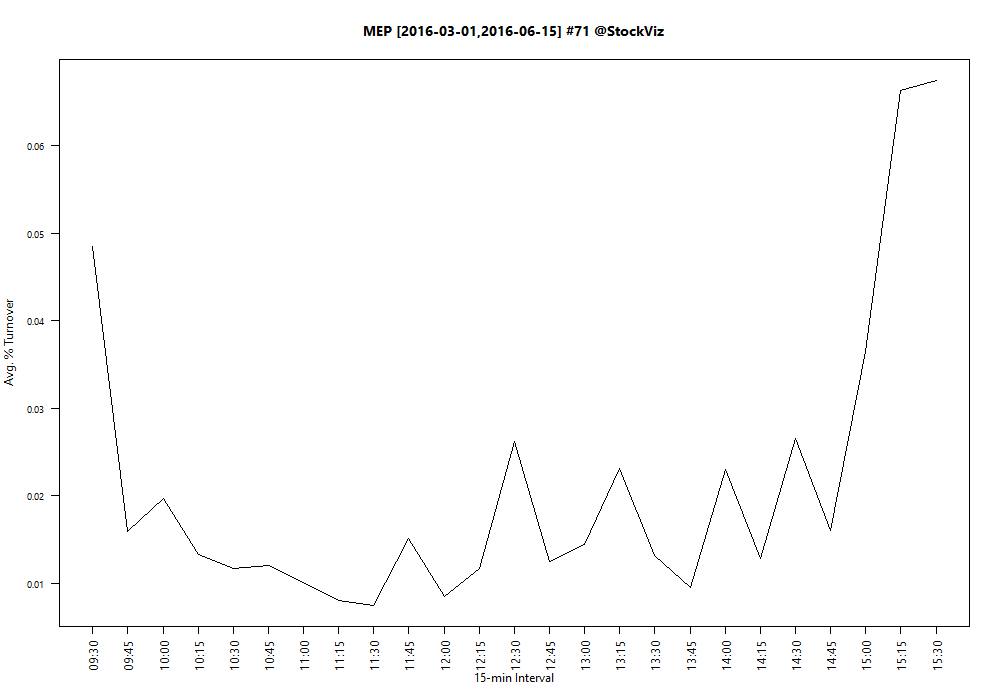
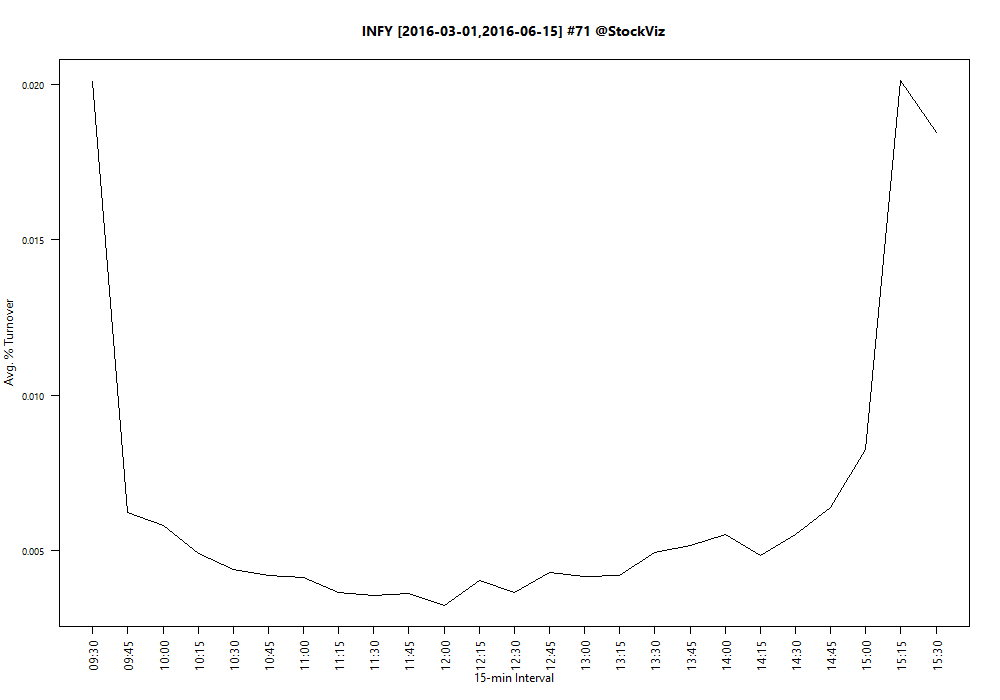
Turnover, defined as volume over total number of shares outstanding, is not constant throughout the day. If you plot turnover over a trading day, it typically traces a ‘U’ shaped plot.

turnover.BSL

turnover.MEP

turnover.INFY

Notice how turnover is the highest in the first half-hour and the last-half hour of trading? Turns out, it is a global phenomena. It follows that if you want liquidity, then it is enough if you show up for the last half-hour of trading.

Related:
Trading Day of Month Returns
Equity Returns at the Turn of the Month
Improving VWAP Strategies: A Dynamic Volume Approach

Theme: Low Volatility Update 10.06.2016

held since returns (%)
WIPRO
2014-May-02
+4.35
HDFCBANK
2015-Dec-31
+7.35
INDUSINDBK
2015-Dec-31
+14.84
CIPLA
2015-Dec-31
-23.82
PIDILITIND
2015-Dec-31
+24.74
COLPAL
2016-Feb-01
+1.53
ASIANPAINT
2016-Mar-04
+15.00
HINDUNILVR
2016-Mar-04
+3.29
POWERGRID
2016-Mar-04
+11.94
INFY
2016-Apr-05
-3.49
RELIANCE
2016-Apr-05
-5.08
HCLTECH
2016-Apr-05
-8.65
OIL
2016-Apr-05
+13.94
APOLLOHOSP
2016-May-09
+1.55
AMARAJABAT
2016-May-09
-10.57
SUNPHARMA
2016-May-09
-7.92
COALINDIA
2016-May-09
+7.70
IRB
2016-May-09
-1.94
ONGC
2016-May-09
+3.40
NTPC
2016-May-09
+5.38
Since the last rebalance on 2016-May-09 till 2016-Jun-09, this strategy has returned +2.51%

You can find more details about the Low Volatility Theme here.