TCS has been a tremendous wealth creator. Between 2004-8-25 and now, its has turned in a cumulative return of 1164% with an IRR of 28.35% during that period. So you should just “buy right and sit tight”, yeah?
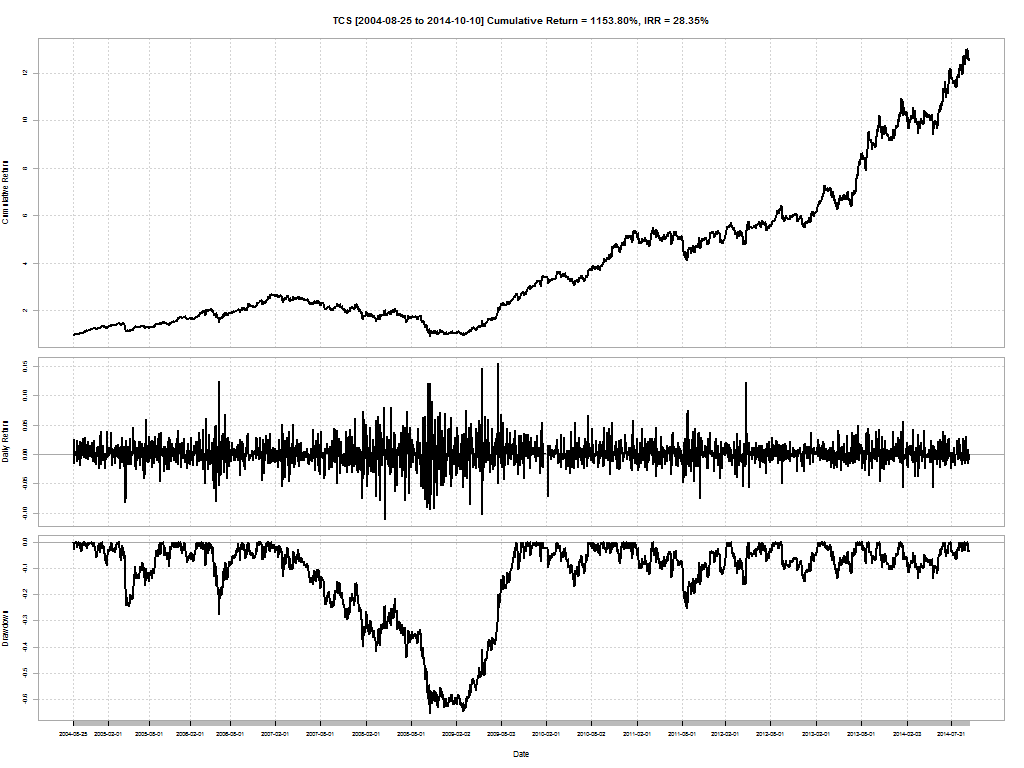
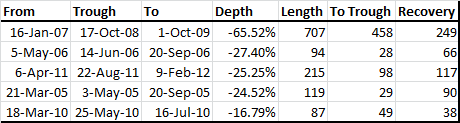
But before you hang that on your wall, let me take you back to Jan 2007. TCS started sliding on global worries and did stop until losing 65.52% of its value. It took 458 days to make a bottom and another 249 days to climb back up from it. If you think the meltdown in 2007/8 was a once-in-a-lifetime affair, then let me point out that the second worst drawdown for TCS was 27.40% back in 2006. And before that, 24% in 2005.
In my experience, 99% of the investors out there would have dumped the stock. That 28.35% IRR is wishful thinking for most investors because not only would they have dumped the stock at maximum pain (peak drawdown) but they would have failed to get back into the stock as well.
But does this mean you should never sell a stock? Have a look at Reliance Infrastructure as a counter example.
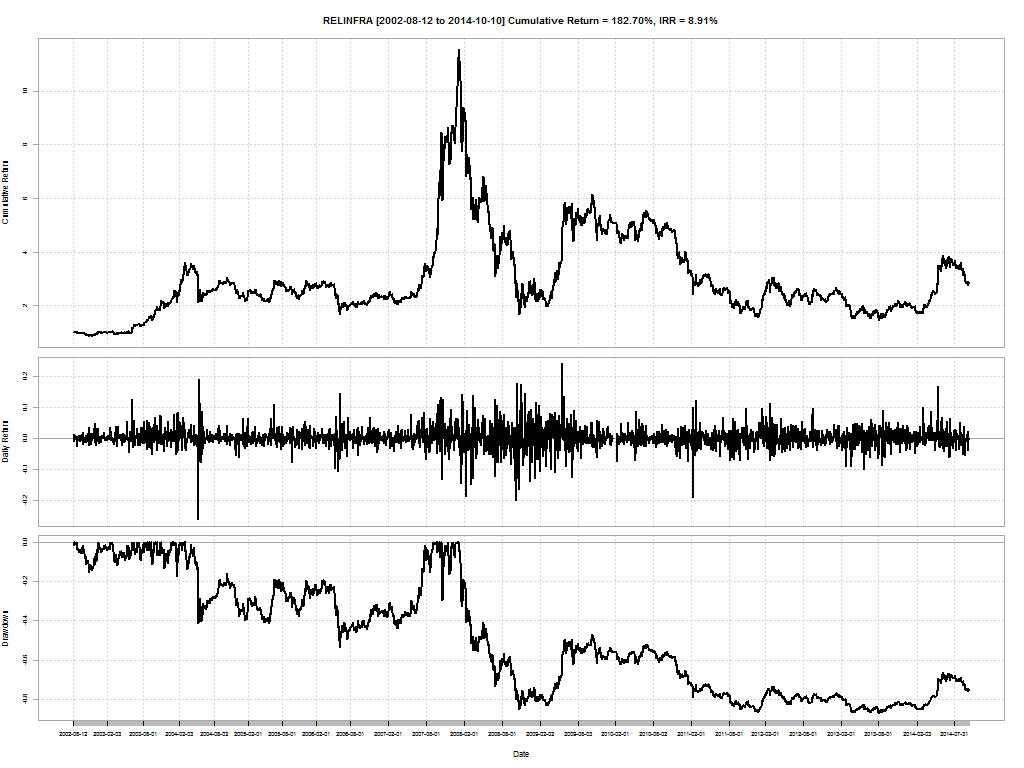
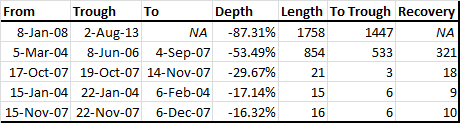
It is yet to recover from the 87% drawdown in 2008! It has been a value destroyer since early 2008.
So does this mean that you should have a “stop loss”? How should you manage whiplash? How do you keep track of all the reasons you bought a stock and if it still fits that criteria? If you sell a stock, what do you replace it with?
The key to making decisions under uncertainty is to have a process. A process that
- identifies investment opportunities based on pre-selected parameters (value, momentum, factor, beta, etc…),
- has a set holding period, based on the intricacies from (a) and current market conditions, and
- forces stocks out of the portfolio based on (a) and (b)
This where StockViz Themes come into the picture. Themes are technology wrappers around different investment strategies that make it convenient for investors to follow a process.
To know what combinations of Themes are right for your risk appetite and investment horizon, get in touch with us now!