Category: Investing Insight

Investing insight to make you a better investor.

World Markets and the NIFTY 50

global.etf.performance.2015-12-30.2016-02-08

Global markets have sold off in tandem so far this year. The question on everyone’s mind is if markets are correlated during sell-offs, then is it possible to construct a “world markets indicator” that will allow traders to short the NIFTY?

Constructing an SMA index

There are about 40 world index ETFs listed in the NYSE that provide a dollar based proxy to world equity markets. Using historical data, one can construct an index that tracks the fraction of these markets that are trading above their simple moving averages (SMAs.) If the index dips below a certain level, it could mean that a macro sell-off is in progress and one could proceed to short the Nifty. We constructed a 5- 10- and 50-day index of global market ETFs:

macro.sma

Using the SMA index to trade

So what if we used the SMA indices to go long and short the NIFTY? What we did below was to go short the NIFTY if the fraction of world markets trading below their SMAs were below their historical medians and long otherwise.

macro.trade

Between 2007 and now, the 5- and 10-day SMAs (black, red) under-perform a buy-and-hold (blue) strategy. However, the 50-day strategy (green) helped short the 2008 crisis and the current sell-off.

But let us zoom into the period between 2011 and 2014:

macro.trade2

This is where macro under-performs buy & hold (negative returns vs. positive.)

Year-wise returns of the different strategies:

Year 5-day SMA 10-day SMA 50-day SMA Buy and Hold
2007
50.58%
7.01%
12.03%
54.77%
2008
-2.51%
65.04%
69.88%
-51.79%
2009
-20.12%
-37.06%
18.47%
75.76%
2010
-4.11%
-23.86%
-19.11%
17.95%
2011
-24.00%
-16.30%
7.68%
-24.62%
2012
14.09%
16.66%
1.22%
27.70%
2013
-19.15%
6.02%
-8.94%
6.76%
2014
1.07%
-1.97%
-1.17%
31.39%
2015
13.56%
-4.39%
25.32%
-4.06%
2016
-4.77%
-4.60%
-6.13%
-7.04%

Conclusion

  • Given the volatile nature of the SMA World Indices, expect to take a fairly large hit on trading costs.
  • The 50-SMA based strategy under-performed buy and hold in 6 out of 9 years.
  • The 50-SMA based strategy under-performed buy and hold in 3 consecutive years – 2012, 2013 and 2014 – making it a hard strategy to be faithful to.

Related: India VIX vs. SPX VIX

India VIX vs. SPX VIX

The VIX index is considered a gauge of fear in the markets. A high VIX entails high option implied volatility and occurs when traders bid up options. Given the recent market turbulence where pretty much all asset classes and equity markets across the board tanked, we wanted to check if VIX indices across markets had any relationship with each other.

VIX since 2009

The India VIX index was introduced only in 2009. Let’s start by plotting it vs. the S&P 500 (SPX) Vix to see if it passes a visual sniff test.

vix.historical

We can see at least five instances where India Vix popped without a corresponding move by SPX VIX.

Distribution

The problem with trying to nail down a relationship between the two indices is that, as one would expect, India VIX is way more dispersed than its SPX counterpart. Here’s the density plot.

india vix - spx vix density plot

India vs. spx vix density plot by year.

They might share the same suffix, but they are two completely different beasts.

Cross-correlation

The plots above look at VIX levels. Maybe we should check if the changes in VIX are related. Here’s the cross-correlation plot.

india vix and spx vix cross-correlation plot

India vix and spx vix cross correlation by year.

Conclusion

We cannot really use the two Vix indices to predict each other’s moves.

Market-Cap Deciles, Part II

We had introduced the concept of dividing the universe of stocks by market-cap deciles a while ago (StockViz.) Here are some observations.

Returns

The last year has been spectacular for small- and mid-cap stocks.

From August-2014 to Now:
decile all

For 2015:
decile 2015

So far in 2016:
decile 2016-JAN
Note: Deciles go from 1 (micro-cap) to 10 (mega-cap)

In 2015:

  1. If you had blindly invested in an equal-weight portfolio of ~145 micro-cap stocks, you would have been up ~70%
  2. Every other decile out-performed the mega-caps (decile #1)
  3. Note how the standard-deviation of returns compress as you walk up the cap

Migrations

migrations 2015
Free-float market-cap is a volatile measure in itself – when you use that to classify stocks, you end up with quite a bit of movement between deciles. Something to keep in mind while using deciles for analysis.

Market breadth indicator

The mega-cap decile (decile #1) can be used as a crude market-timing indicator. If you track the number of stocks in the decile that went up vs. the number that went down, you end up with a proxy for breadth.

long-short-nifty

Even though technically it beat the buy-and-hold NIFTY 50, the indicator produces too many trades and it doesn’t offer a large enough margin of out-performance to be useful in live trading.

Next steps

We will continue to poke around and share what we find!

Definition: Drawdown

Drawdown, of an investment, is the peak-to-trough decline during a specific period.

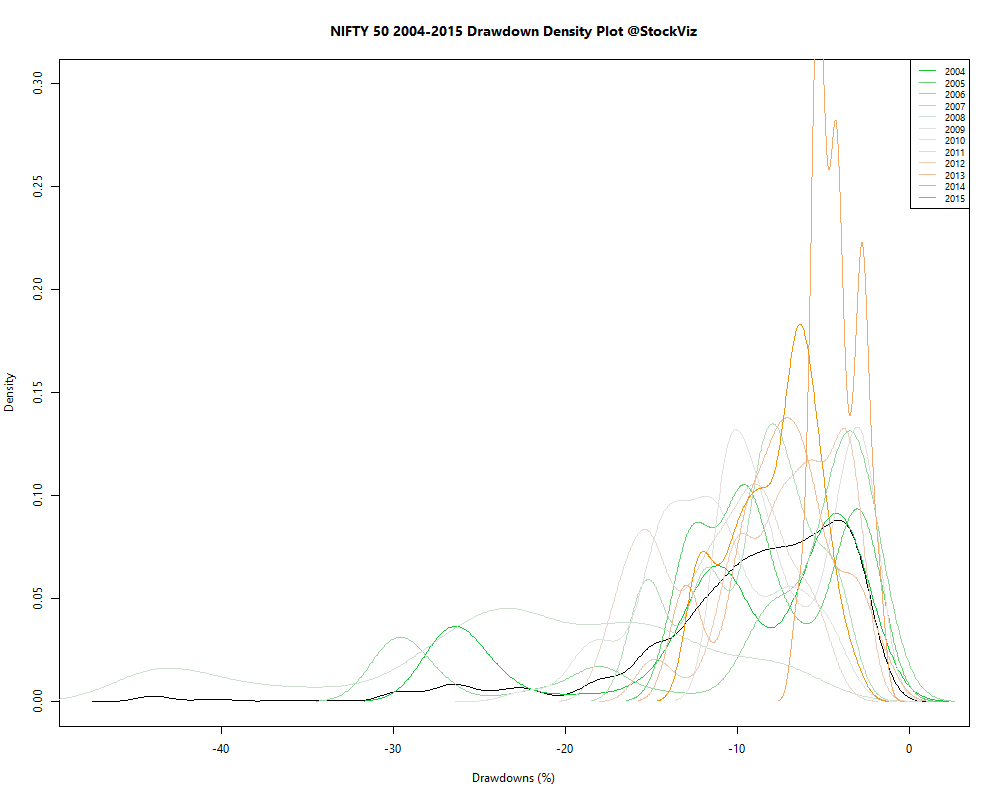
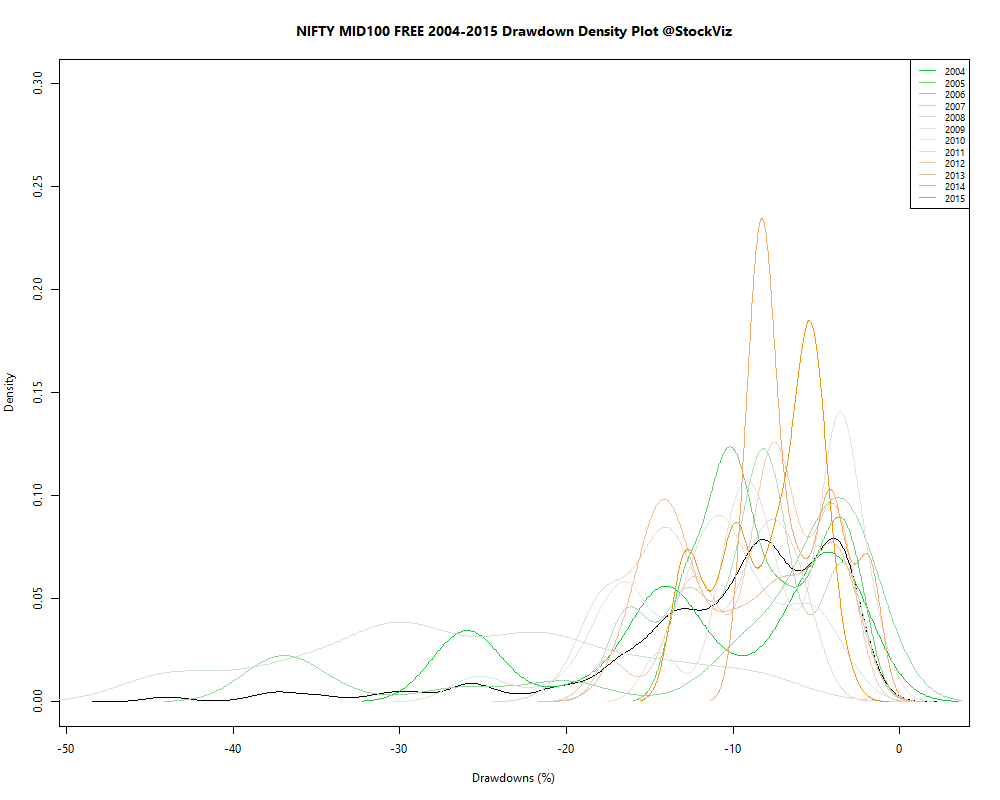
It is not uncommon for stock indices to drawdown 30% in a year. Here’s how we see it.

Nifty 50 Drawdowns

drawdowns.nifty50

Nifty Midcap 100 Drawdowns

drawdowns.midcap100

Explainer

Drawdowns take their time to form and can be identified into three distinct points:

  1. The day from which the investment started going down. ‘From’ in the above images.
  2. The day on which the investment stopped going down. ‘Trough’ in the above images.
  3. The day on which the investment recouped all its losses from (1). ‘To’ in the above images.

The number of days the whole processes took is the ‘Length’ of the drawdown. ‘Recovery’ shows the number of days it took to get back to it initial value.

Path dependency

The yearly breakup shown above doesn’t give the real picture of how the investment actually performed during the entire stretch of time. For example, here’s NIFTY 50 vs. MIDCAP 100:

Between 2004-01-01 and 2016-01-20, NIFTY 50 has returned a cumulative 282.24% with an IRR of 11.76% vs. NIFTY MIDCAP 100's cumulative return of 394.05% and an IRR of 14.16%.

Depending on where your starting point is, you end up with different drawdown and return profiles. You can fool around with that here: svz.bz

Take-away

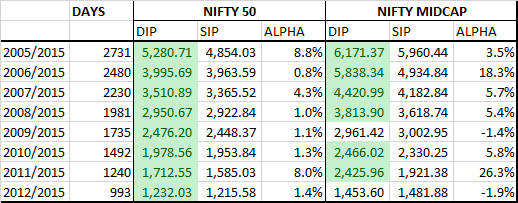
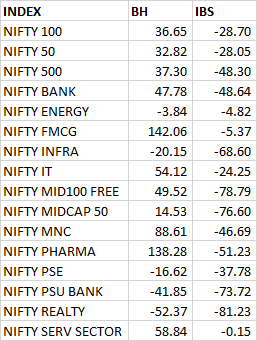
Returns go hand-in-hand with drawdowns. Seasoned investors wait for it (in bond funds) to enter, most long-term investors learn to ignore them and continue their dollar cost averaging (aka SIP.)

The Year 2015 in the Markets

world.2014-12-31.2015-12-31

Equities

Major
DAX(DEU) +9.56%
CAC(FRA) +8.53%
UKX(GBR) -4.93%
NKY(JPN) +9.07%
SPX(USA) -1.54%
MINTs
JCI(IDN) -12.13%
INMEX(MEX) -1.18%
NGSEINDX(NGA) -17.36%
XU030(TUR) -17.64%
BRICS
IBOV(BRA) -13.31%
SHCOMP(CHN) +9.41%
NIFTY(IND) -4.06%
INDEXCF(RUS) +26.12%
TOP40(ZAF) +4.16%

Commodities

Energy
Ethanol -13.17%
Brent Crude Oil -33.76%
Heating Oil -39.27%
Natural Gas -20.45%
RBOB Gasoline -11.49%
WTI Crude Oil -29.88%
Metals
Silver 5000oz -12.10%
Platinum -26.40%
Gold 100oz -10.86%
Copper -25.00%
Palladium -29.43%

Currencies

USDEUR:+11.51% USDJPY:+0.59%

MINTs
USDIDR(IDN) +11.64%
USDMXN(MEX) +17.00%
USDNGN(NGA) +8.49%
USDTRY(TUR) +24.88%
BRICS
USDBRL(BRA) +49.03%
USDCNY(CHN) +4.64%
USDINR(IND) +4.93%
USDRUB(RUS) +24.64%
USDZAR(ZAF) +34.63%
Agricultural
Lean Hogs -26.84%
Sugar #11 +4.32%
Cattle -18.04%
Coffee (Arabica) -25.53%
Cotton +4.21%
Lumber -21.95%
White Sugar +7.86%
Cocoa +14.74%
Corn -10.56%
Feeder Cattle -23.82%
Orange Juice -0.04%
Soybeans -14.65%
Wheat -20.25%
Coffee (Robusta) -21.25%
Soybean Meal -27.19%

Nifty Heatmap

NIFTY 50.2014-12-31.2015-12-31

Index Returns

index.performance.2014-12-31.2015-12-31

Market Cap Decile Performance

Decile Mkt. Cap. Adv/Decl
1 (micro) +83.07% 95/39
2 +64.59% 104/29
3 +40.56% 91/42
4 +31.75% 80/53
5 +28.26% 82/51
6 +27.95% 85/48
7 +14.75% 76/57
8 +19.85% 75/58
9 +5.53% 68/65
10 (mega) +0.91% 68/66
It was the year of the small-caps – vastly out-performing the NIFTY 50.

Top Winners and Losers

HINDPETRO +52.74%
IBULHSGFIN +60.20%
BRITANNIA +61.20%
BANKINDIA -61.91%
VEDL -57.86%
CANBK -48.08%
Commodities and public sector bank stocks got pummeled…

ETF Performance

JUNIORBEES +7.87%
NIFTYBEES -4.26%
GOLDBEES -7.50%
INFRABEES -9.11%
BANKBEES -10.32%
CPSEETF -14.07%
PSUBNKBEES -31.65%
Broad-based indices had very little to offer…

Yield Curve

yieldCurve.2014-12-31.2015-12-31

Bond Indices

Sub Index Change in YTM Total Return(%)
0 5 -0.50 +9.21%
5 10 -0.14 +8.78%
10 15 +0.01 +7.83%
15 20 +0.09 +7.02%
20 30 +0.13 +6.10%
On a total return basis, the long-bonds barely kept up with inflation.

Spread between US Treasuries and Indian Gilts

ust-ind-10yr-spread.2011-01-18

Investment Theme Performance

Most investment strategies came out ahead…

Equity Mutual Funds

Bond Mutual Funds

Institutional fund flows

dii-investments.2014-01-01.2015-12-31

fii-investments.2014-01-01.2015-12-31

Commentary

It was a year that saw record inflows of retail money into mutual funds and record outflow of foreign investors out of Indian markets. There were taper tantrums, Greece, GST #fail and so many worries. But the systematic and patient investor was rewarded for keeping a cool head.