We had discussed how MNCs listed in India have outperformed pretty much every benchmark (here, here.) However, there are are a few dark-spots in an otherwise solid long-term investment thesis that are worth discussing.
The benchmark
The NIFTY MNC benchmark index had two drawbacks:
- It is based on free-float market cap and the float keeps shrinking because of buy-backs.
- It does not include dividends which are a huge component of returns in this asset class.
For example, Unilever bought back more than $5 billion of HUL’s float [stockquote]HINDUNILVR[/stockquote] in 2013; OFSS [stockquote]OFSS[/stockquote] payed out Rs. 485 per share as dividend on September 2014. The stock was trading around Rs. 3960 at that time – a yield of ~12.25% that is not captured by the index.
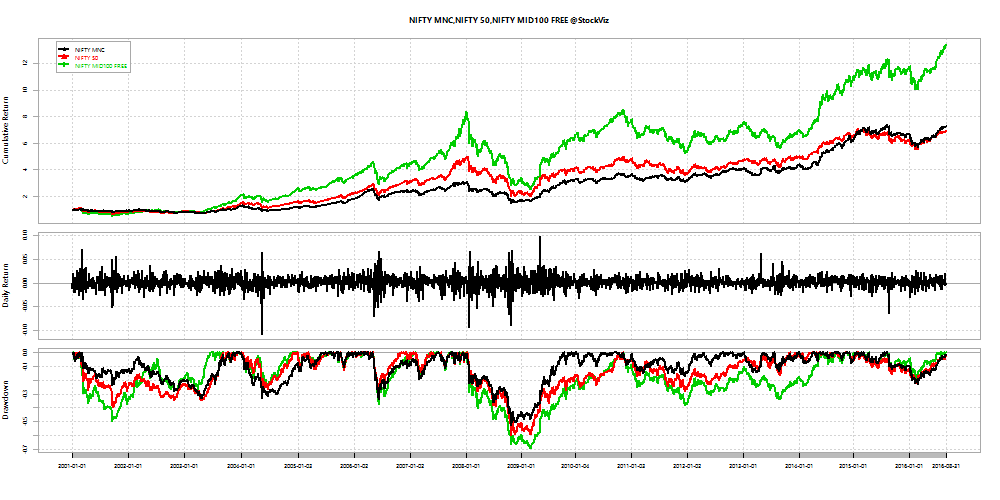
If you compare just the NIFTY MNC index to other NIFTY indices, it doesn’t look so good:
Annual returns:
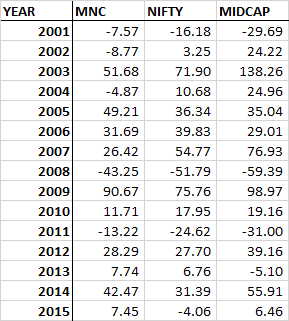
As you can see, all though the MIDCAP index is volatile, it offers returns an order of magnitude greater than the MNC index.
However, this is the index that we are talking about.
MNC Funds vs. Midcap Funds
For a true apples-to-apples comparison between MNCs and Midcaps, we should look at the funds that reference them. This takes care of the dividend reinvestment and vanishing float problems of MNCs. But creates another problem of having to adjust for alpha, but we will ignore that for now.
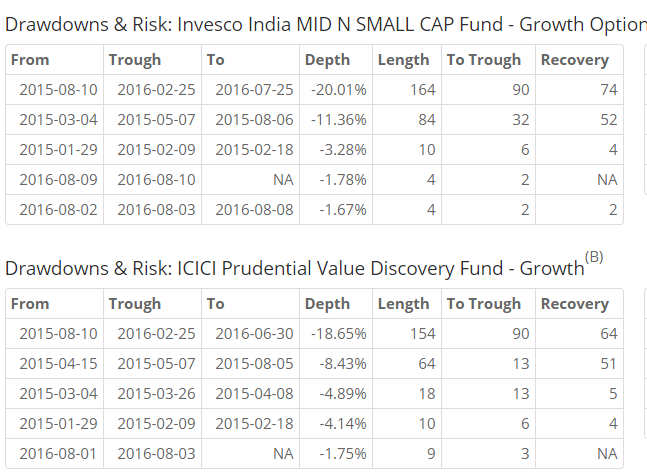
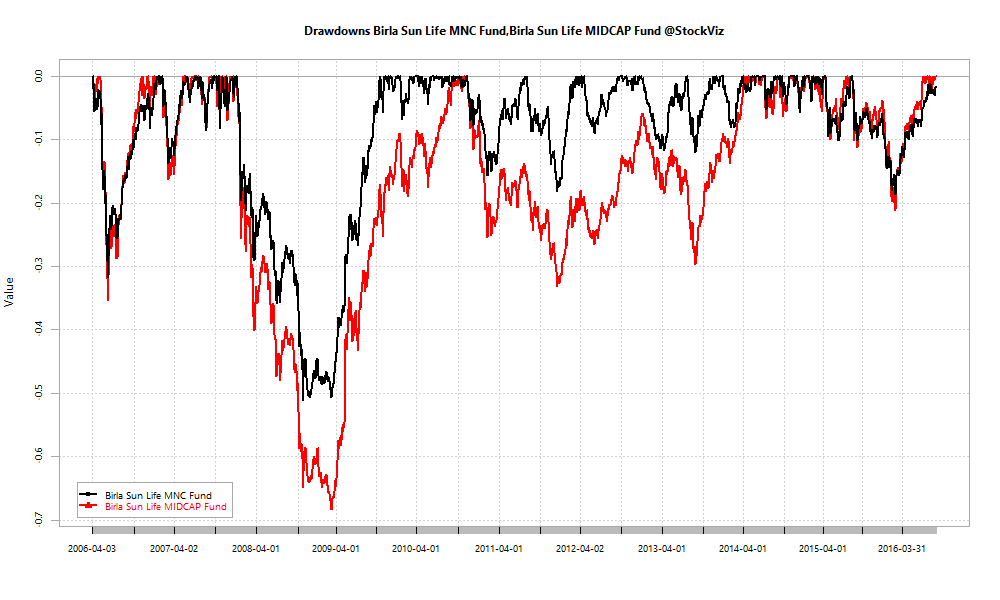
Let’s compare the BSL MNC fund vs. BSL Midcap Fund:
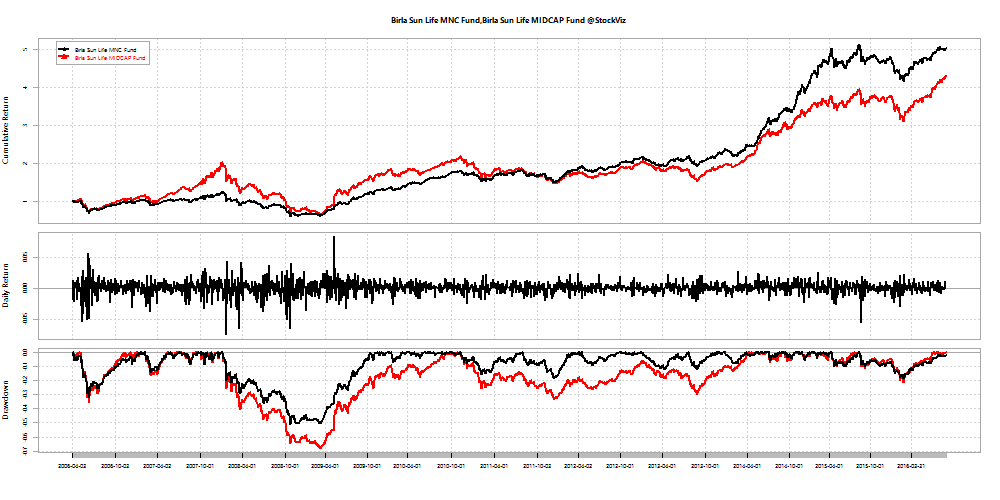
On a cumulative basis, the MNC fund as beaten their Midcap fund… with shallower drawdowns to boot:
Given the past performance of the MNC asset class, we had recommended BSL’s and UTI’s MNC funds to investors. However, we had not considered a googly being bowled by the parent companies.
Key Risk
The biggest risk with MNCs is not quantitative but qualitative. Their parent companies do not want the hassle of going through listed India subsidiaries. It is easier to invest in new projects and expatriate profits if they did so through a wholly owned subsidiary rather than a listed one. Key examples:
- Suzuki directly set up a factory in Gujarat and Maruti will “buy” cars from the new plant (IiAS.) [stockquote]MARUTI[/stockquote]
- Cummins “rationalized” their manufacturing facilities (IiAS.) [stockquote]CUMMINSIND[/stockquote]
- In FY15, 32 MNCs paid out an aggregate Rs. 63 bn, which was almost 21% of their pre-royalty pre-tax profits (IiAS.)
It looks like minority shareholders are getting shafted by the parent. The listed companies are being ‘hollowed out’ and turned into mere marketing outfits that command a significantly lower valuation in the markets.
If you are an investor in MNCs as a distinct asset class, it is time to work these risks into your future return expectations.
The R source code for this analysis and charts can be found on GitHub.