There is a famous scene in the “Wolf of Wall Street” where Matthew McConaughey (Mark Hanna) is explaining to Leonardo DiCaprio (Jordan Belfort) the concept of fugazi:
Mark Hanna: Number one rule of Wall Street. Nobody… and I don’t care if you’re Warren Buffet or if you’re Jimmy Buffet. Nobody knows if a stock is gonna go up, down, sideways or in f***ing circles. Least of all, stockbrokers, right? You know what a fugazi is?”
Jordan Belfort: *Fugayzi*, it’s a fake.
Mark Hanna: *Fugayzi*, fugazi. It’s a whazy. It’s a woozie. It’s fairy dust. it doesn’t exist. It’s never landed. It is no matter. It’s not on the elemental chart. It’s not f***ing real.
IMDB
Gross returns of a high turnover portfolio is just that – fugazi.
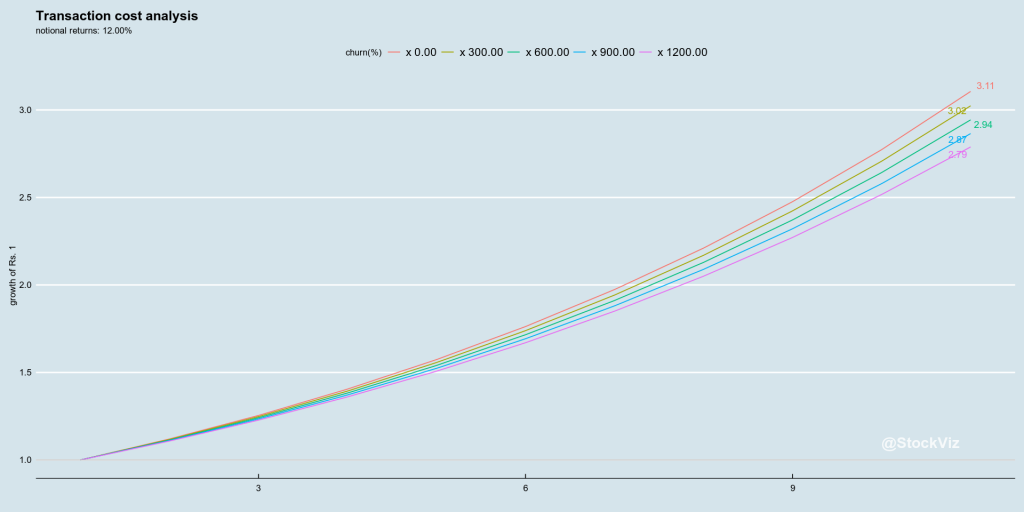
Assume that there is an investment strategy that produces 12% in gross returns every year. Notionally, $1 should grow to $3.11 in 10 years. However, even if you assume brokerage charges are zero, demat charges don’t exist and there are no other taxes whatsoever, STT – Securities Transaction Tax – will take a slice of the portfolio at every churn.
A x600 churn, where 25% of the portfolio is replaced every month, will leave you only $2.94 in 10 years. A x1200 churn, where 50% of the portfolio is replaced every month – not uncommon with most momentum strategies – will leave you with only $2.79.
And STT is not the only tax that is paid on a direct-equity portfolio. Capital gains tax of 10-15% also apply. These taxes have a non-linear impact on a portfolio’s compounded returns.
Investors should keep these in mind while comparing direct-equity portfolio returns.
Also, mutual fund NAVs are net returns. It is highly inappropriate to compare gross direct-equity returns with mutual fund NAVs.
Code for this analysis can be found on github. You can play around with it on pluto.