Author: stockviz

Theme: Enterprise Yield Update 01.02.2016

held since returns (%)
BAJAJ-AUTO
2014-Aug-24
+3.56
CONCOR
2015-Jan-20
-14.03
DRREDDY
2014-Aug-24
+9.42
GRASIM
2013-Sep-15
+34.93
HEROMOTOCO
2014-Aug-24
+0.48
INFY
2014-Aug-24
+31.13
LUPIN
2015-Jan-20
+18.52
M&M
2015-Jan-24
-9.52
OFSS
2014-Aug-24
+3.38
PETRONET
2014-Aug-24
+39.47
Since the last rebalance on 2015-Jan-27 till 2016-Jan-29, this strategy has returned +0.89%.
It invested in NIFTY 100 stocks with high Enterprise Yield values. Going forward, it will invest in NIFTY 500 stocks with the same criteria.

You can find more details about the Enterprise Yield Theme here.

Index Update 30.01.2016

MOMENTUM

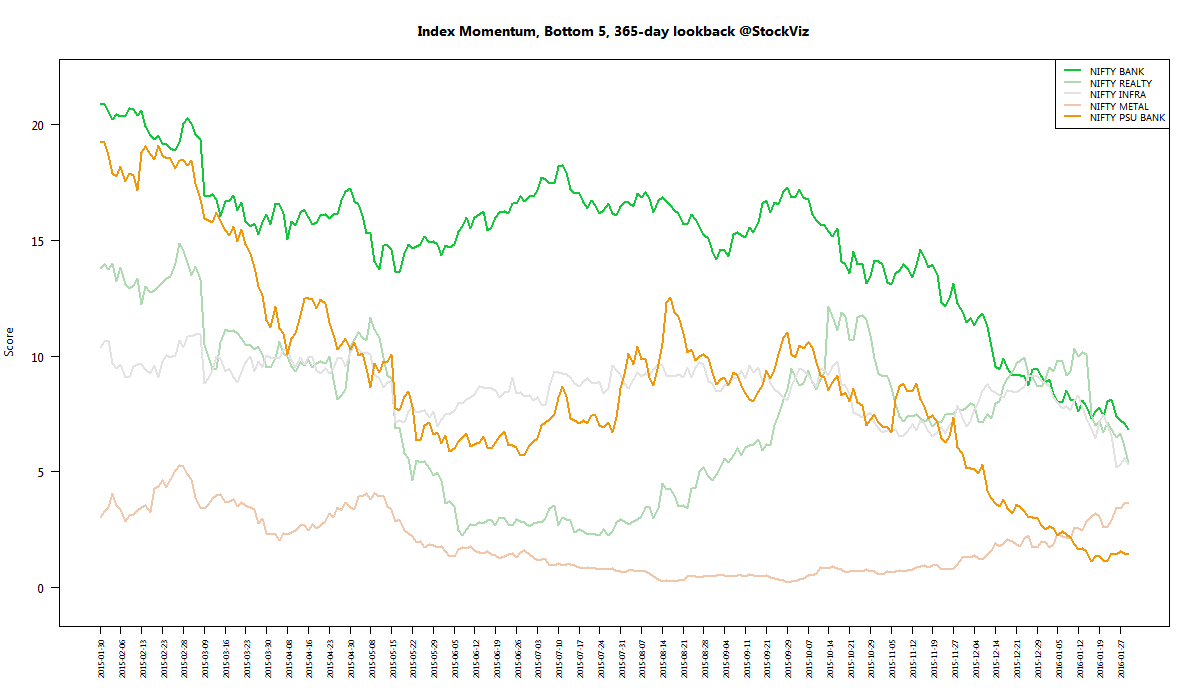
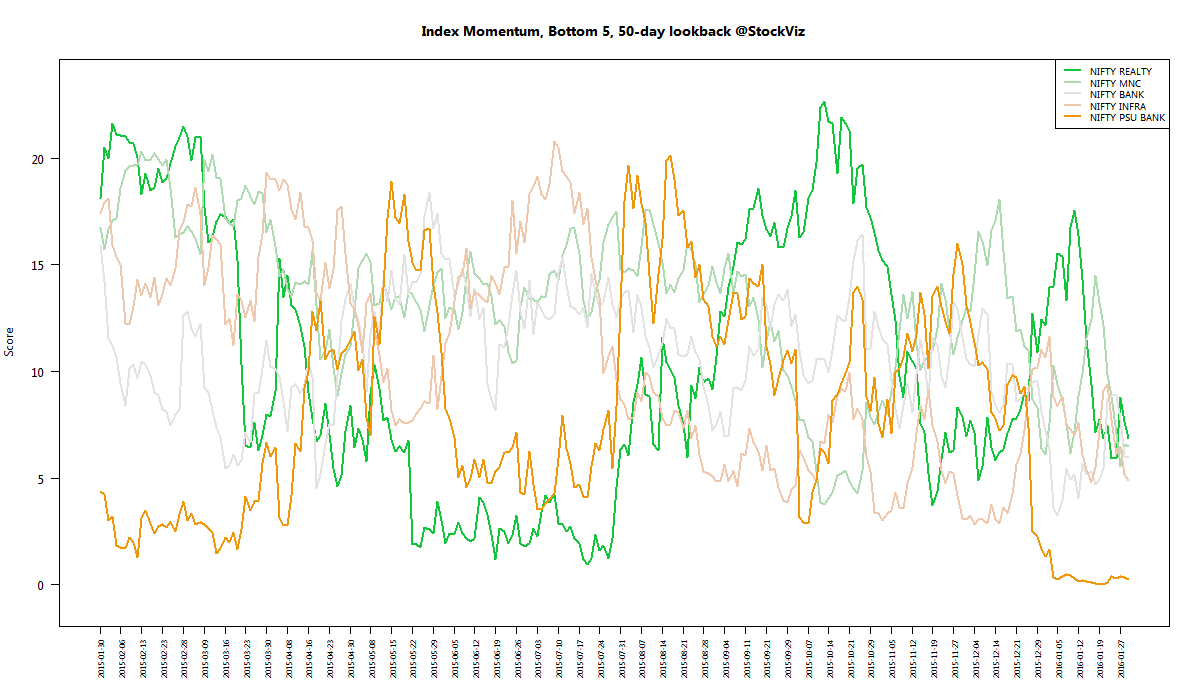
We run our proprietary momentum scoring algorithm on indices just like we do on stocks. You can use the momentum scores of sub-indices to get a sense for which sectors have the wind on their backs and those that are facing headwinds.

Traders can pick their longs in sectors with high short-term momentum and their shorts in sectors with low momentum. Investors can use the longer lookback scores to position themselves using our re-factored index Themes.

You can see how the momentum algorithm has performed on individual stocks here.

Here are the best and the worst sub-indices:
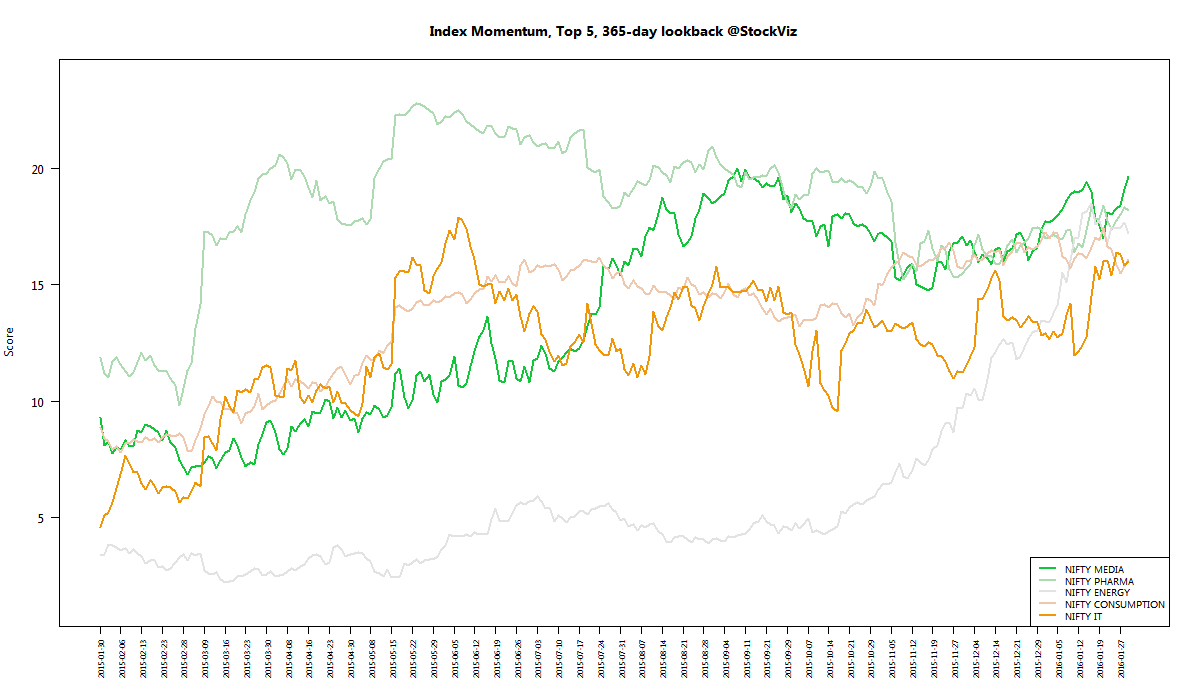
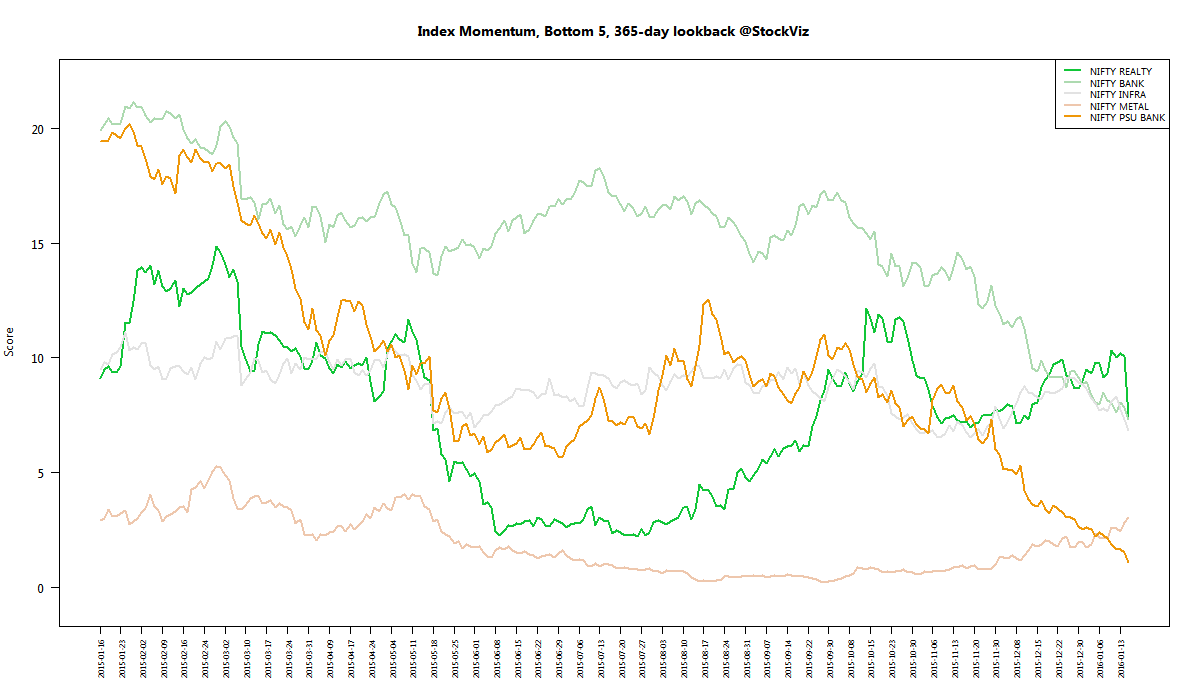
index momentum best 365 2016-01-29 png

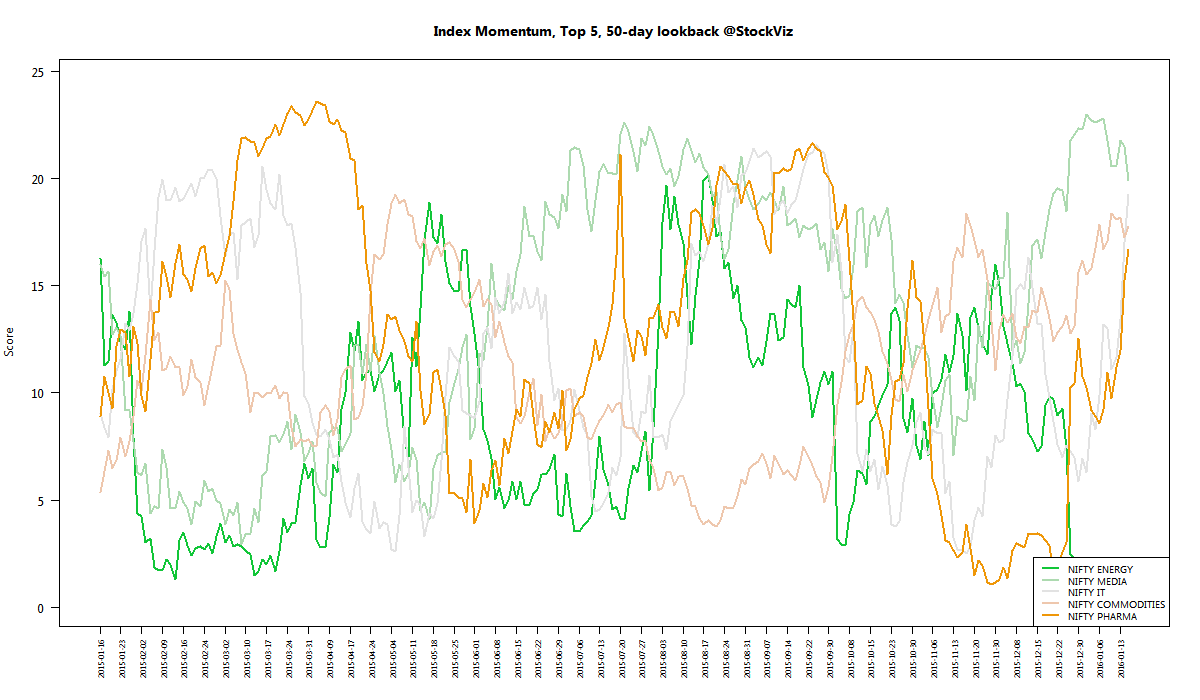
index momentum best 50 2016-01-29 png

index momentum worst 365 2016-01-29 png

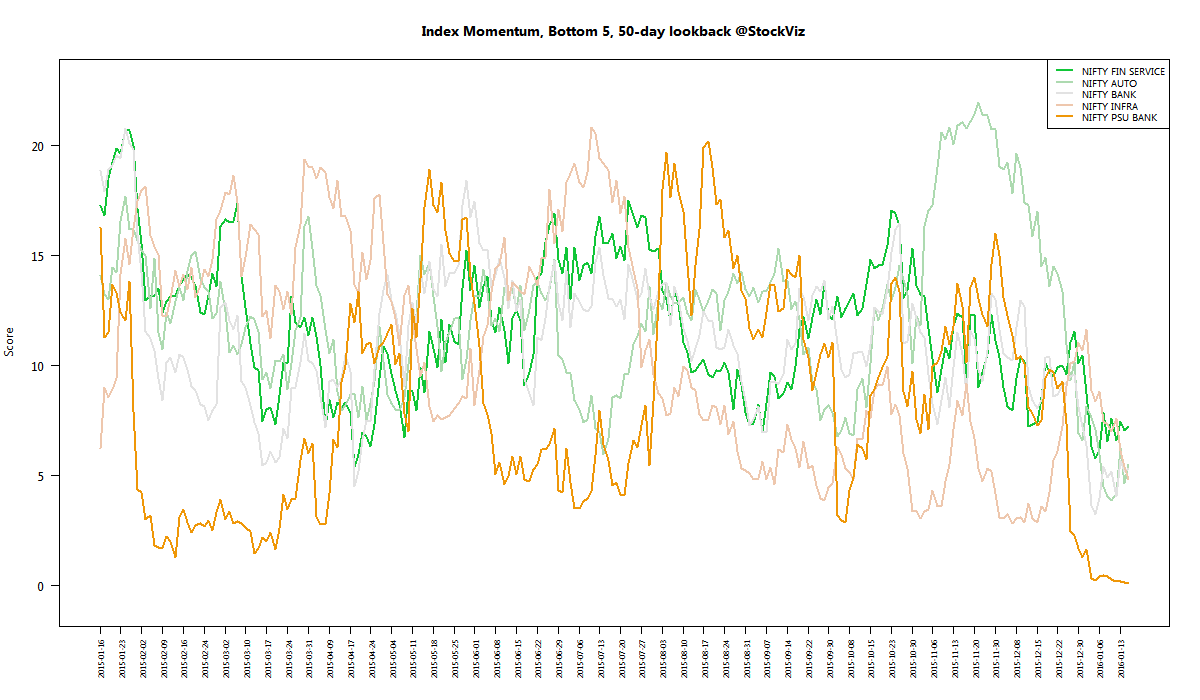
index momentum worst 50 2016-01-29 png

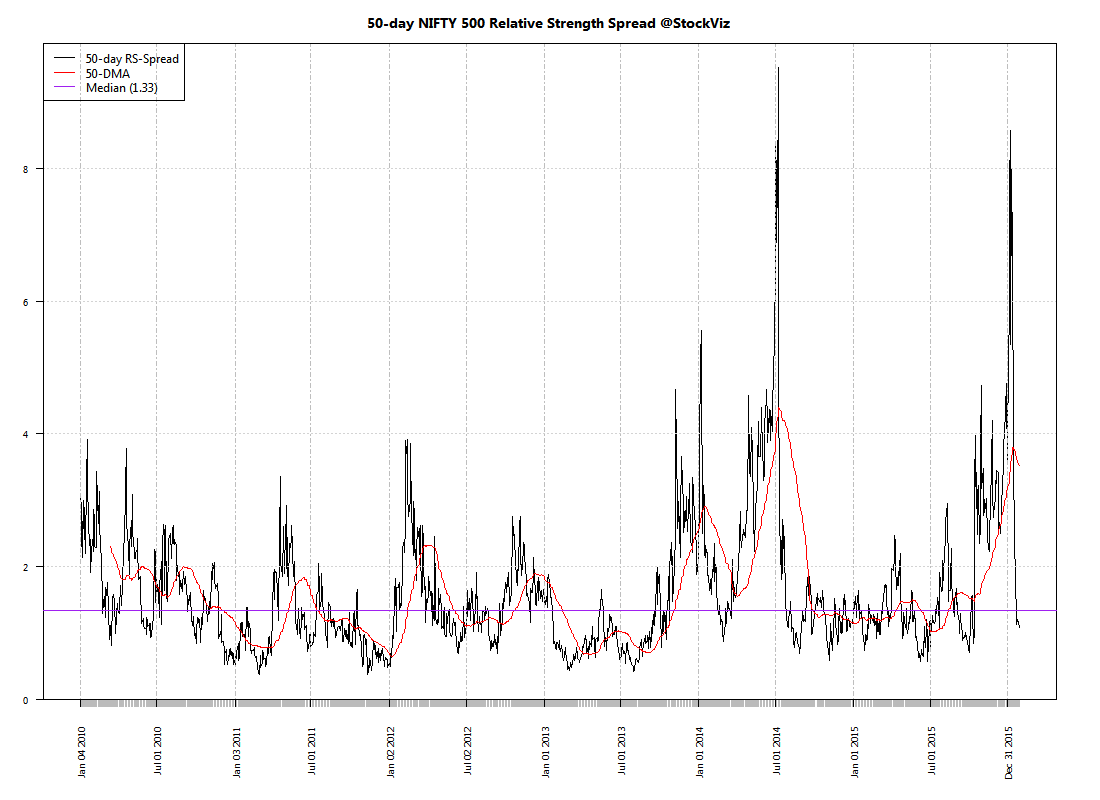
Relative Strength Spread

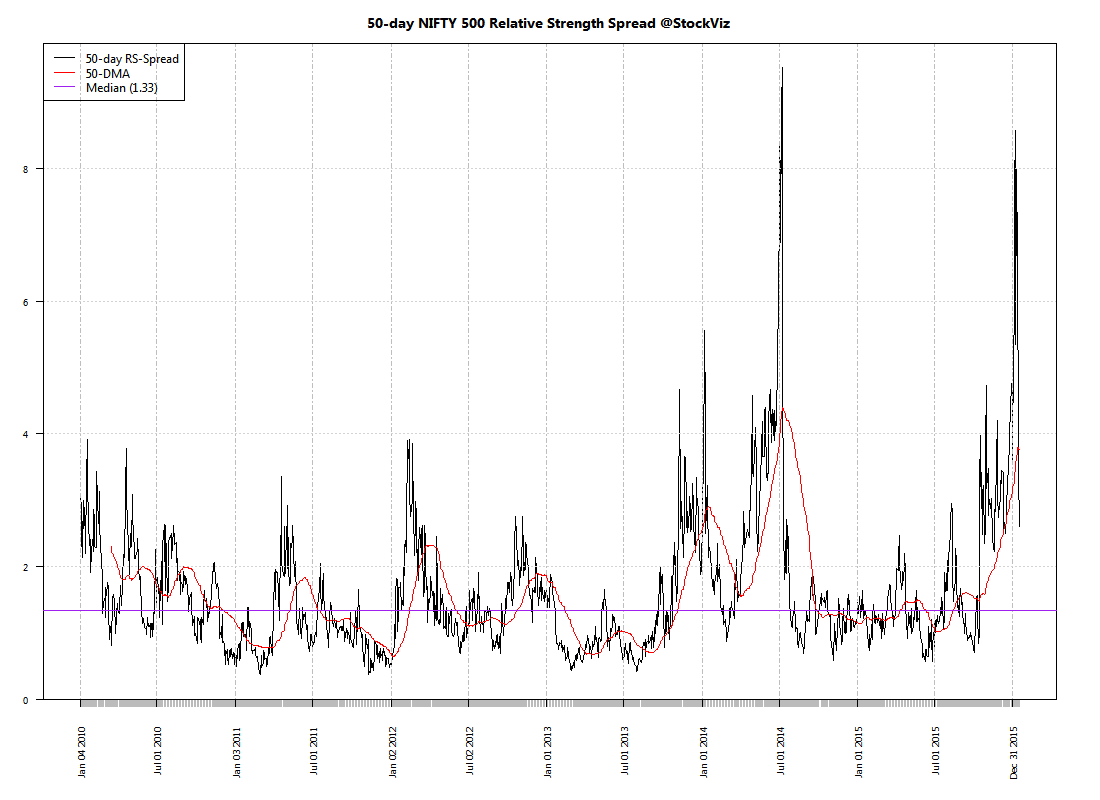
NIFTY_500 relative-spread-index 50 2016-01-29 png

Refactored Index Performance

50-day performance, from November 18, 2015 through January 29, 2016:

Trend Model Summary

Index Signal % From Peak Day of Peak
NIFTY AUTO SHORT
16.42
2015-Jan-27
NIFTY BANK SHORT
24.48
2015-Jan-27
NIFTY COMMODITIES LONG
37.22
2008-Jan-04
NIFTY CONSUMPTION SHORT
10.38
2015-Aug-05
NIFTY ENERGY LONG
29.10
2008-Jan-14
NIFTY FIN SERVICE SHORT
21.30
2015-Jan-28
NIFTY FMCG SHORT
14.18
2015-Feb-25
NIFTY INFRA SHORT
61.28
2008-Jan-09
NIFTY IT LONG
88.23
2000-Feb-21
NIFTY MEDIA LONG
16.13
2008-Jan-04
NIFTY METAL LONG
69.81
2008-Jan-04
NIFTY MNC LONG
17.75
2015-Aug-10
NIFTY PHARMA LONG
15.00
2015-Apr-08
NIFTY PSE LONG
36.55
2008-Jan-04
NIFTY PSU BANK SHORT
57.35
2010-Nov-05
NIFTY REALTY LONG
91.83
2008-Jan-14
NIFTY SERV SECTOR SHORT
16.69
2015-Mar-03
Pharma seems to be clawing its way back up the momentum charts…

Index Update 16.01.2016

MOMENTUM

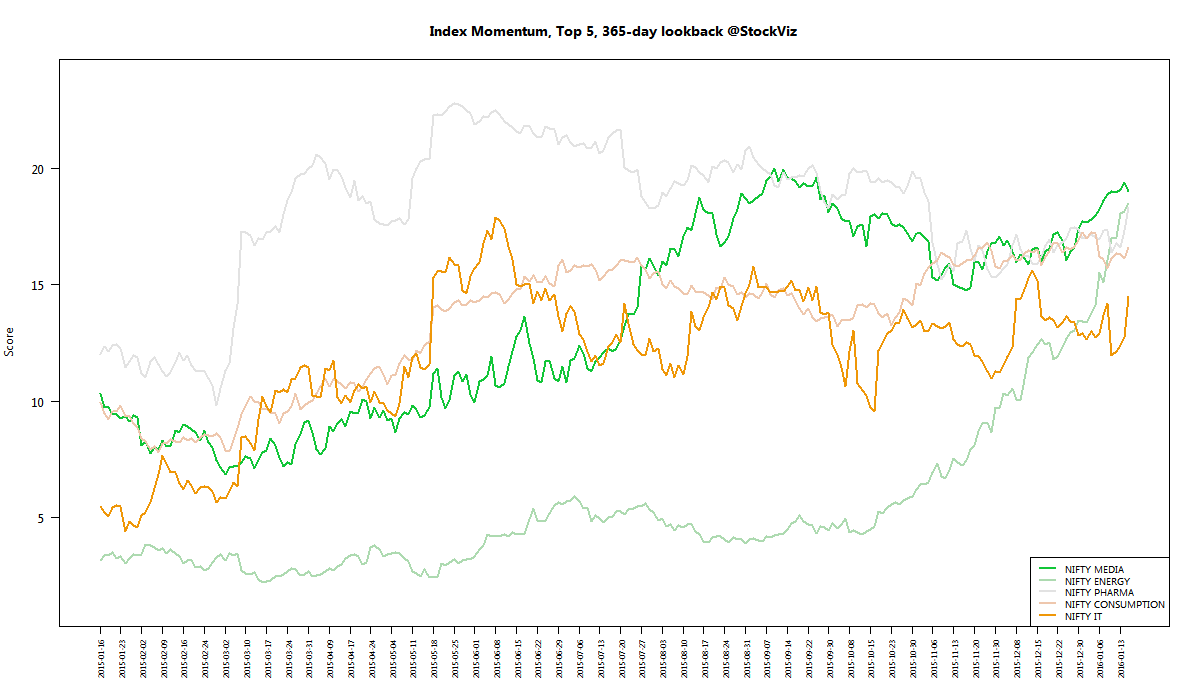
We run our proprietary momentum scoring algorithm on indices just like we do on stocks. You can use the momentum scores of sub-indices to get a sense for which sectors have the wind on their backs and those that are facing headwinds.

Traders can pick their longs in sectors with high short-term momentum and their shorts in sectors with low momentum. Investors can use the longer lookback scores to position themselves using our re-factored index Themes.

You can see how the momentum algorithm has performed on individual stocks here.

Here are the best and the worst sub-indices:
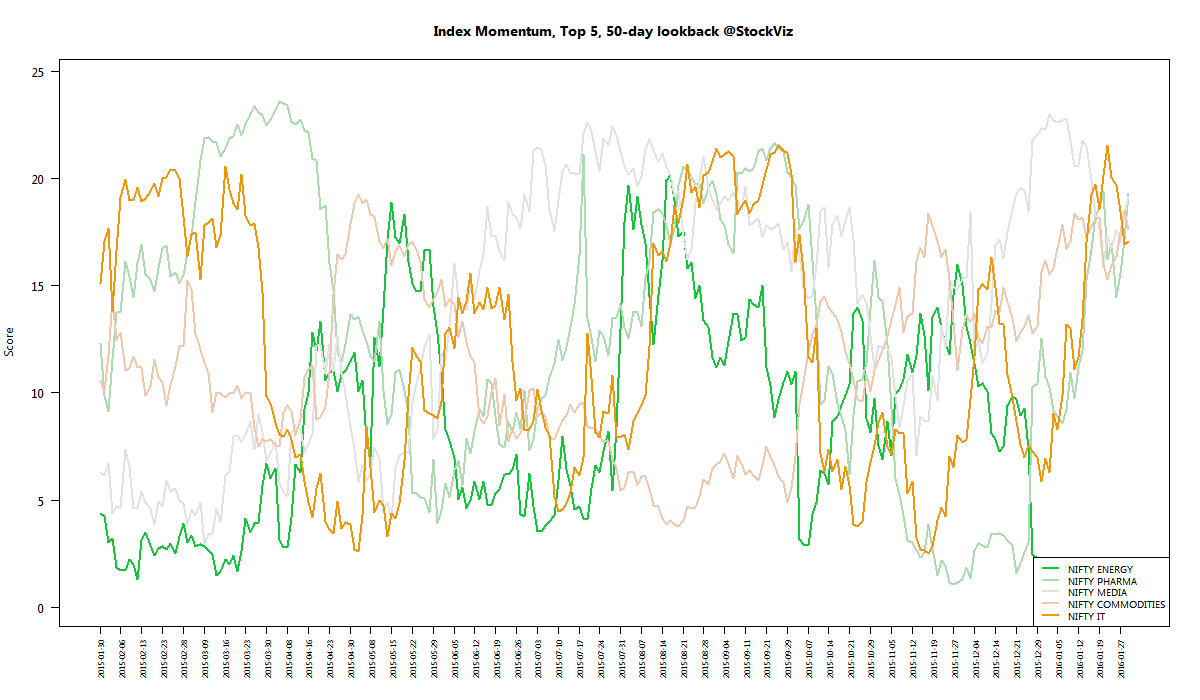
index momentum best 365 2016-01-15 png

index momentum best 50 2016-01-15 png

index momentum worst 365 2016-01-15 png

index momentum worst 50 2016-01-15 png

Relative Strength Spread

NIFTY_500 relative-spread-index 50 2016-01-15 png

Refactored Index Performance

50-day performance, from November 03, 2015 through January 15, 2016:

Trend Model Summary

Index Signal % From Peak Day of Peak
NIFTY AUTO LONG
17.09
2015-Jan-27
NIFTY BANK LONG
26.02
2015-Jan-27
NIFTY COMMODITIES SHORT
37.60
2008-Jan-04
NIFTY CONSUMPTION LONG
10.19
2015-Aug-05
NIFTY ENERGY SHORT
28.34
2008-Jan-14
NIFTY FIN SERVICE LONG
22.84
2015-Jan-28
NIFTY FMCG LONG
14.35
2015-Feb-25
NIFTY INFRA LONG
60.96
2008-Jan-09
NIFTY IT SHORT
88.49
2000-Feb-21
NIFTY MEDIA LONG
18.33
2008-Jan-04
NIFTY METAL LONG
70.43
2008-Jan-04
NIFTY MNC LONG
15.76
2015-Aug-10
NIFTY PHARMA LONG
18.59
2015-Apr-08
NIFTY PSE SHORT
36.99
2008-Jan-04
NIFTY PSU BANK LONG
56.98
2010-Nov-05
NIFTY REALTY LONG
91.74
2008-Jan-14
NIFTY SERV SECTOR LONG
18.49
2015-Mar-03
Pretty much every sub-index has a negative 50-day return…

Theme: Quality to Price Update 04.01.2016

held since returns (%)
EVERESTIND
2014-Jul-07
+16.77
GEOMETRIC
2014-Mar-13
+54.95
HITECHPLAS
2014-Jul-07
+175.89
INFINITE
2014-Oct-07
+23.97
MASTEK
2013-Aug-28
+19.14
MBECL
2014-Mar-13
+55.23
OMAXAUTO
2015-Jan-19
+57.58
SUNCLAYLTD
2015-Jan-19
+18.68
TRIDENT
2014-Oct-07
+97.03
UFLEX
2014-Jul-07
+41.59
WSTCSTPAPR
2014-Jul-07
+19.07
LUMAXIND
2015-Jul-07
+50.39
SUNDRMBRAK
2015-Jul-07
+11.55
GARWALLROP
2015-Jul-07
+71.68
HARITASEAT
2015-Jul-07
+146.41
ORIENTBELL
2015-Jul-07
+18.60
SURYAROSNI
2015-Jul-07
+8.86
AGCNET
2015-Jul-07
-12.67
UCALFUEL
2015-Jul-07
+29.00
CANTABIL
2015-Jul-07
+5.85
Since the last rebalance on 2015-Jul-07 till 2016-Jan-01, this strategy has returned +37.90%

You can find more details about the Quality to Price Theme here.

Theme: Acceleration Update 01.01.2016

held since returns (%)
8KMILES
2015-Nov-19
+16.07
RAJESHEXPO
2015-Nov-19
-1.53
GAYAPROJ
2015-Nov-19
+4.83
COSMOFILMS
2015-Nov-19
-1.79
RUSHIL
2015-Nov-19
+7.30
HIMATSEIDE
2015-Nov-19
+2.45
NIITLTD
2015-Nov-19
+7.47
PTL
2015-Nov-19
+0.33
ESTER
2015-Nov-19
+5.46
EMMBI
2015-Nov-19
+14.50
TRIDENT
2015-Nov-19
+7.29
GUFICBIO
2015-Nov-19
+6.63
NITCO
2015-Nov-19
+43.07
DISHMAN
2015-Dec-01
+6.83
DEEPIND
2015-Dec-01
-11.48
CYBERTECH
2015-Dec-01
-7.17
ADSL
2015-Dec-01
-2.26
TANLA
2015-Dec-01
+9.33
TRIVENI
2015-Dec-01
+13.91
MRO-TEK
2015-Dec-01
+30.95
Since the last rebalance on 2015-Dec-01 till 2015-Dec-31, this strategy has returned +2.09%

You can find more details about the Acceleration Theme here.