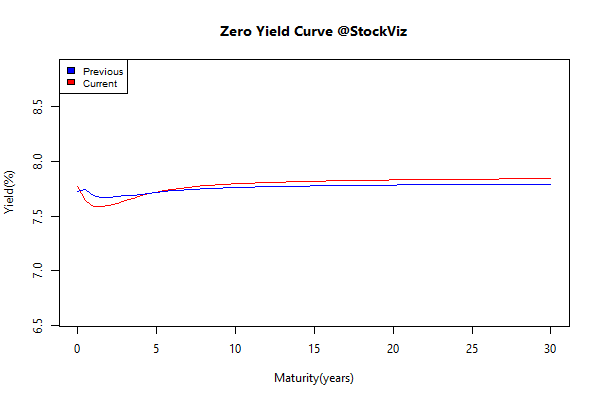
US TREASURIES VS. GILT SPREAD
The spread between 10yr US Treasuries and Indian Gilts remained within a tight range this month.
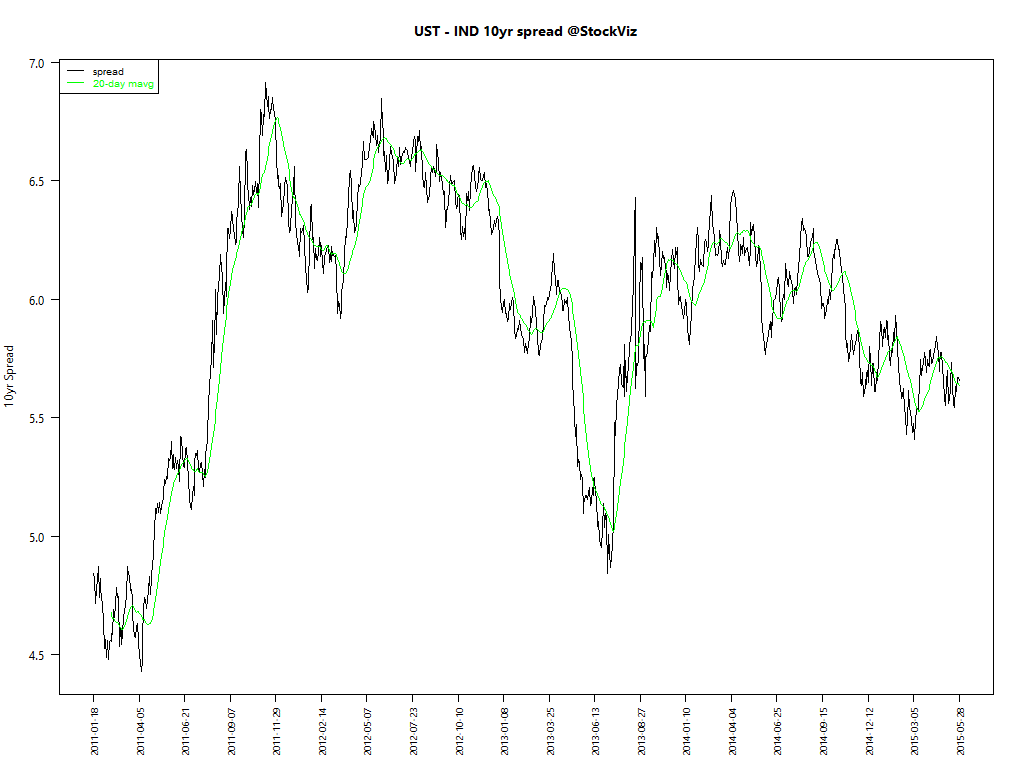
Long-term US bond yields leapt higher in May…
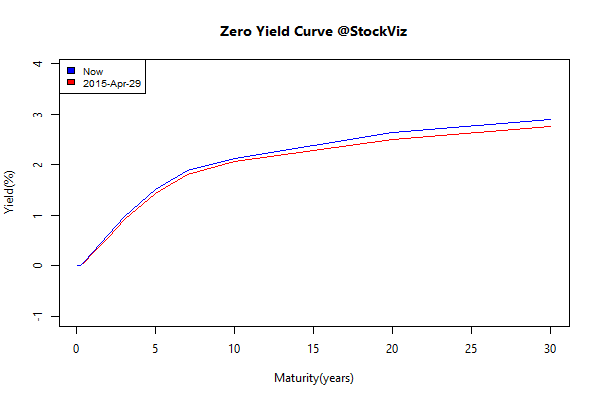
… and the spread was kept in check by Indian gilts moving in tandem.
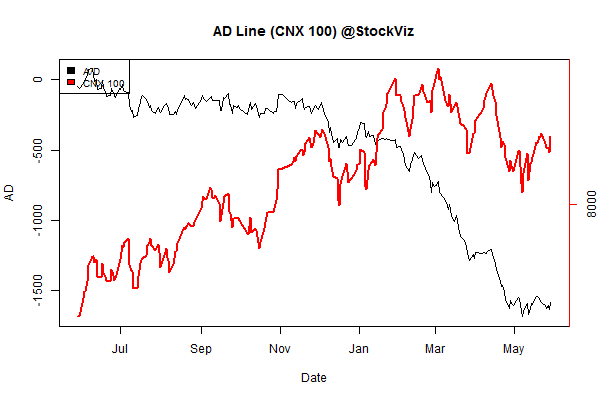
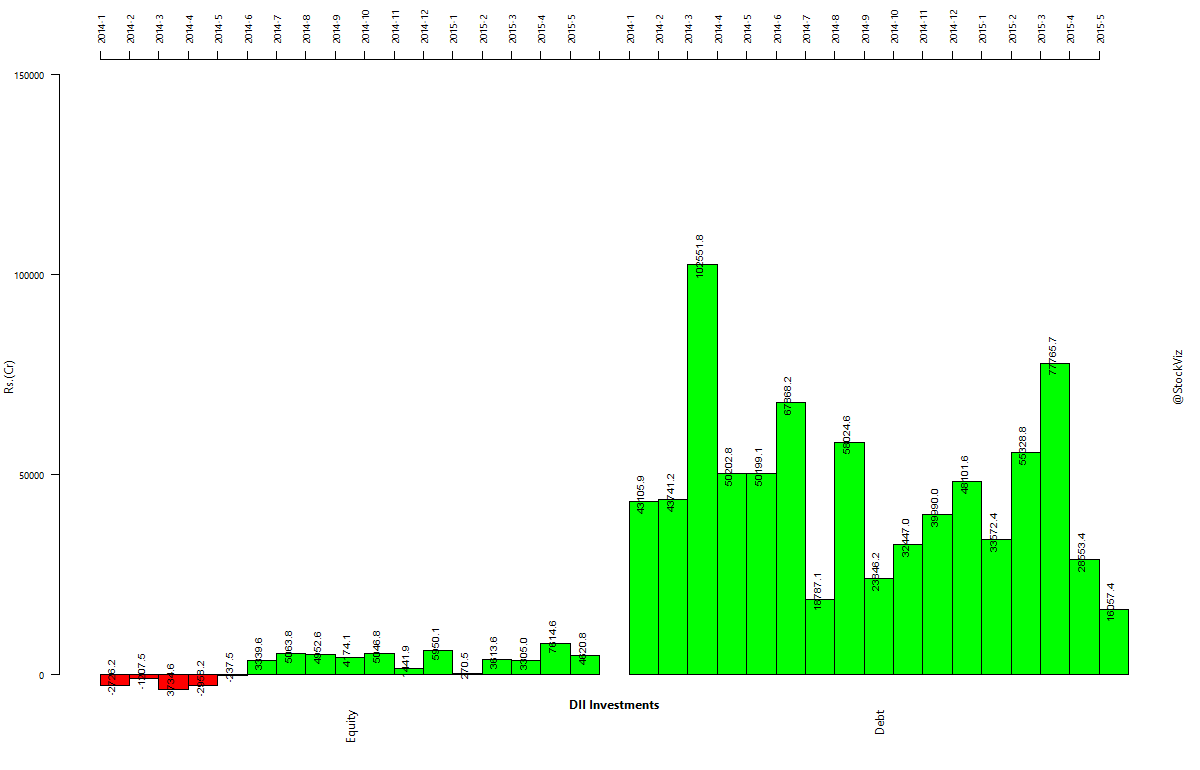
INSTITUTIONAL INVESTMENTS
FPIs took an asston of money out of Indian markets because of regressive and retrograde tax demands. Huge outflows both in equity and bond markets.
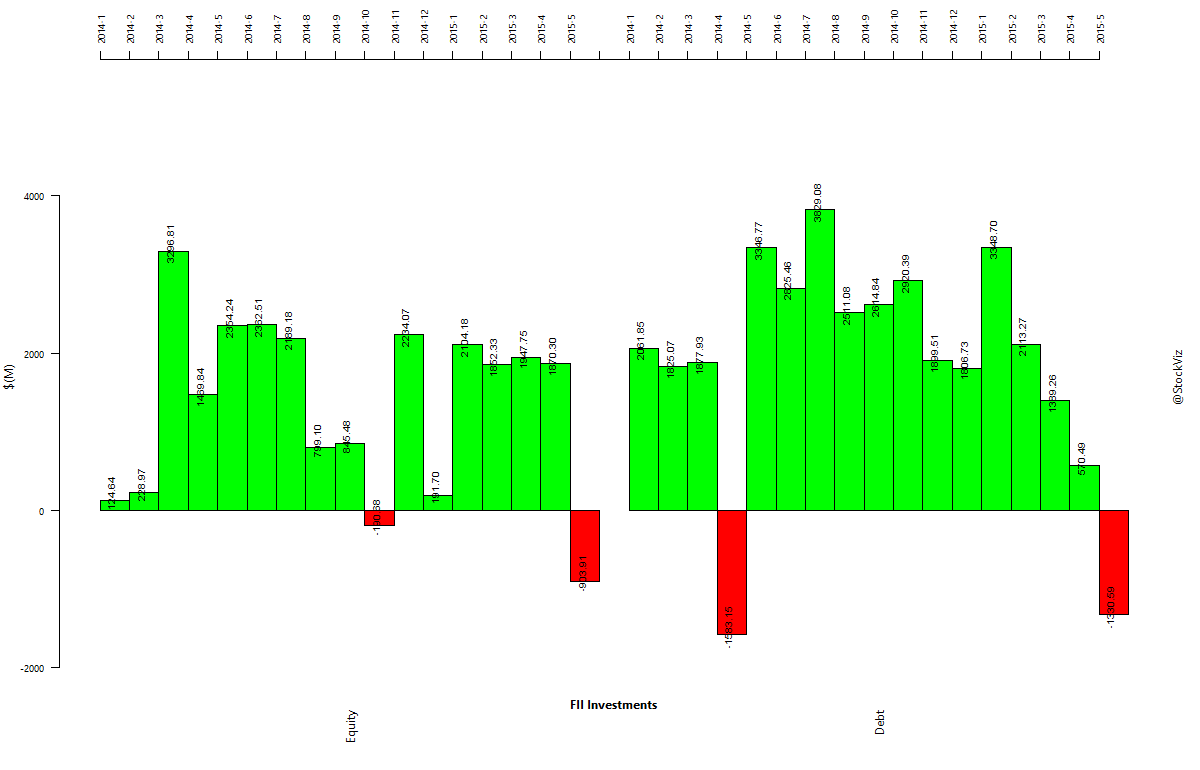
Domestic institutional investors tried to keep up but were helpless under the onslaught.
Lets zoom into what happened on a daily basis to get sense for how badly we shot ourselves on our foot:
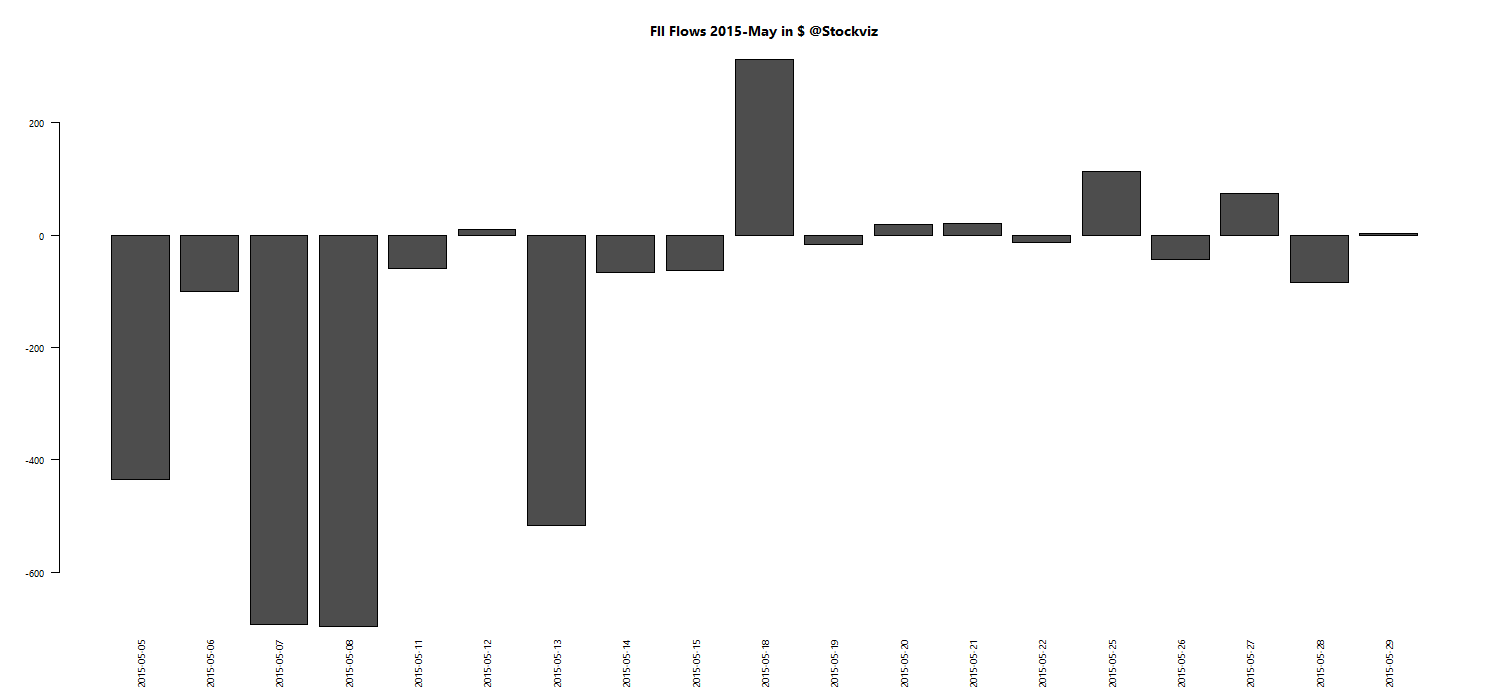
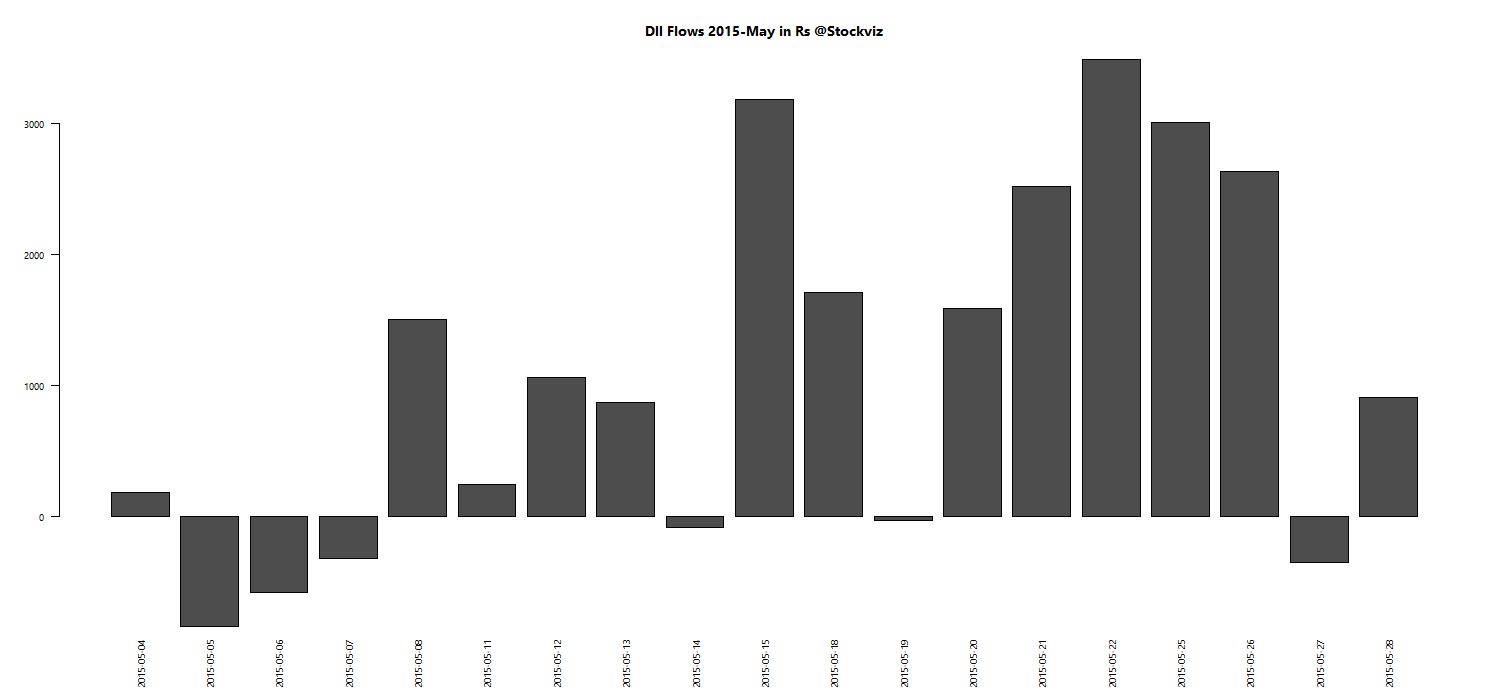
DIIs pushed the buy button near the end of the month – after the FIIs had finished scaring the bejeebers out of the market.
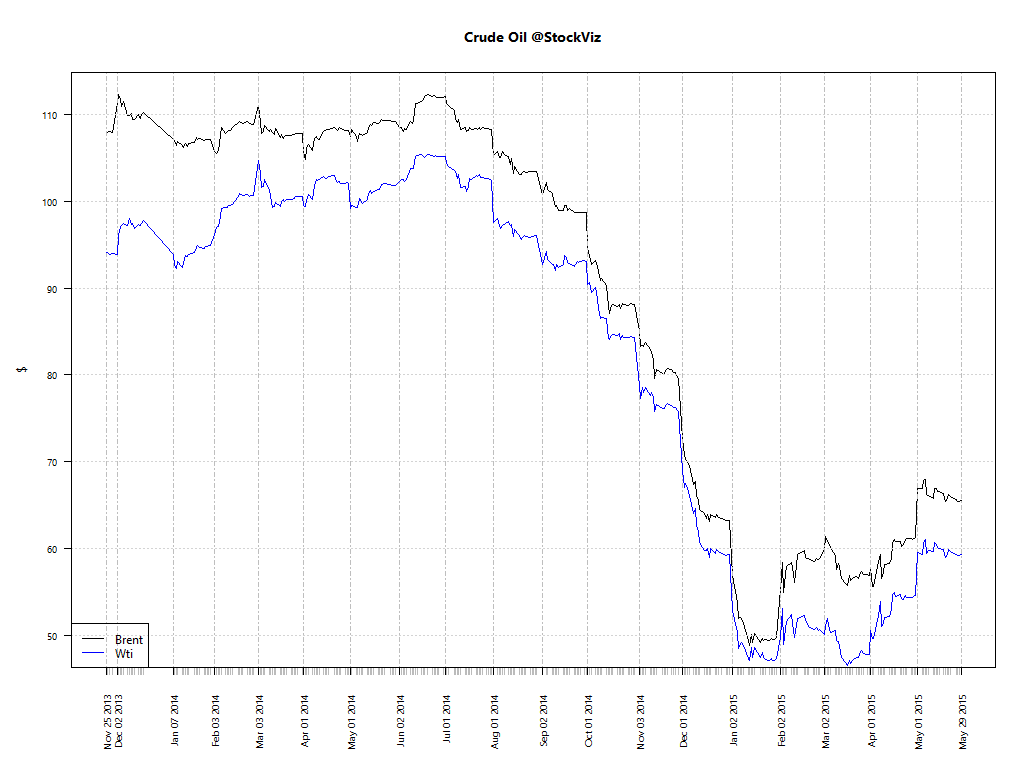
Oil
Oil futures in Nymex seem to have trailed off for now.
Gold
Gold seems to be headed lower. As rate hikes get factored in, expect precious metals to drop more in USD terms.
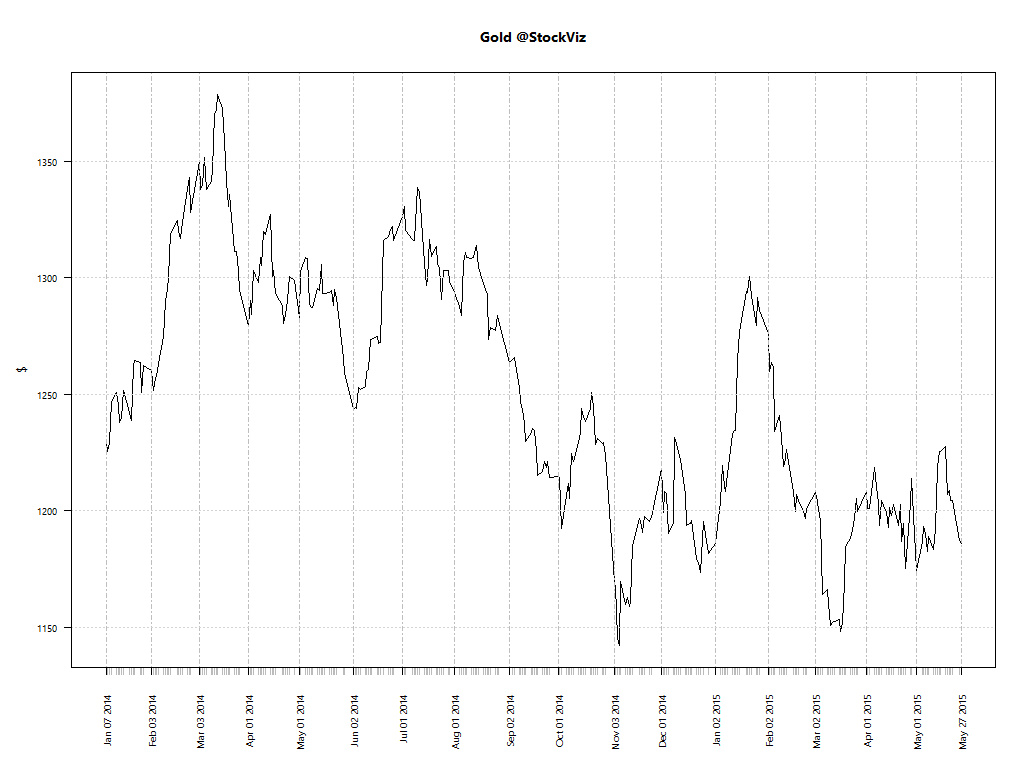
And it seems to have trailed off in INR terms after an early spurt in May.

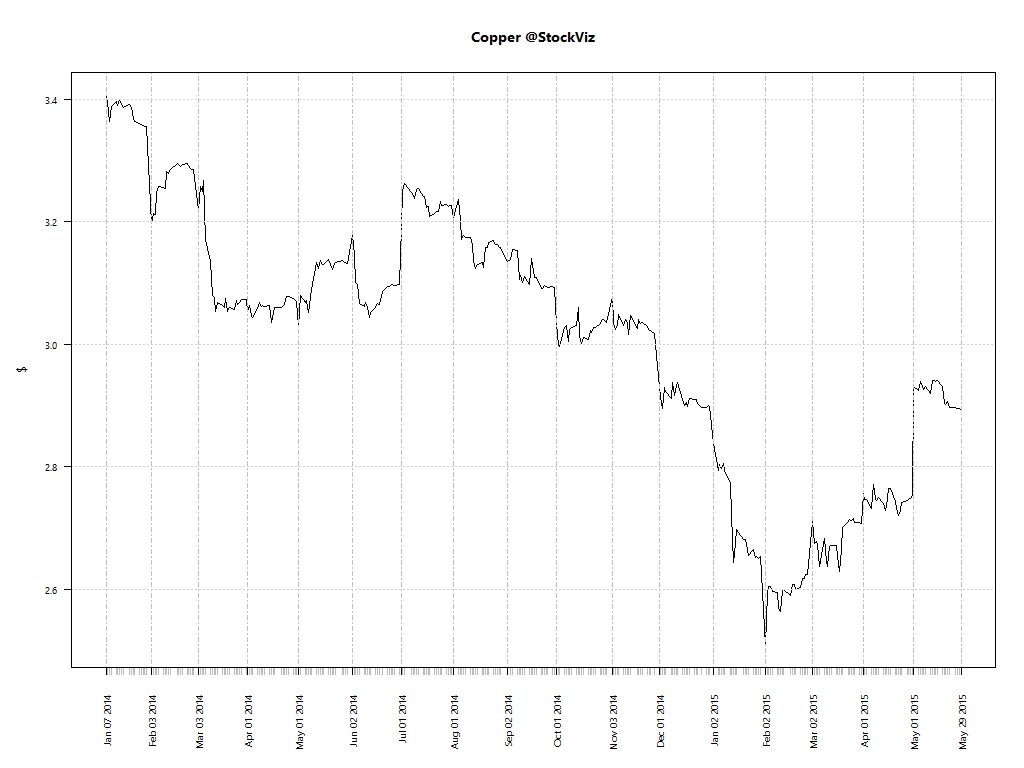
Copper
Copper is supposed to be a bellwether for global manufacturing and that seems to be back at Dec’14 levels.
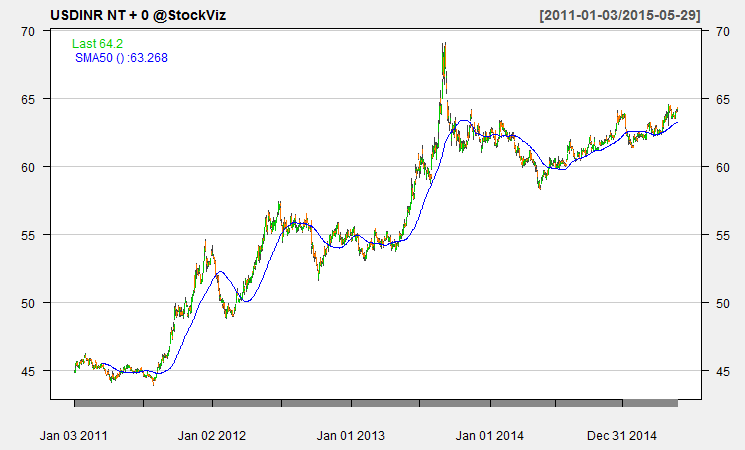
USDINR
The rupee continued to depreciate against the US dollar in May.
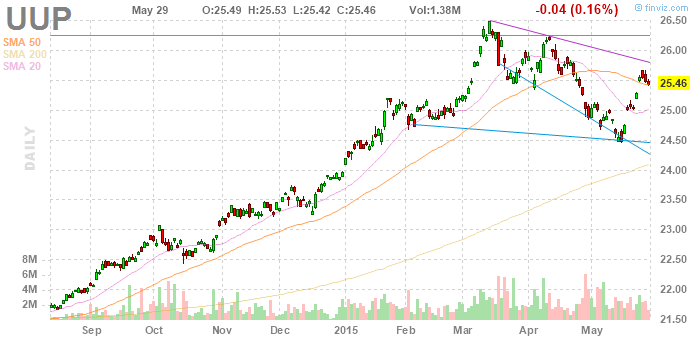
The Dollar Index (DXY) did a nice about turn.
Outlook
Here are some of the headlines this month from FT:
- US government bond market hit by sell-off: “contagion from the European bond rout rolled across the Atlantic”
- Crude jump speeds up bond sell-off: “Oil prices jumped to their highest level this year, nearing $70 a barrel and accelerating a sell-off in global debt markets.”
- Bond market fears liquidity crunch repeat: “regulators are worried about corporate and emerging market bonds”
- Capital flows to emerging markets seen at post-2009 low: “to slow to $981bn in 2015, down from $1,048bn in 2014”
- India’s re-re-Modified markets: India’s foreign ownership (absolute & relative) is at a new peak: $350b, 23% of India’s top 500 cos.
And while all this was being said and read, the Nifty went up 3% and our Momentum strategy was up 6% in May. (Monthly Recap) I am sure there is a lesson in market timing in there somewhere.
In terms of positioning your portfolio, the dollar is probably going to head higher since US rates are going to go up and Indian rates are going to go down. Oil usually goes in the opposite direction of the dollar. Gold in USD terms is probably going to head lower as rates normalize.