Author: shyam

The Non-Existent ETF Volumes

ETFs don’t trade in India

The NIFTYBEES ETF – an ETF that is indexed to the NIFTY – has less daily volume than RELIANCE. Median daily volumes of NIFTYBEES is around 31,000 whereas RELIANCE sees more than 3161,000.

NIFTYBEES:
niftybees.volume

RELIANCE:
RELIANCE.volume

In spite of paying dealers to provide liquidity

The NSE introduced a Liquidity enhancement scheme (LES) for market making in equity exchange traded funds (ETFs) effective from December 15, 2014 till February 28, 2015. It was then extended to June 30, 2015 (see appendix). The results have been mixed.

BANKBEES:
BANKBEES.volume

JUNIORBEES:
JUNIORBEES.volume

M100:
M100.volume

Daily volumes of M100 went down during the program. Here is the full list, volumes in ‘000s:

etf volumes

The program might have resulted in tighter bid-ask spreads but there was no surge in volumes. Retail investors remain disinterested in ETFs.

Appendix


Are Dividends Anti-Shareholder?

Dividends vs. Buy-backs

When firms are left with excess cash, they have the option of distributing money back to shareholders by either issuing dividends or buying back their stock.

All things being equal, investors should be indifferent whether a company pays dividends or engages in a buy-back.

The dividend irrelevance argument

The underlying intuition for the dividend irrelevance proposition is simple. Firms that pay more dividends offer less price appreciation but must provide the same total return to stockholders, given their risk characteristics and the cash flows from their investment decisions. Thus, there are no taxes, or if dividends and capital gains are taxed at the same rate, investors should be indifferent to receiving their returns in dividends or price appreciation. (Source: NYU)

Indian Taxes

In India, long-term capital gains in equity investments attract zero tax. Long-term is one year. However, there is a dividend distribution tax of around 28%. So if a company decides to pay Rs. 100 in dividend, only Rs. 72 reaches the shareholder.

In this scenario, companies that declare dividends are taking a step that is against the interests of the share-holder. Investors are better off if the company buys back stock from the open market instead.

Here are some of the largest dividend payers:

2015 2014
TCS

17020.50
5480.10
INFRATEL

1682.20
566.60
VEDL

3106.30
2214.40
ITC

4875.60
4238.60
WIPRO

2949.00
2327.30
HDFC

2505.90
1939.90
HINDUNILVR

2918.90
2495.60
TECHM

549.60
135.90
ICICIBANK

3084.10
2704.00
HINDZINC

1878.50
1532.50
The figures are in Rs. crores and nearly 1/3rd of this goes to the tax-man.
One wonders if these companies are working for the Indian government instead of the shareholder.

Conclusion

Small investors and fund managers should demand that the boards consider buy-backs over dividends.

Weekly Recap: Sorry, monkeys

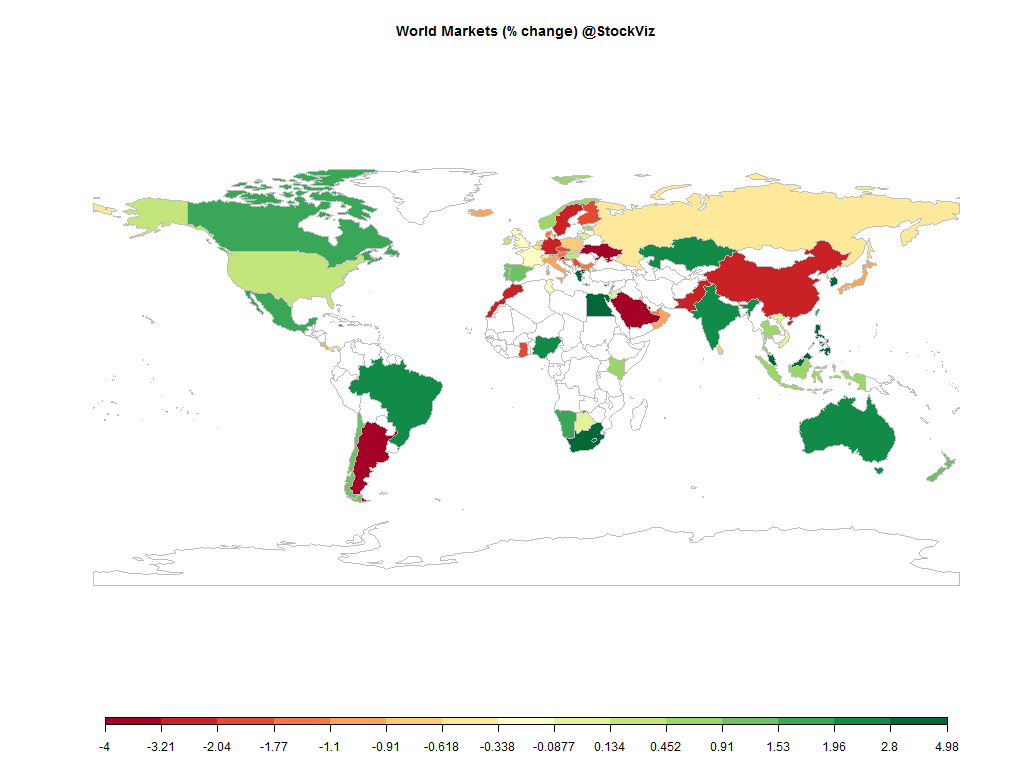
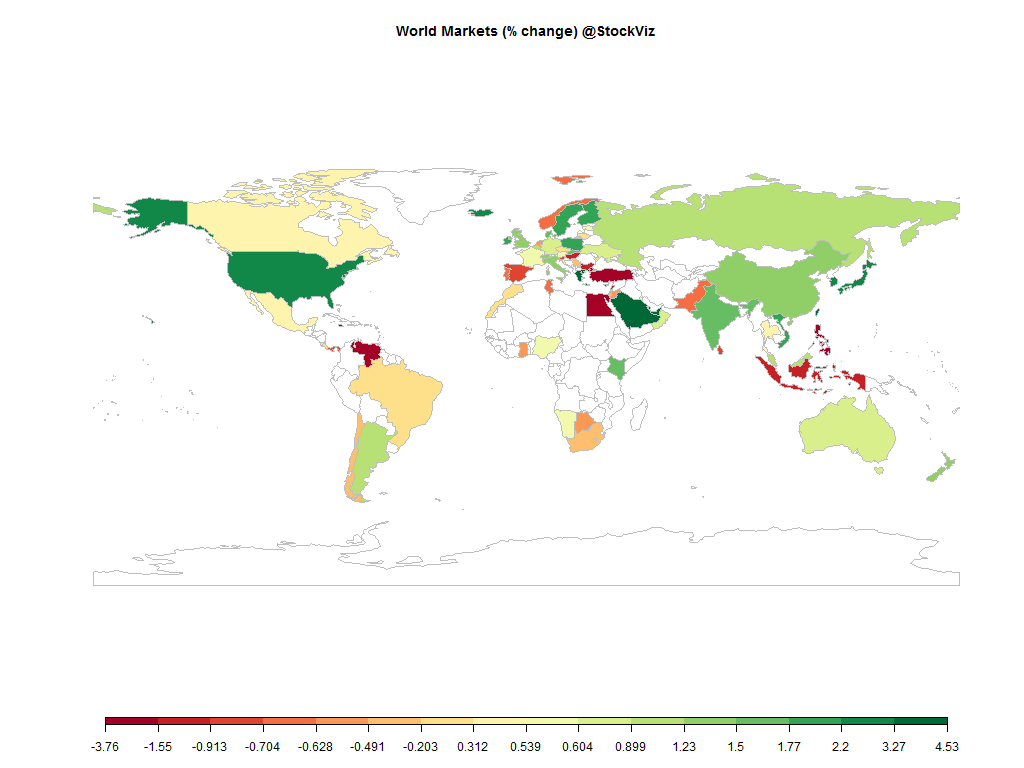
world.2015-07-10.2015-07-17

Equities

Major
DAX(DEU) +3.16%
CAC(FRA) +4.51%
UKX(GBR) +1.52%
NKY(JPN) +4.40%
SPX(USA) +2.37%
MINTs
JCI(IDN) +0.22%
INMEX(MEX) +1.04%
NGSEINDX(NGA) -2.15%
XU030(TUR) -0.04%
BRICS
IBOV(BRA) -0.77%
SHCOMP(CHN) +2.05%
NIFTY(IND) +2.98%
INDEXCF(RUS) +1.61%
TOP40(ZAF) +1.81%

Commodities

Energy
Ethanol -6.35%
Heating Oil -4.58%
Brent Crude Oil -2.84%
RBOB Gasoline -4.64%
WTI Crude Oil -3.77%
Natural Gas +4.26%
Metals
Gold 100oz -2.07%
Palladium -5.52%
Platinum -3.68%
Copper -1.57%
Silver 5000oz -5.13%

Currencies

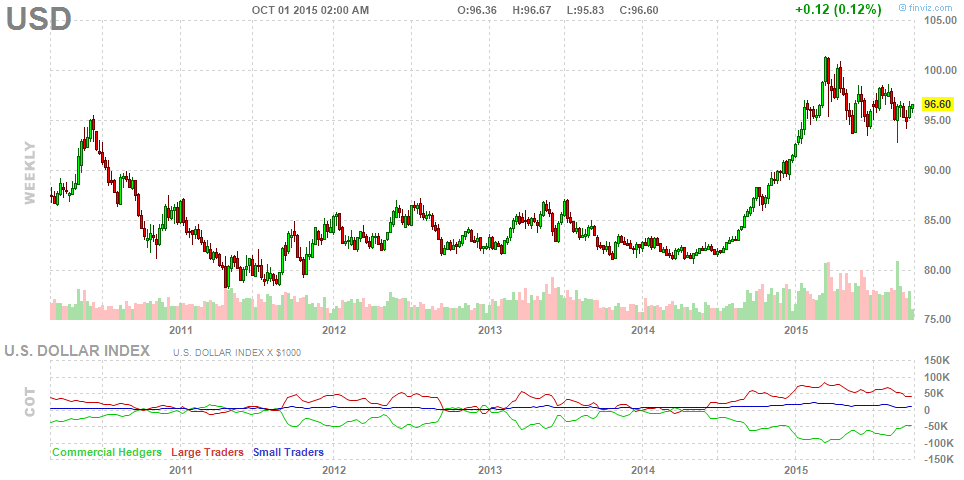
USDEUR:+2.77% USDJPY:+1.02%

MINTs
USDIDR(IDN) +0.29%
USDMXN(MEX) +1.30%
USDNGN(NGA) +0.79%
USDTRY(TUR) -0.53%
BRICS
USDBRL(BRA) +0.60%
USDCNY(CHN) +0.00%
USDINR(IND) +0.12%
USDRUB(RUS) +1.11%
USDZAR(ZAF) -0.81%
Agricultural
Cattle -0.42%
Cocoa +1.46%
Lean Hogs -4.47%
Lumber -6.25%
Orange Juice -0.12%
Soybean Meal -1.34%
White Sugar -4.23%
Corn -1.52%
Cotton +0.08%
Feeder Cattle +1.70%
Coffee (Arabica) +3.49%
Coffee (Robusta) -2.70%
Soybeans -2.78%
Sugar #11 -3.63%
Wheat -3.44%

Credit Indices

Index Change
Markit CDX EM +0.26%
Markit CDX NA HY +0.77%
Markit CDX NA IG -5.48%
Markit iTraxx Asia ex-Japan IG -5.65%
Markit iTraxx Australia -7.09%
Markit iTraxx Europe -10.49%
Markit iTraxx Europe Crossover -48.99%
Markit iTraxx Japan -5.36%
Markit iTraxx SovX Western Europe -4.75%
Markit LCDX (Loan CDS) +0.00%
Markit MCDX (Municipal CDS) -5.16%
Can we get an encore? Or are we going to start worrying about flaccid earnings and get depressed all over again?

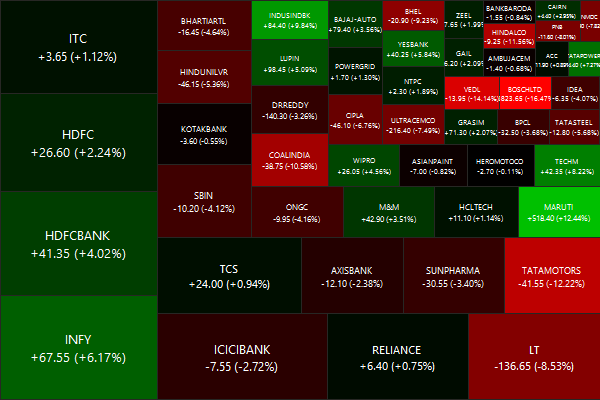
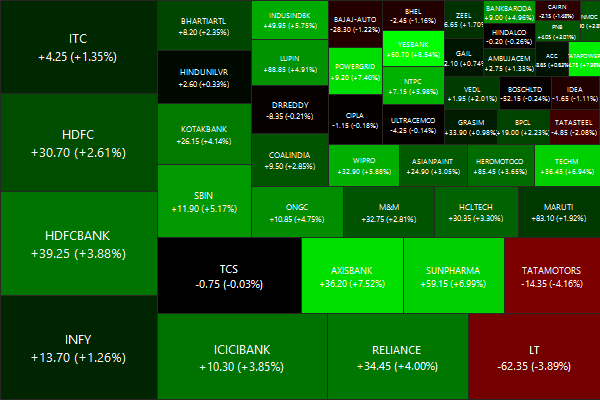
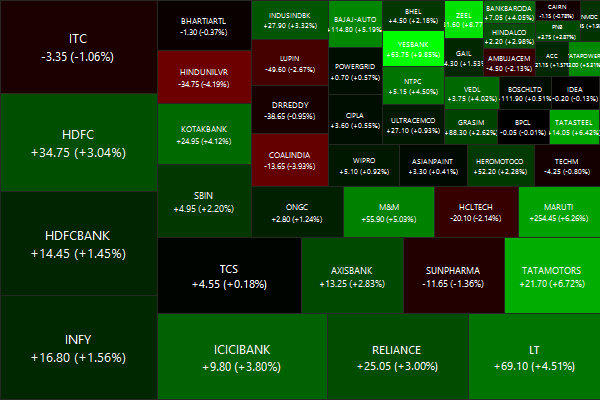
Nifty Heatmap

CNX NIFTY.2015-07-10.2015-07-17

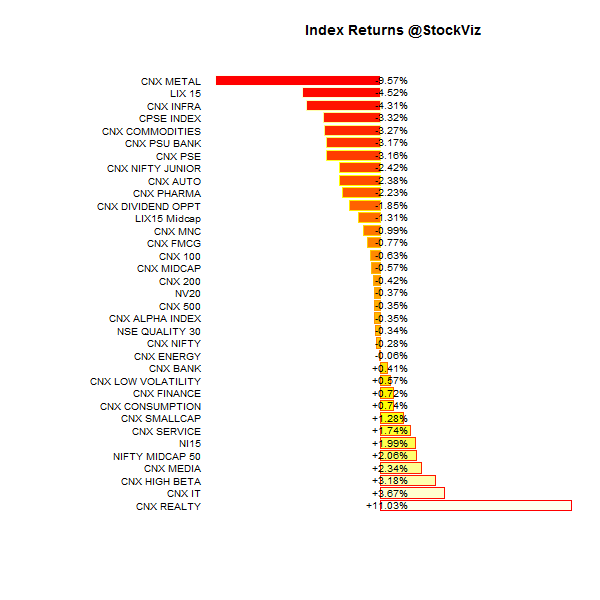
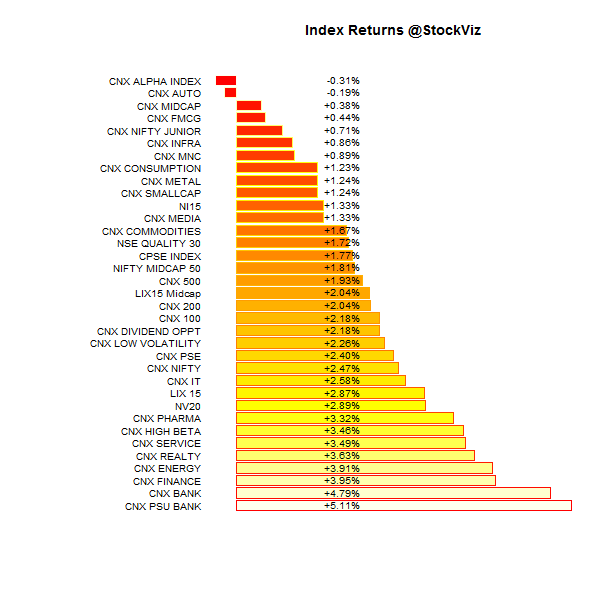
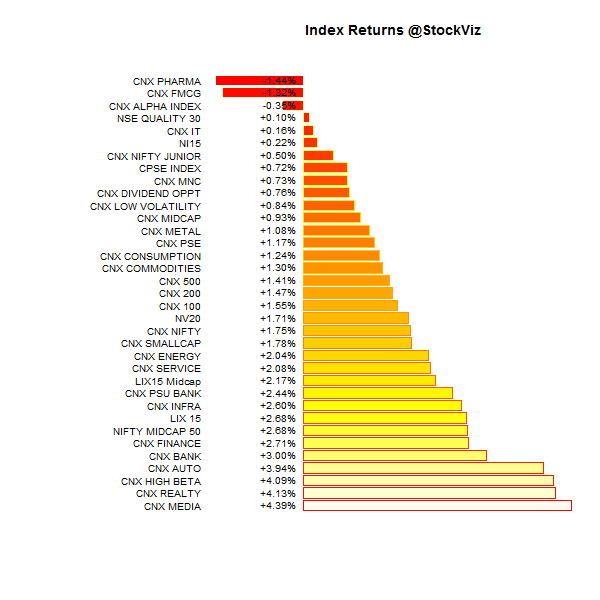
Index Returns

For a deeper dive into indices, check out our weekly Index Update.
index.performance.2015-07-10.2015-07-17

Sector Performance

sector performance.2015-07-10.2015-07-17

Market Cap Decile Performance

Decile Mkt. Cap. Adv/Decl
1 (micro) -3.26% 74/60
2 +3.45% 77/57
3 +5.42% 71/62
4 +4.33% 78/56
5 +3.93% 69/64
6 +3.81% 76/58
7 +3.51% 68/66
8 +4.40% 75/58
9 +2.30% 69/65
10 (mega) +3.07% 69/65
An across the board rally…

Top Winners and Losers

INFRATEL +7.56%
HINDPETRO +8.00%
TATACHEM +9.65%
SRTRANSFIN -4.36%
BAJAJHLDNG -2.82%
TITAN -1.93%
Fall in oil prices lifted OMC stocks…

ETF Performance

NIFTYBEES +3.14%
JUNIORBEES +2.72%
BANKBEES +2.63%
CPSEETF +2.38%
INFRABEES +1.33%
PSUBNKBEES -0.43%
GOLDBEES -1.56%
Large-caps dominated mid-caps. Gold hit 5-year lows in USD…

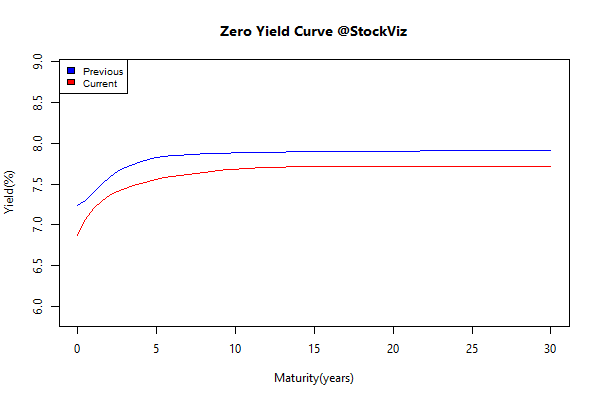
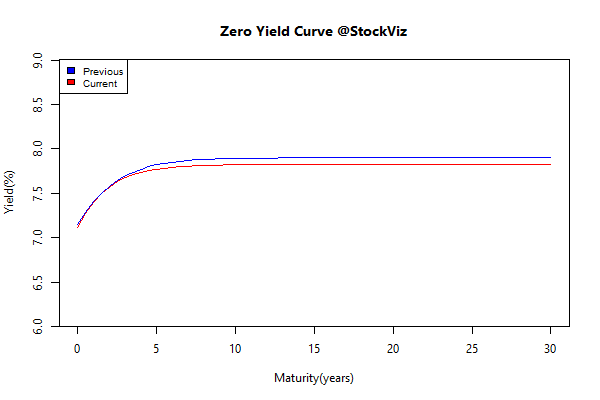
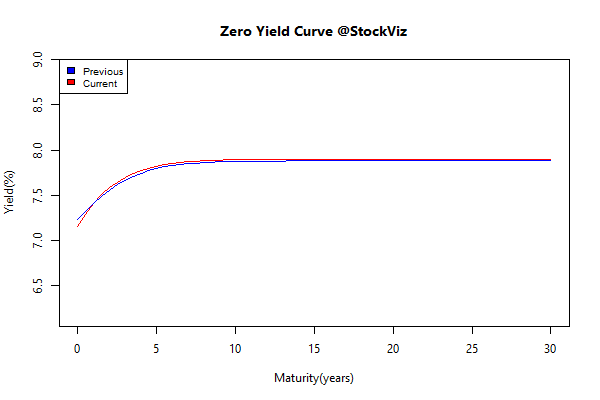
Yield Curve

yield Curve.2015-07-10.2015-07-17

Bond Indices

Sub Index Change in YTM Total Return(%)
0 5 +0.04 +0.04%
5 10 +0.05 -0.12%
10 15 +0.04 -0.16%
15 20 +0.06 -0.40%
20 30 +0.04 -0.28%
Long bonds got shellacked…

Investment Theme Performance

No Theme left behind. A broad-based rally lifted all investment strategies.

Equity Mutual Funds

Bond Mutual Funds

Thought for the weekend

Mutual fund performance is similar to the performance of stocks. As a company matures and grows, more investors become aware of it, and its share price better reflects its prospects. This explains the phenomenon of how valuations and returns of benchmark indexes for smaller companies are usually higher than larger companies. Of course, they’re also riskier.

In the case of mutual funds, impressive alpha attracts more investor money to a fund, and that makes it more difficult to produce alpha since taking larger positions in stocks is going to have a greater impact on share prices.

Source: Can active managers beat dart-throwing monkeys?

Relative Returns of Midcap Funds

midcap mutual fund relative returns

Relative Returns

We wanted to see how different mutual funds compared to the CNX MIDCAP index. We took the annual returns of a dozen funds and subtracted the annual returns of the CNX MIDCAP index. This gives us an idea of how well the fund was managed.

The above result is a bit surprising. Other than the ICICI Prudential Value Discovery Fund, no other fund consistently beat the CNX MIDCAP index. Of course, returns are only half the story, these numbers don’t tell us the risks that were taken to achieve them.

Besides, none of the top funds in a year hold that position over the next (see this.)

Related: Mutual Fund Performance in Bear Markets

Ten years is a long time

Yearly Nifty and Defty Returns

nifty.vs.defty.returns

When you look at the last 24 years of returns, the NIFTY gave negative returns for 8 years – 1/3rd of the time.

Holding period matters

The most frequent advice given to new equity investors is that they should at least have a 3-year horizon. The problem with this is that there have been 7 periods where cumulative 3-year returns have been negative or single digits. This sort of advice does nothing to mentally prepare the investor to stay disciplined.

nifty.defty.3.yr.returns

In fact, dollar investors (NRIs, etc.) have had it rougher.

nifty.defty.5.yr.returns

It is only when you look at 7-years and beyond that you start seeing the kind of returns that begin to make sense.

nifty.defty.7.yr.returns

nifty.defty.10.yr.returns

Long-term portfolio but short-term horizon

Very often, advisors set up portfolios looking at this:

nifty.defty.15.yr.returns

Whereas the media is feeding the investor this:

CNX NIFTY.2015-07-15

Long-term investing works if you have the discipline to ignore portfolio returns over very long time horizons. But how many of us have the discipline to stay the course over decades?