We had introduced the concept of dividing the universe of stocks by market-cap deciles a while ago (StockViz.) Here are some observations.
Returns
The last year has been spectacular for small- and mid-cap stocks.
From August-2014 to Now:
For 2015:
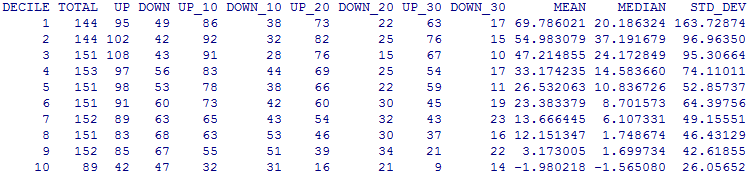
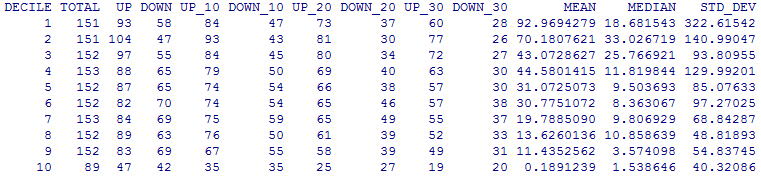
So far in 2016:
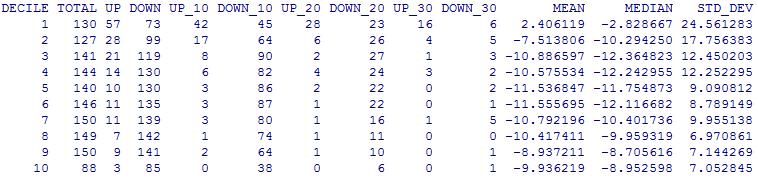
Note: Deciles go from 1 (micro-cap) to 10 (mega-cap)
In 2015:
- If you had blindly invested in an equal-weight portfolio of ~145 micro-cap stocks, you would have been up ~70%
- Every other decile out-performed the mega-caps (decile #1)
- Note how the standard-deviation of returns compress as you walk up the cap
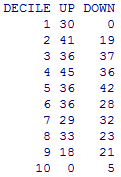
Migrations
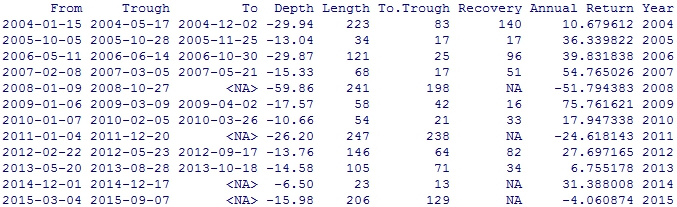
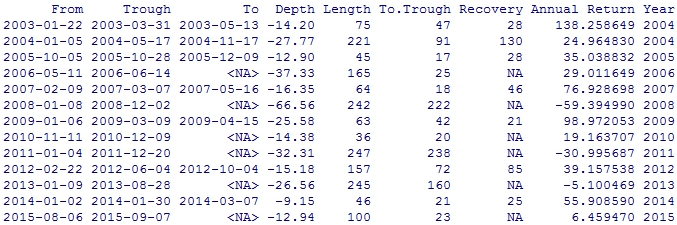
Market breadth indicator
The mega-cap decile (decile #1) can be used as a crude market-timing indicator. If you track the number of stocks in the decile that went up vs. the number that went down, you end up with a proxy for breadth.
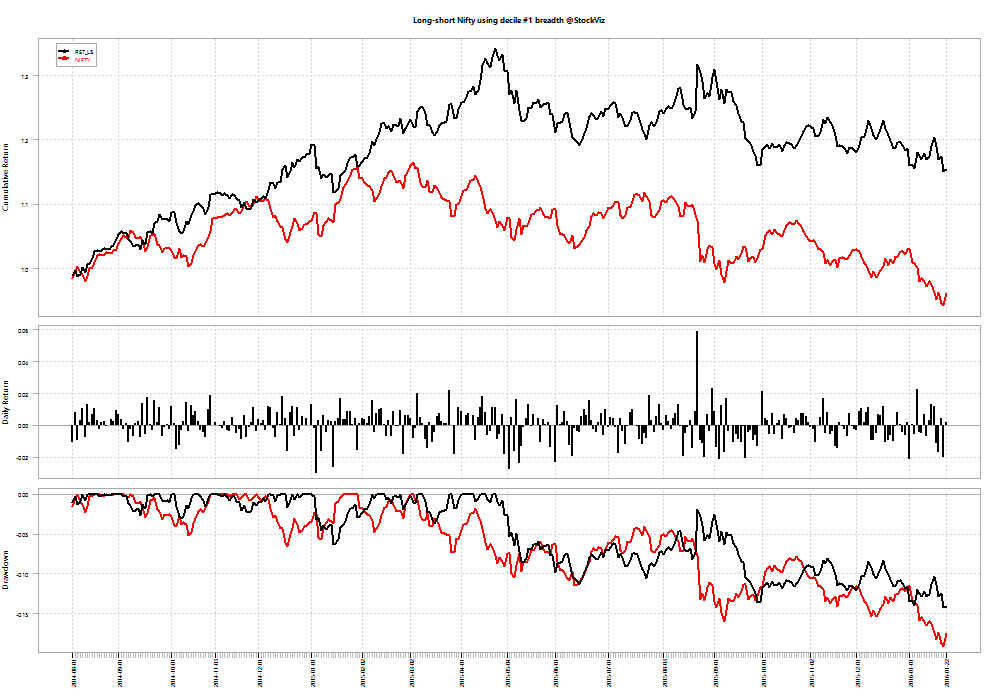
Even though technically it beat the buy-and-hold NIFTY 50, the indicator produces too many trades and it doesn’t offer a large enough margin of out-performance to be useful in live trading.
Next steps
We will continue to poke around and share what we find!