Author: shyam

Trading turnover throughout the day

Turnover, defined as volume over total number of shares outstanding, is not constant throughout the day. If you plot turnover over a trading day, it typically traces a ‘U’ shaped plot.

turnover.BSL

turnover.MEP

turnover.INFY

Notice how turnover is the highest in the first half-hour and the last-half hour of trading? Turns out, it is a global phenomena. It follows that if you want liquidity, then it is enough if you show up for the last half-hour of trading.

Related:
Trading Day of Month Returns
Equity Returns at the Turn of the Month
Improving VWAP Strategies: A Dynamic Volume Approach

Monthly Recap: May you live in Interesting Times…

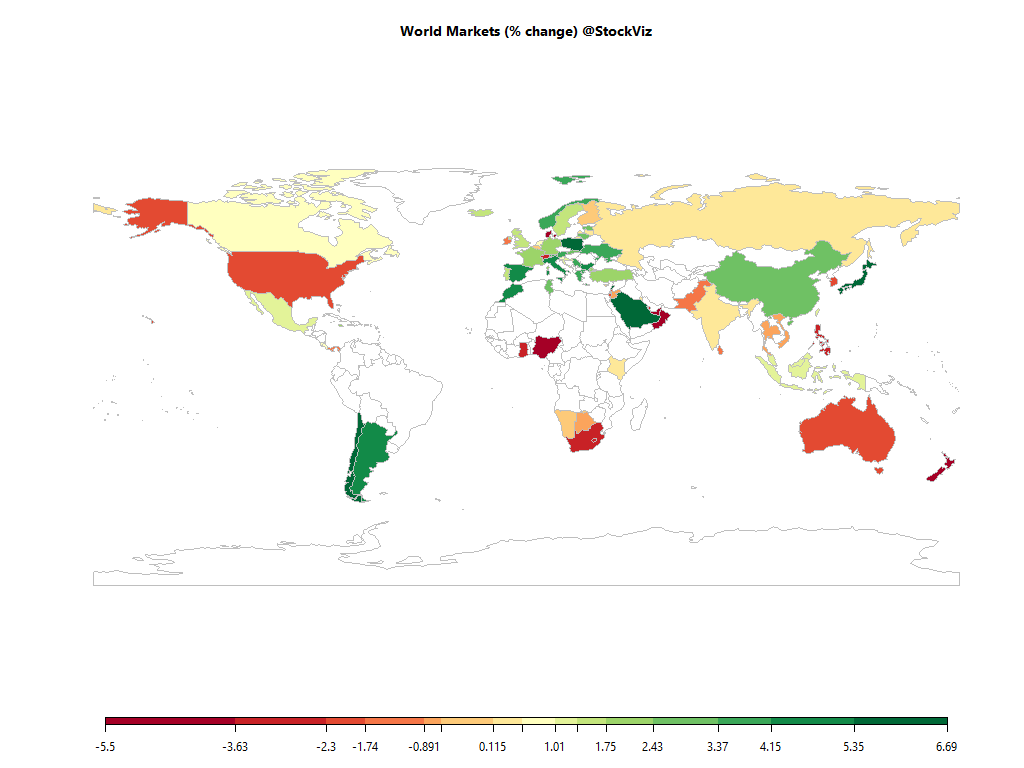
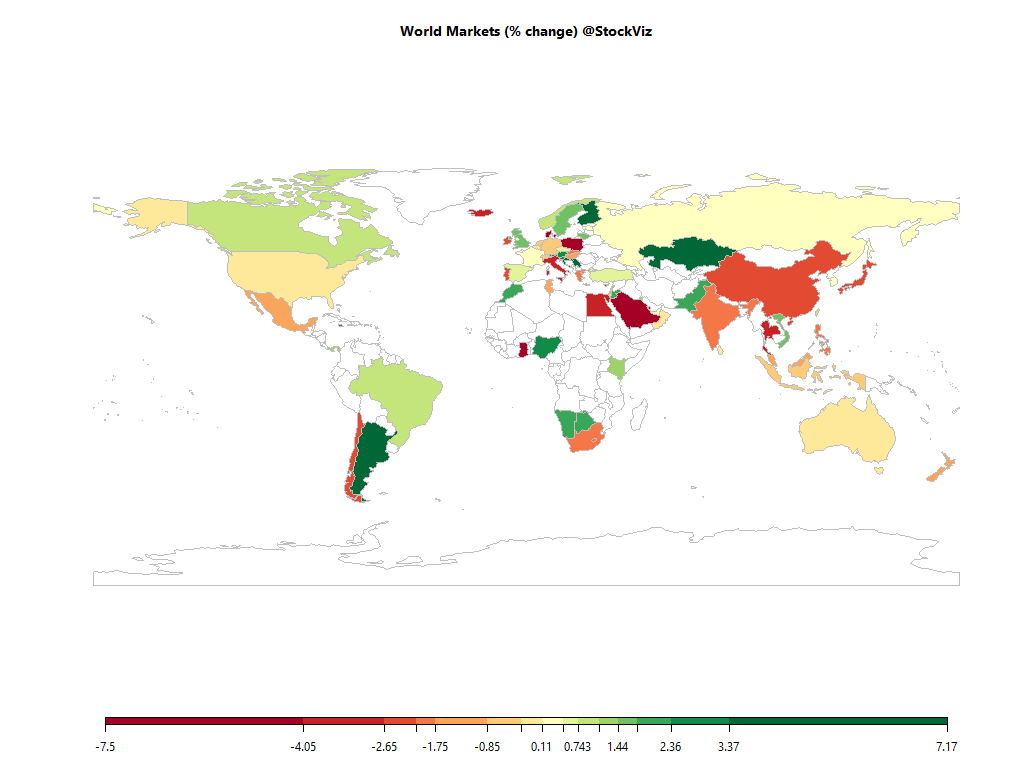
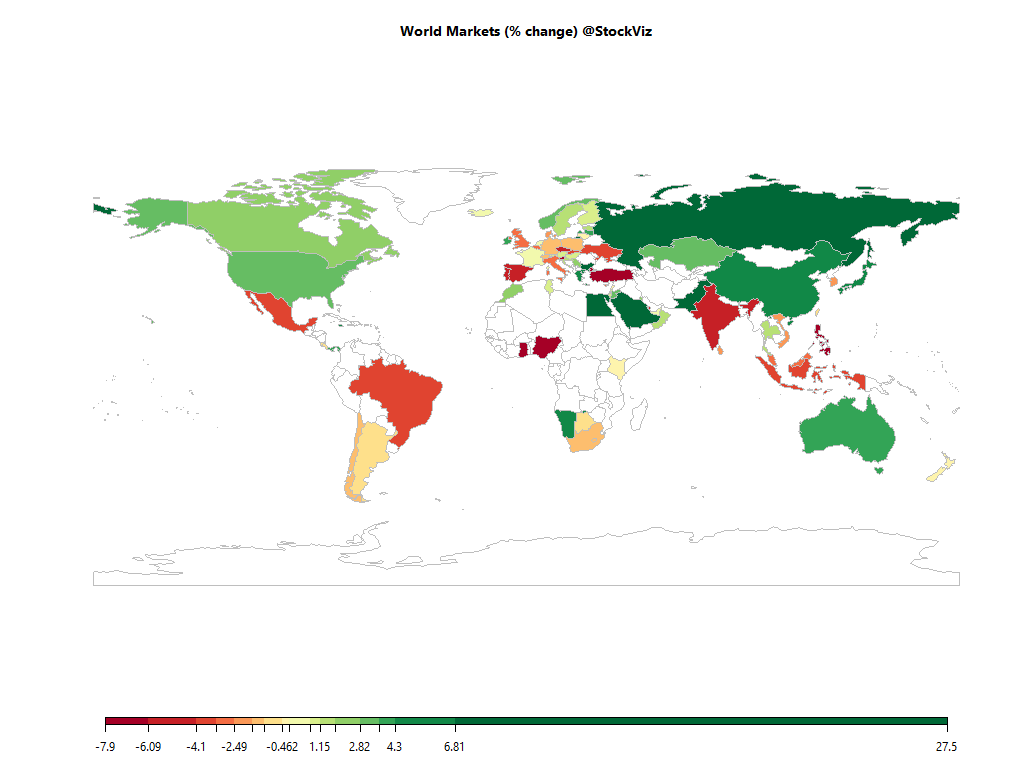
world.2016-04-29.2016-05-31

Equities

Major
DAX(DEU) +1.50%
CAC(FRA) +0.92%
UKX(GBR) -1.16%
NKY(JPN) +1.74%
SPX(USA) +2.15%
MINTs
JCI(IDN) +0.02%
INMEX(MEX) -1.61%
NGSEINDX(NGA) +7.83%
XU030(TUR) -9.43%
BRICS
IBOV(BRA) -9.81%
SHCOMP(CHN) -0.84%
NIFTY(IND) +4.21%
INDEXCF(RUS) -2.70%
TOP40(ZAF) +2.50%

Commodities

Energy
Ethanol +6.67%
Heating Oil +7.38%
Natural Gas +7.49%
Brent Crude Oil +2.90%
RBOB Gasoline +0.68%
WTI Crude Oil +6.55%
Metals
Copper -7.49%
Platinum -8.82%
Silver 5000oz -10.11%
Gold 100oz -5.52%
Palladium -12.65%

Currencies

USDEUR:+2.47% USDJPY:+2.45%

MINTs
USDIDR(IDN) +3.65%
USDMXN(MEX) +7.17%
USDNGN(NGA) +0.00%
USDTRY(TUR) +5.40%
BRICS
USDBRL(BRA) +4.23%
USDCNY(CHN) +1.54%
USDINR(IND) +1.69%
USDRUB(RUS) +3.25%
USDZAR(ZAF) +10.07%
Agricultural
Lean Hogs +3.33%
Lumber +2.78%
Orange Juice +20.00%
Wheat -2.56%
White Sugar +2.88%
Coffee (Robusta) +6.04%
Corn +2.81%
Cotton +0.28%
Soybean Meal +18.55%
Soybeans +5.17%
Cattle -2.34%
Cocoa -3.81%
Coffee (Arabica) +1.70%
Feeder Cattle +5.01%
Sugar #11 +7.46%

Credit Indices

Index Change
Markit CDX EM -0.78%
Markit CDX NA HY -0.24%
Markit CDX NA IG +0.19%
Markit iTraxx Asia ex-Japan IG +0.55%
Markit iTraxx Australia -4.39%
Markit iTraxx Europe -0.16%
Markit iTraxx Europe Crossover +3.18%
Markit iTraxx Japan -4.31%
Markit MCDX (Municipal CDS) -2.00%
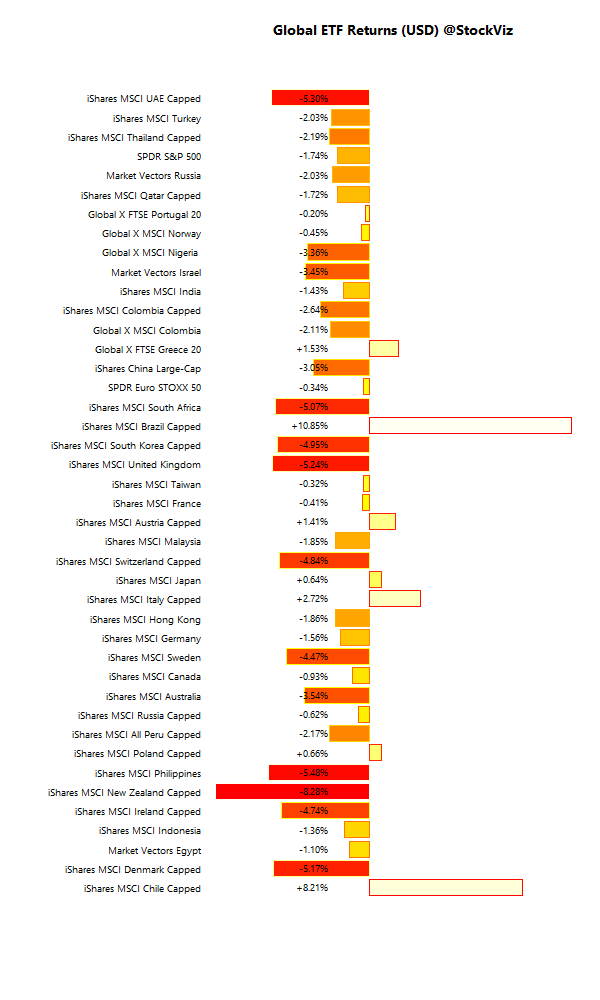
The US Dollar rallied, NIFTY was the best performing equity index…

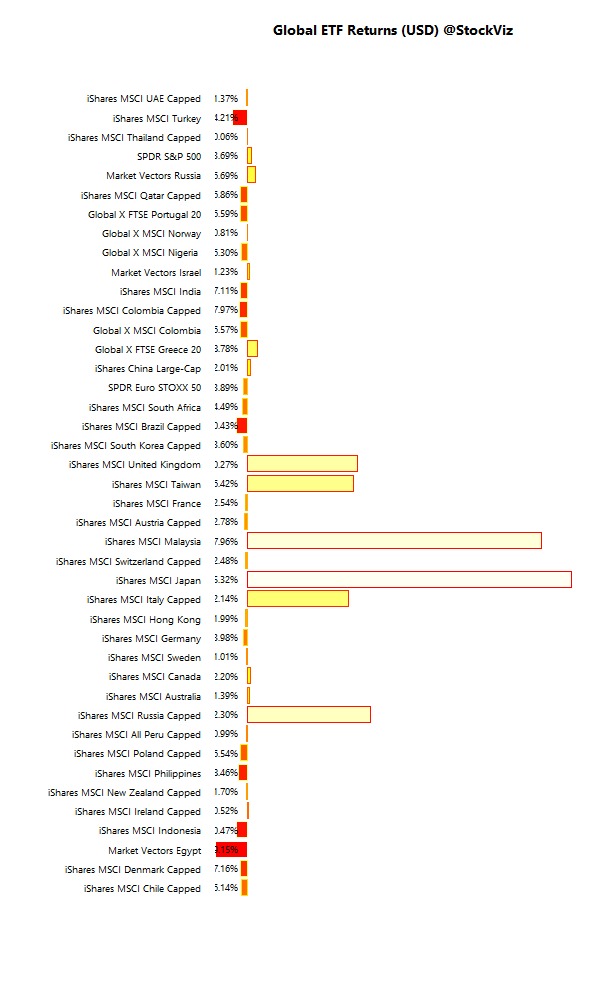
International ETFs (USD)

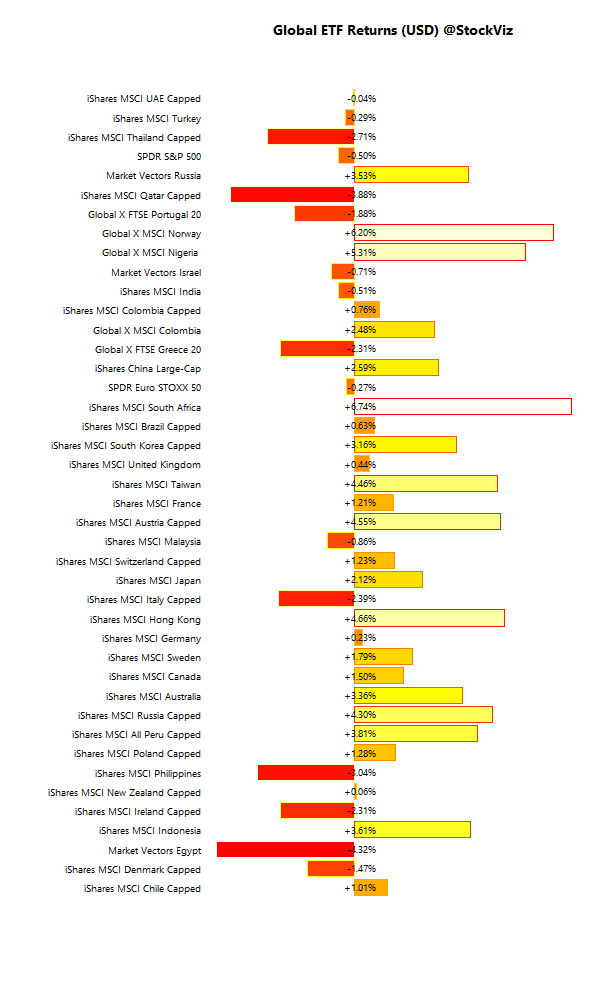
global.etf.performance.2016-04-29.2016-05-31

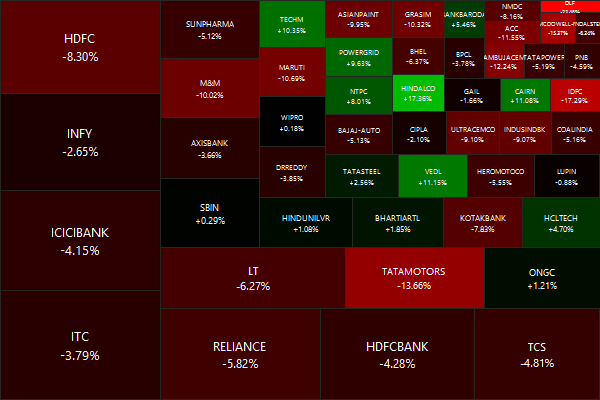
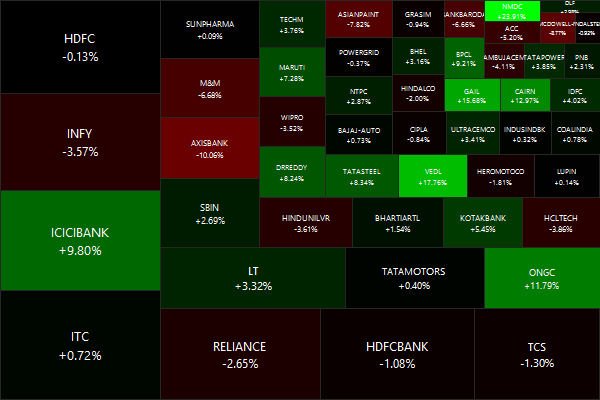
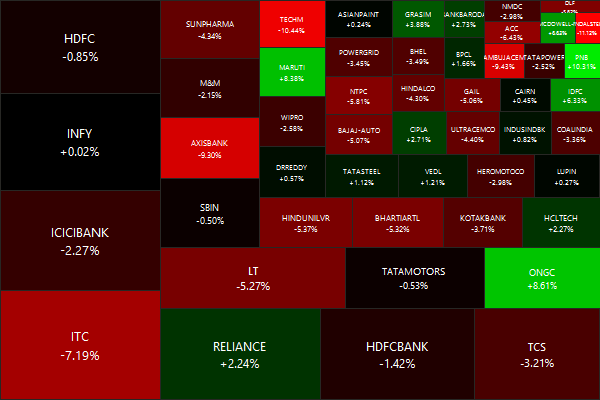
Nifty Heatmap

NIFTY 50.2016-04-29.2016-05-31

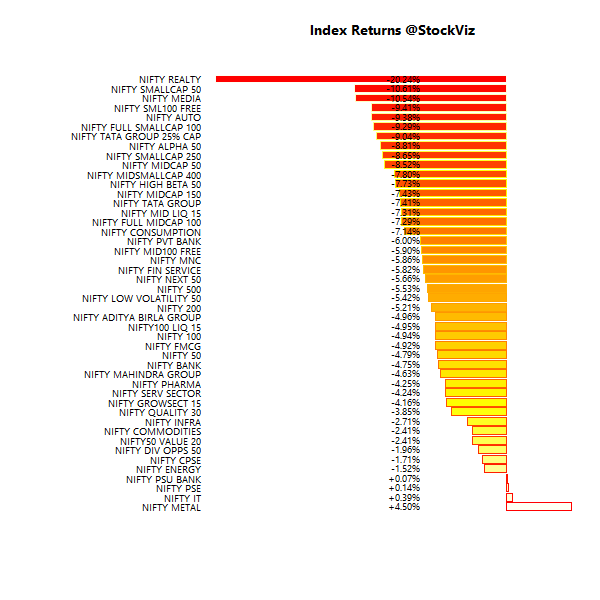
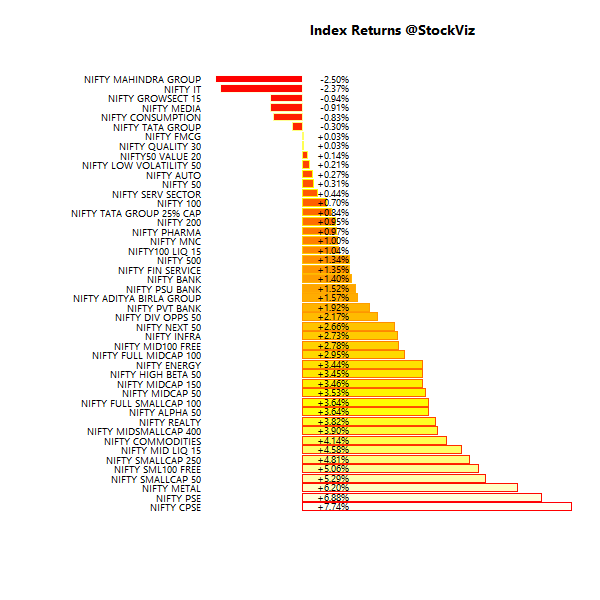
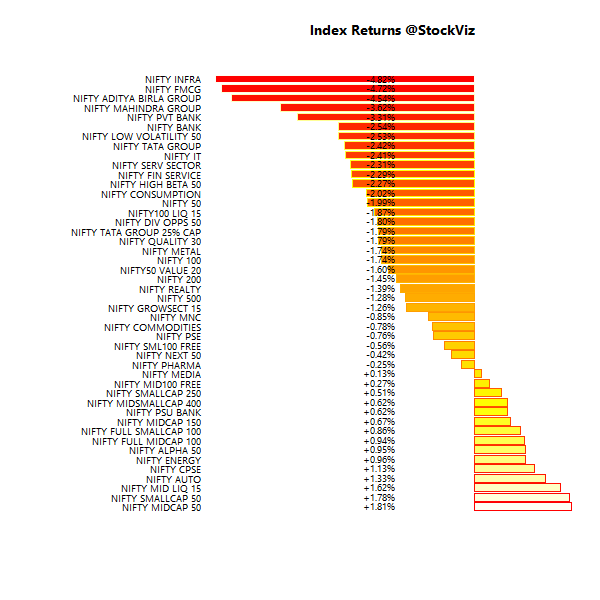
Index Returns

index.performance.2016-04-29.2016-05-31

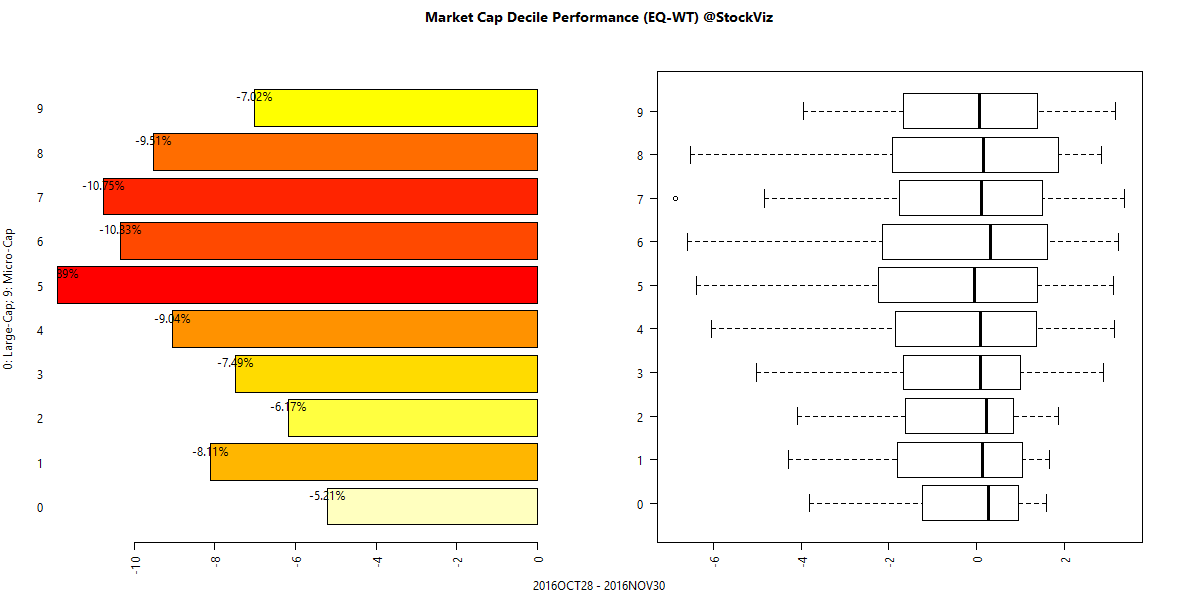
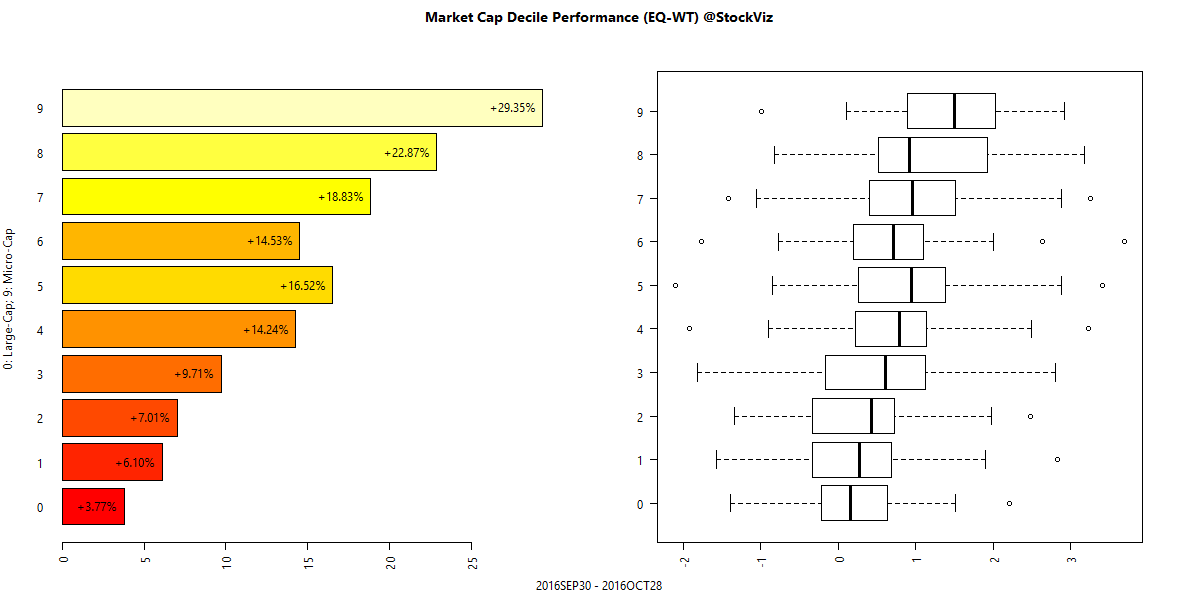
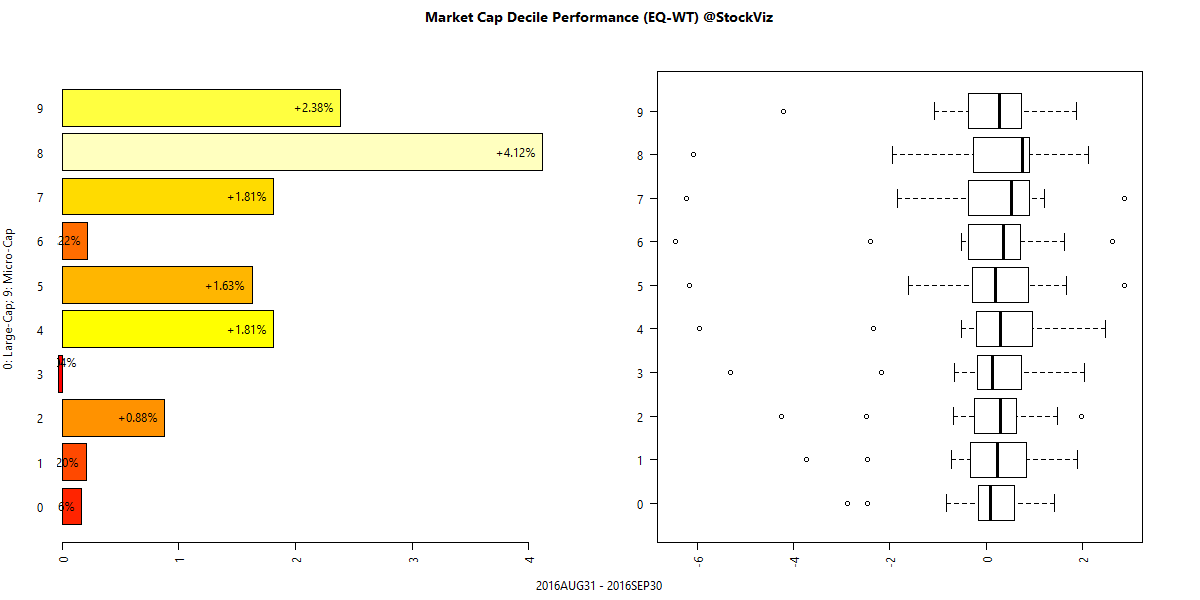
Market Cap Decile Performance

deciles.perf.2016-05-31

Top Winners and Losers

PIDILITIND +17.11%
LT +17.45%
SRTRANSFIN +25.19%
ADANIPORTS -19.33%
RCOM -16.46%
CIPLA -11.98%
Mirroring the performance of sector indices…

ETF Performance

INFRABEES +5.44%
BANKBEES +4.88%
NIFTYBEES +3.96%
JUNIORBEES +2.15%
PSUBNKBEES +0.93%
CPSEETF -1.09%
GOLDBEES -2.63%
Infrastructure caught a bid. But for how long?

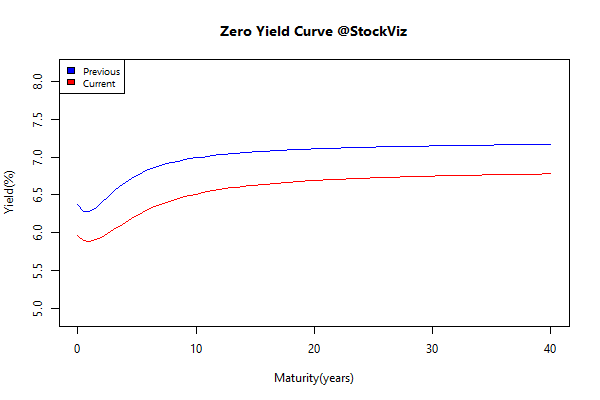
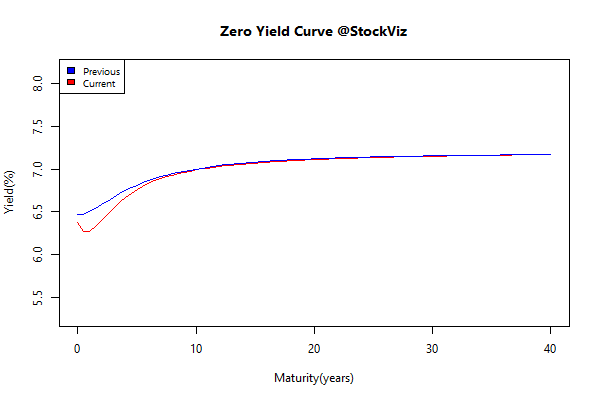
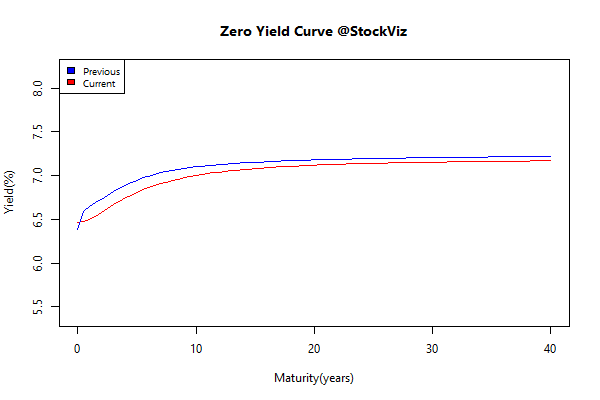
Yield Curve

yieldCurve.2016-04-29.2016-05-31

Bond Indices

Sub Index Change in YTM Total Return(%)
0 5 -0.03 +0.73%
5 10 -0.01 +0.73%
10 15 -0.10 +1.38%
15 20 -0.00 +0.71%
20 30 -0.01 +0.79%
Bonds put in a decent performance…

Investment Theme Performance

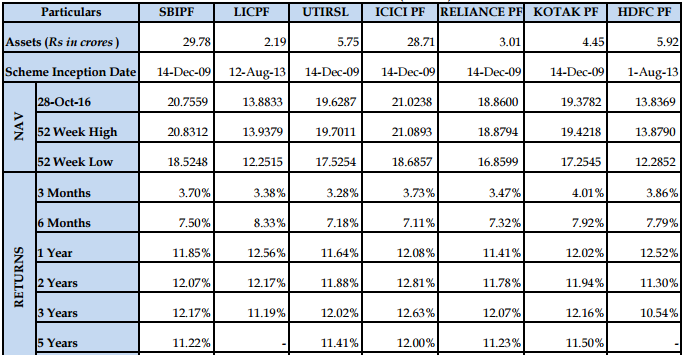
Low Beta/Volatility outperformed momentum…

Equity Mutual Funds

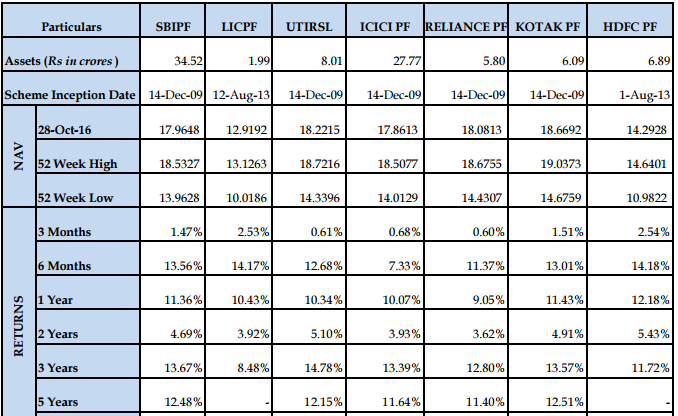
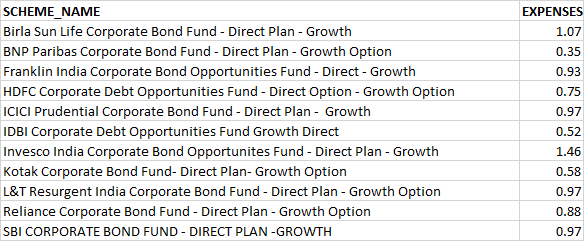
Bond Mutual Funds

Indian bonds are cheap…

ust-ind-10yr-spread.2016-04-29

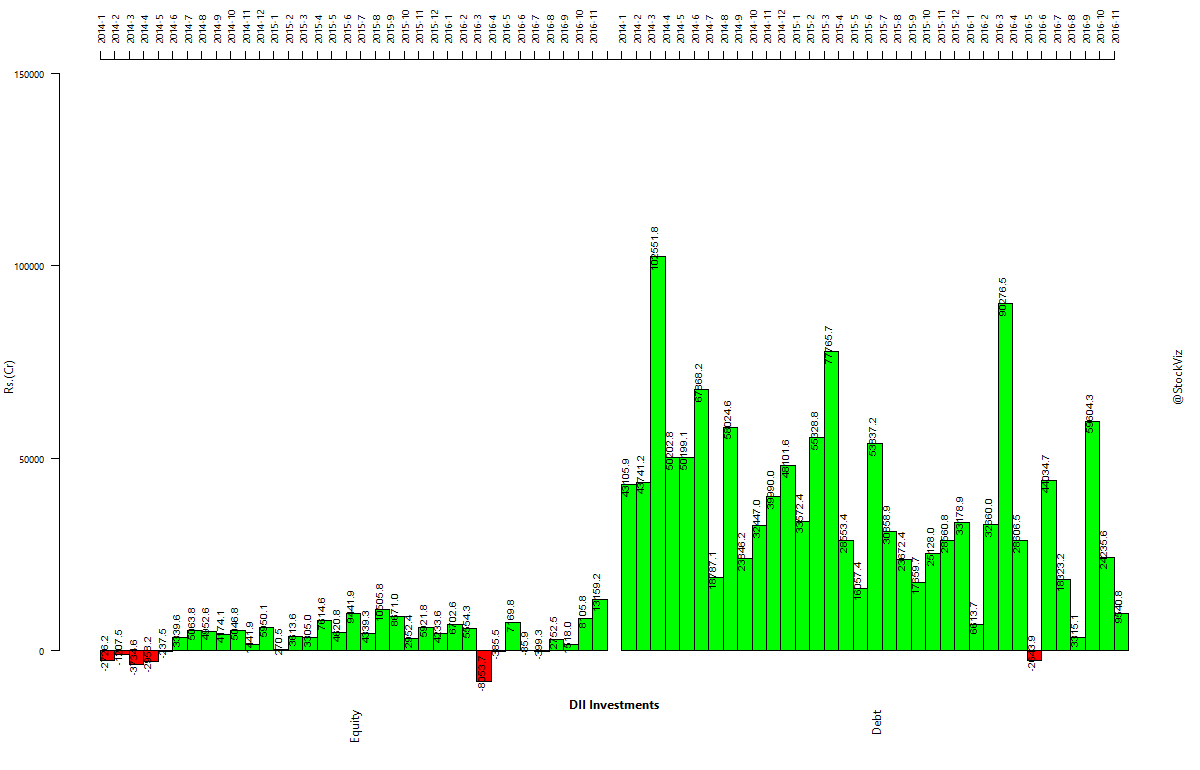
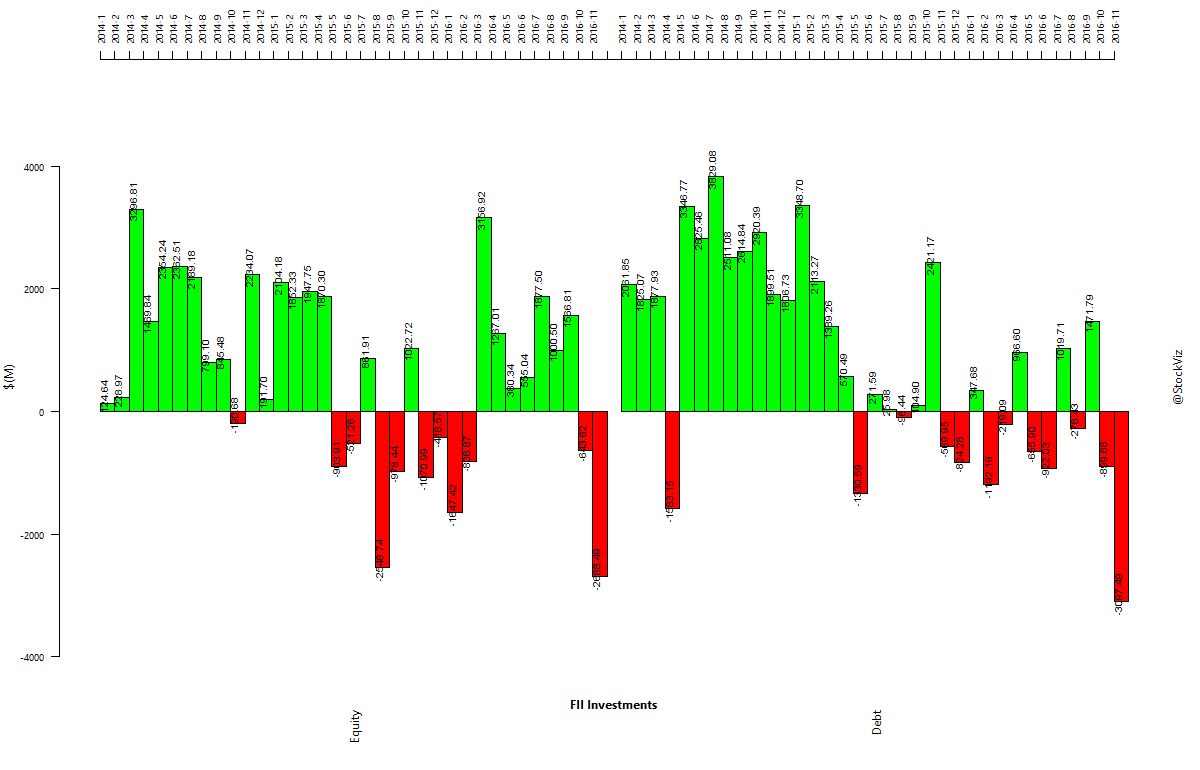
Institutional flows

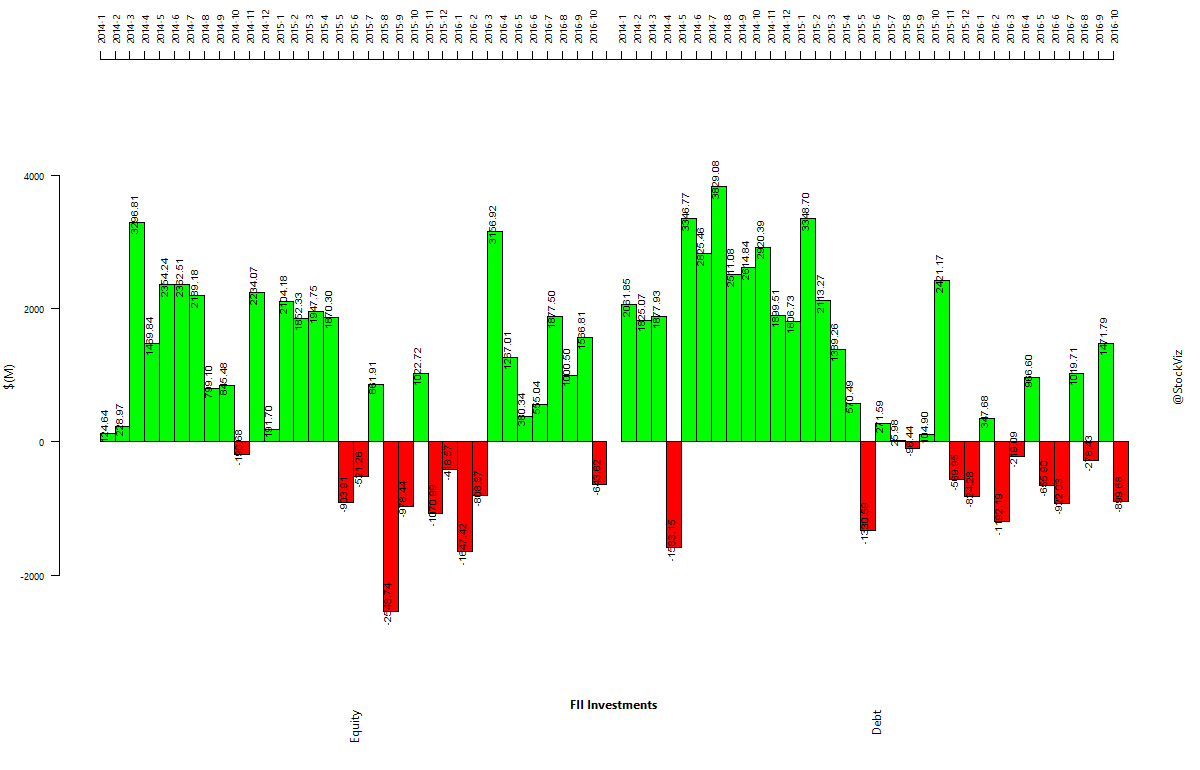
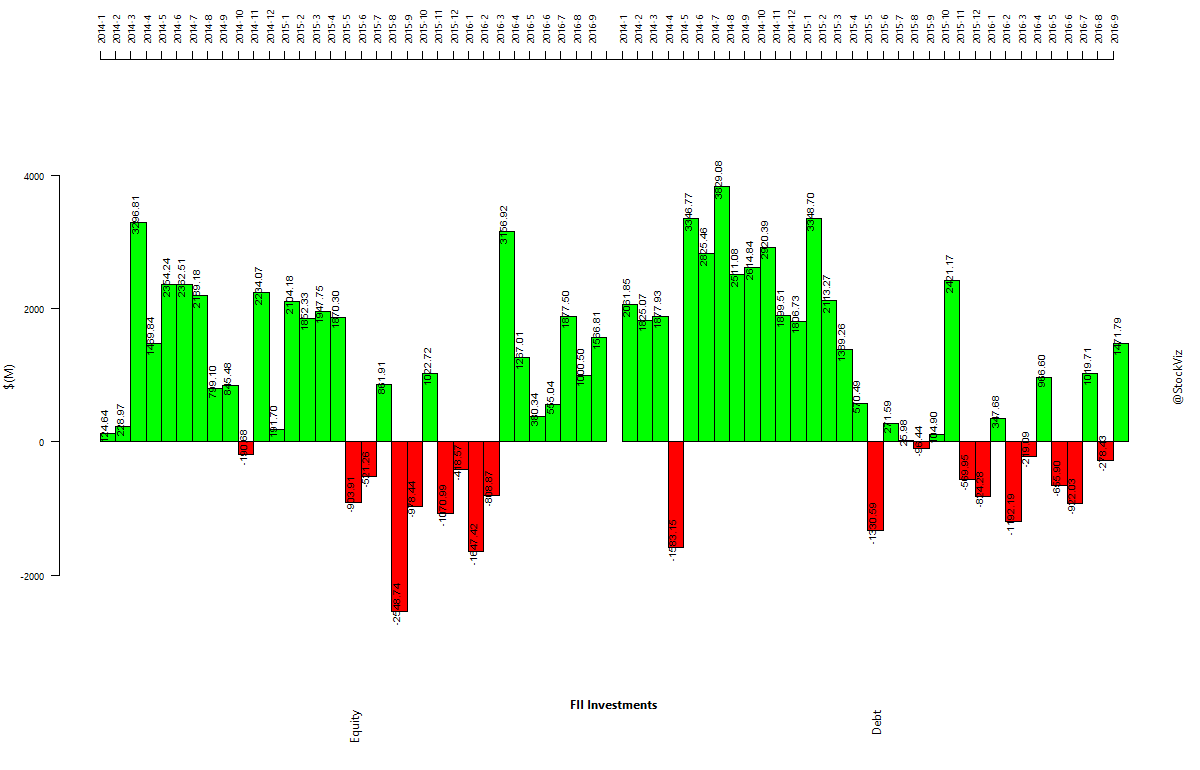
fii-investments.2014-01-01.2016-05-31

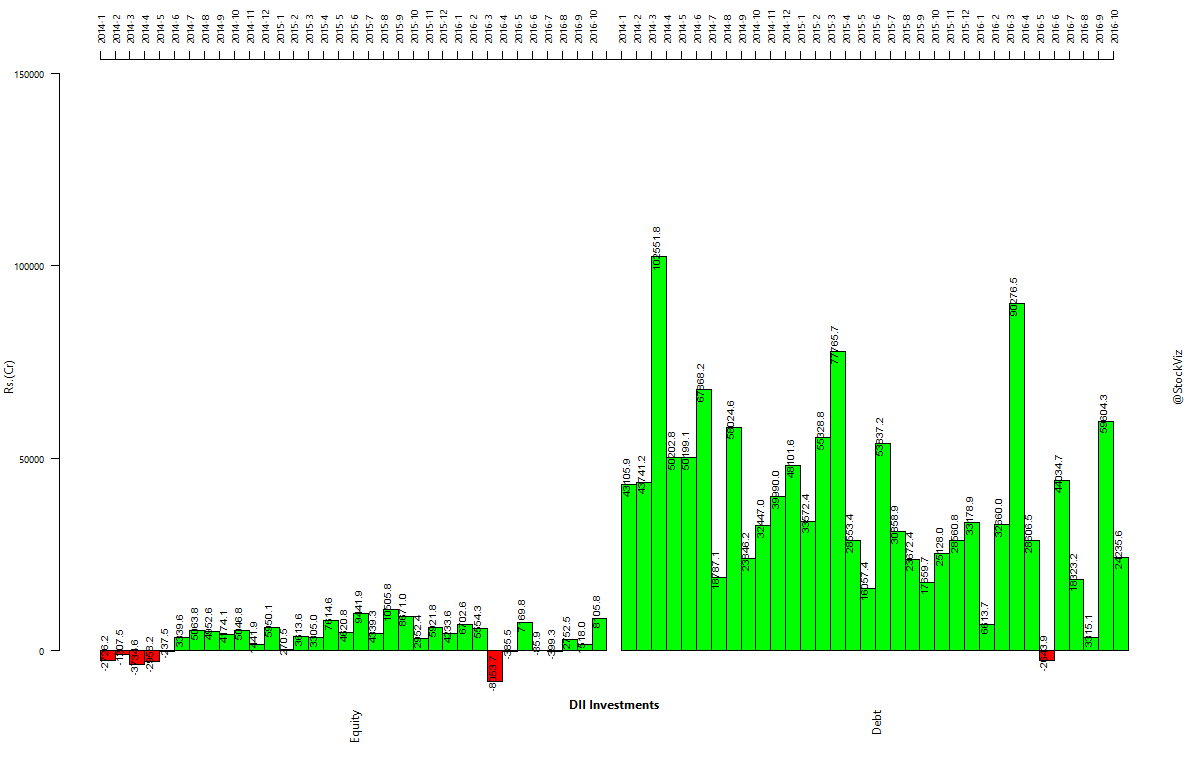
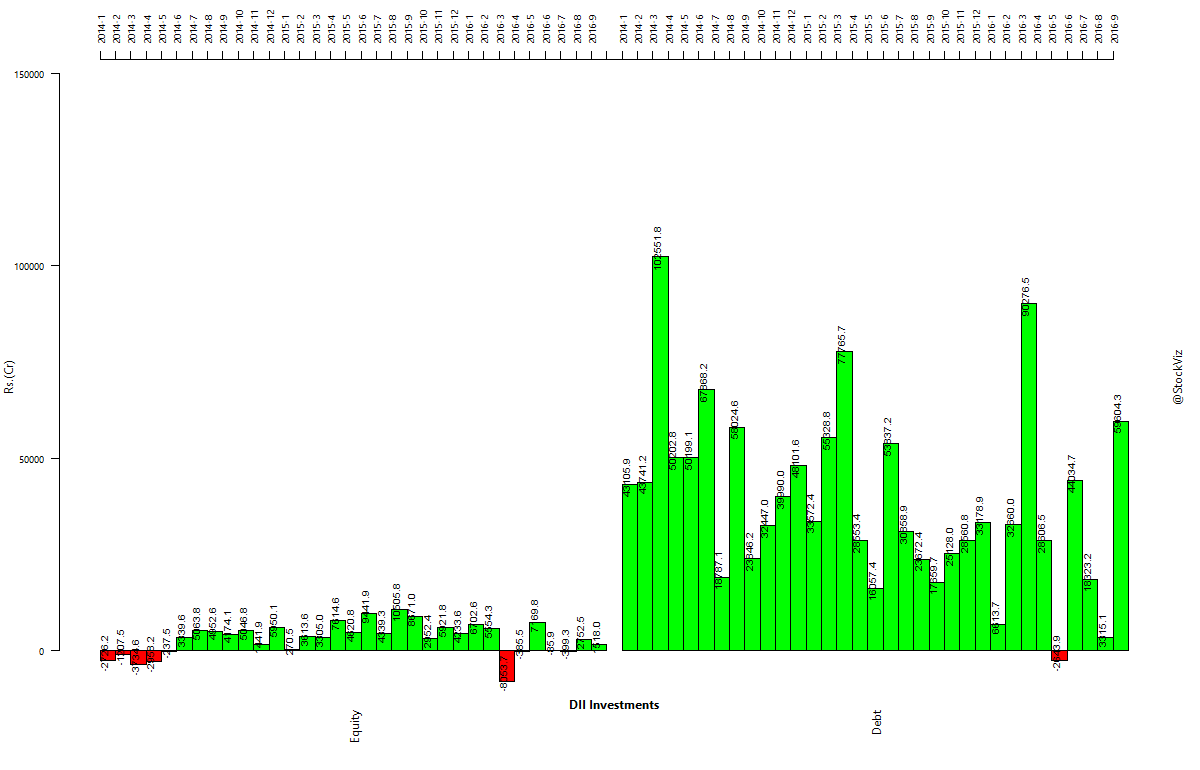
dii-investments.2014-01-01.2016-05-31

Book of the Month

Everything is interpreted through the prism of our own experiences.

The Confidence Game: Why We Fall for It . . . Every Time

The Confidence Game: Why We Fall for It… Every Time by Maria Konnikova (Amazon)

Trading Day of Month Returns

An analysis of daily returns of the NIFTY 50 index between 1998 and 2015 shows that:

  1. The first few and the last few trading days of a month are the best days to be long.
  2. Middle of the month returns are more volatile and, on an average, negative.
  3. Cumulative returns of a strategy that is long on the first 5 and the last 5 days of the month and short the others is 1,112.154% vs. 636.1821% of a buy and hold strategy.

day-of-month

Further reading: An Anatomy of Calendar Effects (SSRN)

A Brief Note on Monte Carlo

When we back-test a strategy against the historical prices of an instrument, say, the NIFTY 50 index, we have to keep in mind that historical values are just one path of the many paths that the instrument could have taken.

For example, 10 tosses of a fair coin can result in TTTTTFFFFF and TFTFTFTFTF with equal probability. If your strategy is path dependent (as most strategies are,) then just because it was successful in one trial (historical prices) doesn’t mean that it would have been successful in all (or majority) of them.

The simple thing to do after a successful back-test against historical prices is to run a Monte Carlo simulation to check if the strategy comes out ahead in most of them. This can be setup by assuming returns are normally distributed and running a simulation using the mean and standard deviation of the sample.

For instance, in the recent past, daily NIFTY 50 returns have exhibited a mean of -0.0003742873 and std. dev. of 0.01079387. When you run a simulation and plot the results over the actual closing prices of the index, you get the resulting chart:

monte-carlo.NIFTY

How many of these paths will result in a total equity wipeout of the back-tested strategy?

Monthly Recap: April Angst

world.2016-03-31.2016-04-29

Equities

Major
DAX(DEU) +0.74%
CAC(FRA) +1.00%
UKX(GBR) +1.08%
NKY(JPN) -0.55%
SPX(USA) +0.22%
MINTs
JCI(IDN) -0.14%
INMEX(MEX) +0.12%
NGSEINDX(NGA) -0.96%
XU030(TUR) +2.39%
BRICS
IBOV(BRA) +7.81%
SHCOMP(CHN) -2.18%
NIFTY(IND) +1.44%
INDEXCF(RUS) +4.38%
TOP40(ZAF) +0.72%

Commodities

Energy
Natural Gas +9.63%
Brent Crude Oil +19.35%
WTI Crude Oil +18.78%
Ethanol +7.67%
Heating Oil +16.52%
RBOB Gasoline +12.21%
Metals
Gold 100oz +4.91%
Silver 5000oz +16.23%
Palladium +9.91%
Copper +3.65%
Platinum +10.43%

Currencies

USDEUR:-0.56% USDJPY:-5.32%

MINTs
USDIDR(IDN) -0.45%
USDMXN(MEX) -0.99%
USDNGN(NGA) -0.03%
USDTRY(TUR) -0.91%
BRICS
USDBRL(BRA) -4.40%
USDCNY(CHN) +0.38%
USDINR(IND) +0.12%
USDRUB(RUS) -3.34%
USDZAR(ZAF) -3.57%
Agricultural
Cattle -13.57%
Lean Hogs +14.21%
Soybean Meal +22.41%
Feeder Cattle -10.82%
Wheat +1.48%
Coffee (Arabica) -5.56%
Coffee (Robusta) +5.78%
Corn +11.55%
Cotton +8.51%
Lumber -5.54%
Orange Juice -12.86%
Soybeans +12.23%
Sugar #11 +6.16%
Cocoa +7.24%
White Sugar +5.30%

Credit Indices

Index Change
Markit CDX EM +0.60%
Markit CDX NA HY +0.89%
Markit CDX NA IG -4.40%
Markit iTraxx Asia ex-Japan IG -6.15%
Markit iTraxx Australia -9.74%
Markit iTraxx Europe -1.61%
Markit iTraxx Europe Crossover -9.50%
Markit iTraxx Japan -21.20%
Markit MCDX (Municipal CDS) +0.33%
An eventful month with the RBI cutting rates, ICICI dropping a bomb, BOJ holding off on more QE and oil recovering…

International ETFs (USD)

global.etf.performance.2016-03-31.2016-04-29

Nifty Heatmap

NIFTY 50.2016-03-31.2016-04-29

Index Returns

index.performance.2016-03-31.2016-04-29

Market Cap Decile Performance

deciles.perf.2016-04-29

Top Winners and Losers

UPL +12.60%
DLF +12.85%
VEDL +15.53%
NHPC -14.49%
BHARATFORG -8.59%
UBL -7.88%
High beta stocks rebounded from Jan/Feb lows…

ETF Performance

GOLDBEES +5.98%
BANKBEES +3.70%
JUNIORBEES +3.05%
INFRABEES +2.94%
CPSEETF +2.69%
PSUBNKBEES +1.03%
NIFTYBEES +0.49%
Is infra the next story?

Yield Curve

yieldCurve.2016-03-31.2016-04-29

Bond Indices

Sub Index Change in YTM Total Return(%)
0 5 -0.05 +0.77%
5 10 -0.06 +0.92%
10 15 -0.04 +0.94%
15 20 -0.12 +1.75%
20 30 -0.08 +1.50%
Bonds rebounded…

Investment Theme Performance

Midcap recovery under way…

Equity Mutual Funds

Bond Mutual Funds

Institutional flows

FII’s seen renewing their love affair with Indian bonds…

fii-investments.2014-01-01.2016-04-29

dii-investments.2014-01-01.2016-04-29

US Treasuries

Gilts are in the process of normalizing.
ust-ind-10yr-spread.2014-01-01

Is spread between 2s and 10s calling a bluff on a Fed rate hike?

ust-yield-curve.2s10s

Thought to sum up the month

Chance plays a far larger role in life outcomes than most people realize. And yet, the luckiest among us appear especially unlikely to appreciate our good fortune. Wealthy people overwhelmingly attribute their own success to hard work rather than to factors like luck or being in the right place at the right time.

That’s troubling, because seeing ourselves as self-made—rather than as talented, hardworking, and lucky—leads us to be less generous and public-spirited. It may even make the lucky less likely to support the conditions (such as high-quality public infrastructure and education) that made their own success possible.

Source: Why Luck Matters More Than You Might Think

What I read this month

What I Learned Losing a Million Dollars:
_20160501_111546

Amazon