A wise man once said, the decision to go passive is a very active one.
At first, going passive meant buying and holding a broad-based index fund. But that was over 40 years ago. Since then, in the US, the market has evolved and the number of indices, index funds and ETFs have exploded. Think of a theme, strategy, asset class, market or geography, there is an ETF for that.
As of today, there are 2,319 ETFs in the US. And given the intense competition over the last decade, fees have been driven to single-digit basis-points in most cases. Given this fee pressure, US based issuers looked east and landed on Europe a couple of years ago. And there too, competition quickly reduced fees and expanded access.
The next big virgin market is India.
Given this back drop and the small but increasing interest in passive indexing, if a DIY investor wishes to just buy and hold a market-cap based index, which one should she buy?
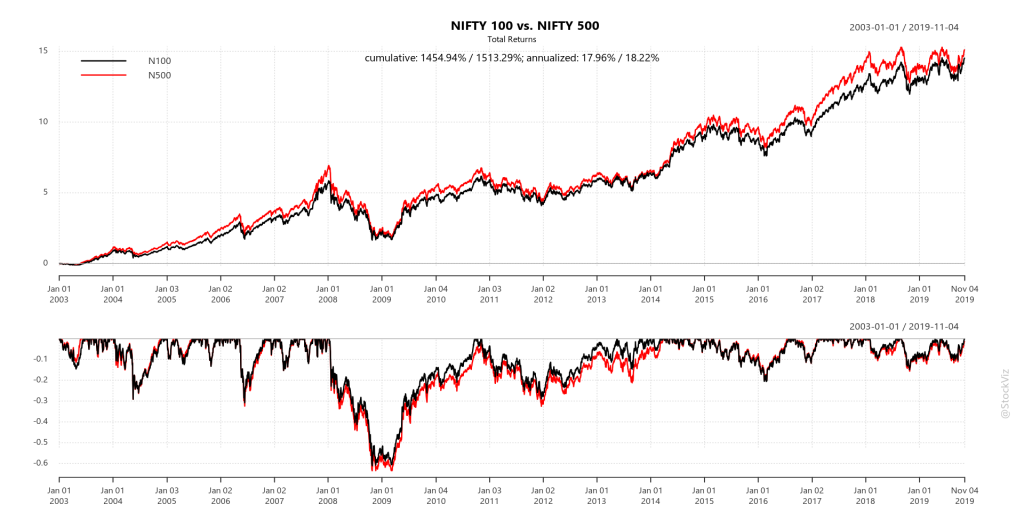
The most practical choices boil down to NIFTY 50, NIFTY NEXT 50 (collectively forming the NIFTY 100) and the NIFTY 500 indices.
Given the fee differentials between the NIFTY 100 and NIFTY 500 based ETFs/funds, the big question to ask is: Is there any advantage of reaching below the 100 mark? Is 100 enough?
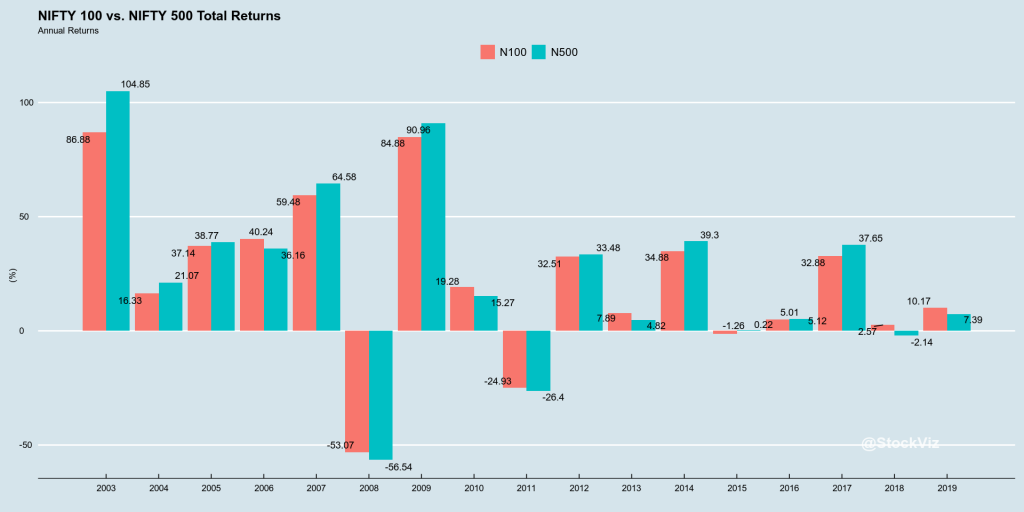
Market-caps follow a power-law. For NIFTY 100, 80% of the index is covered by the top 35 stocks and for NIFTY 500, the number is 82. So unless the rest of the stocks in the index deviate to an extreme degree in terms of total returns (change in price + dividends,) the top 35/80 stocks power most of the returns.
Cumulative ReturnsAnnual Returns
So, the answer is No. Unless NIFTY 500 based ETFs/funds achieve fee and liquidity parity with the NIFTY 100 based ones, investors are not missing out on anything by sticking with the mega-caps.
Check out the goodies on pluto. Questions? Slack me!
There are a number of ways in which you can allocate funds (weigh) the stocks in your portfolio. The simplest of them are equal-weight and market-cap weight.
In an equal-weight portfolio, all stocks get the same allocation. If you have 20 stocks, then each stock would have a 5% weight in the portfolio. So the WAVG capitalization of these portfolios end up skewing towards mid/small caps within the portfolio.
In a cap-weight portfolio, each stock gets an allocation based on its market-capitalization. So large-cap stocks get a large weight and smaller-cap stocks get a smaller weight.
The advantage of a cap-weight portfolio is that unless you want to change the constituents, you don’t have to do anything. The individual weights will be always tracking their corresponding market-caps. But in an equal-weight portfolio, you need to rebalance once a month/quarter to bring back all the constituents to their original weights. You will be selling your winners to add to your losers.
Needless to say, the all-in cost of maintaining an equal-weight portfolio will be more than that of a cap-weigh portfolio. Is it worth it?
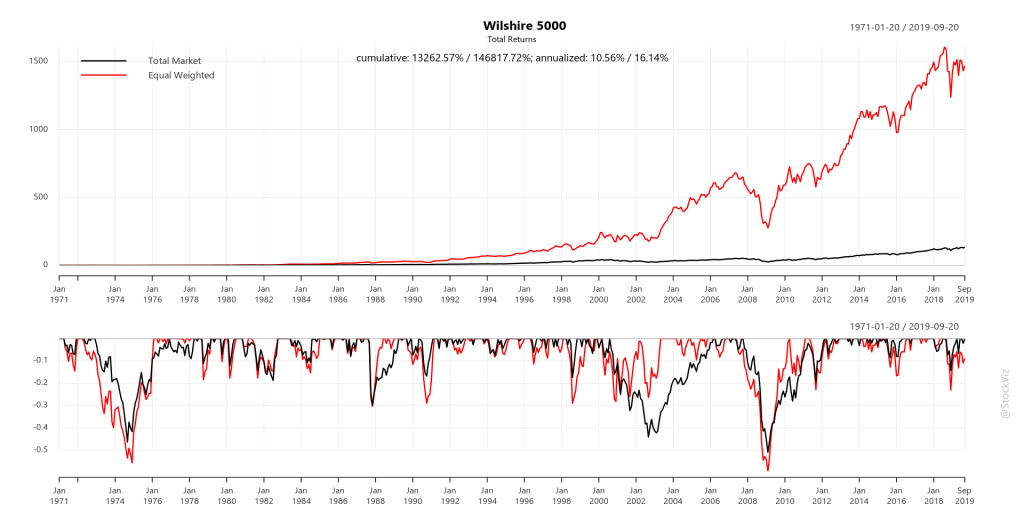
The American Experience
For the US markets, lucky for us, Wilshire Indices has index data covering both the market-cap and equal-weight versions of the same portfolio starting from 1970. And the over-all out-performance of the equal-weight portfolio looks spectacular.
Cap-weight vs. Equal-weight
Whenever you see out-performance like this, you have to keep in mind that it is usually a combination of investor behavior and investment risk.
The reason why an investment strategy out-performs could be because it is prone to long draw-downs followed by large, but short-lived, upswings. Investors flood into the strategy during the upswing, only to exit during the soul-crushing drawdown. Happens in value and momentum investing a lot.
The second reason why something works is because of higher volatility. Stocks are more volatile than bonds so over a long enough period of time, they out-perform them.
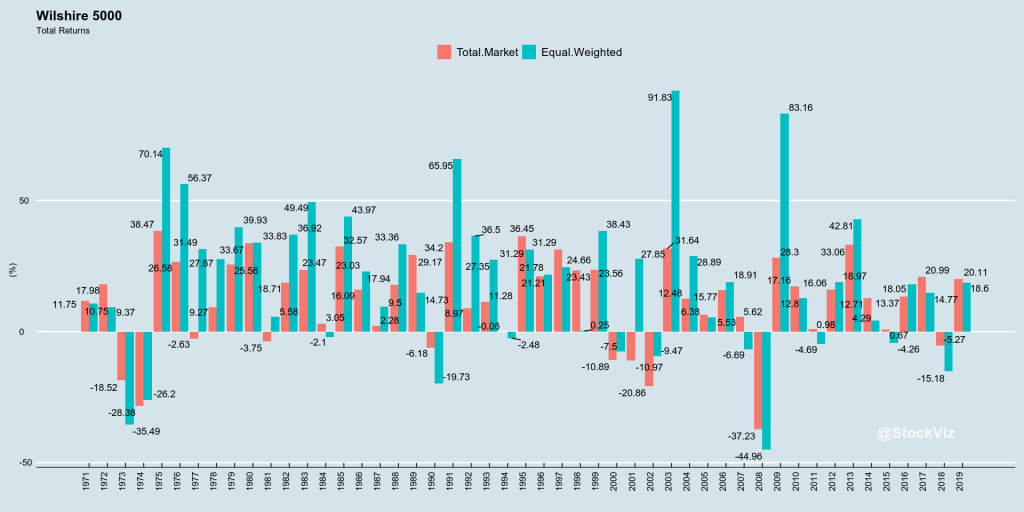
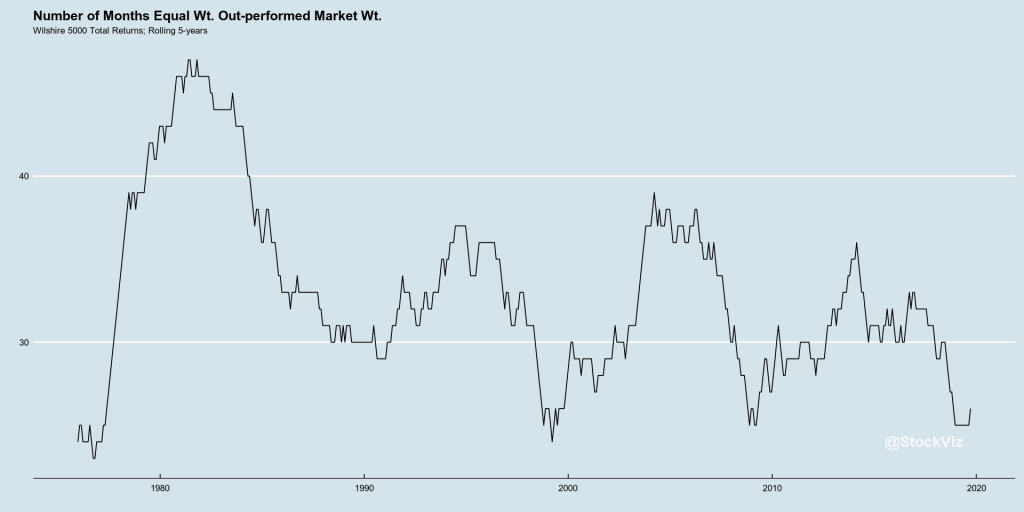
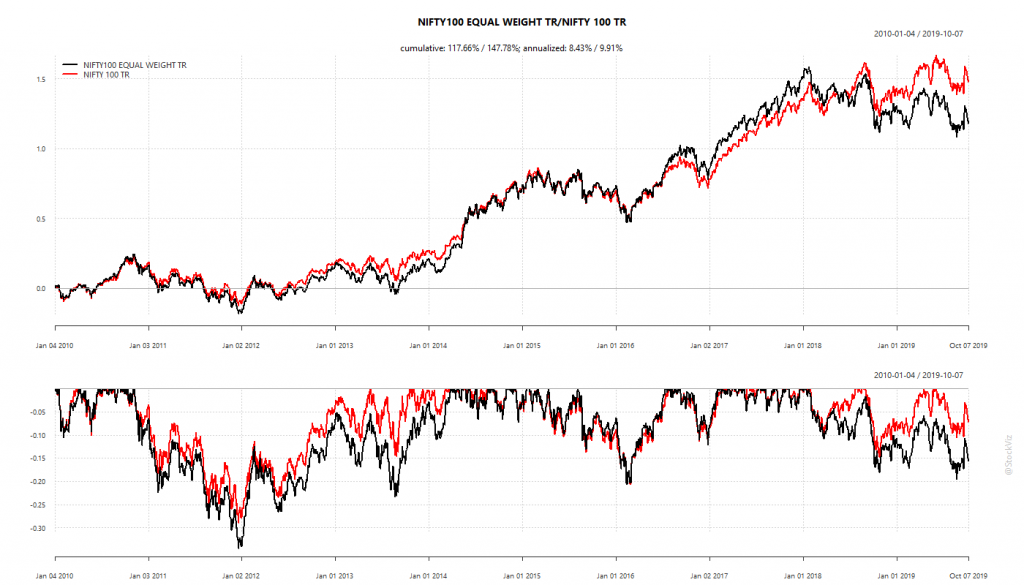
To visualize if investor behavior is driving out-performance, you can look for the swings in annual returns and periods for which the strategy under-performs its benchmark.
Large swings imply difficulty of staying investedLong periods of under-performance imply difficulty of staying invested
The equal-weighted index also has a larger standard-deviation (a measure of volatility) ~6% compared to ~4.4% of the market-cap index.
In short, equal-weighted portfolios are more volatile and there are significant periods where they under-perform their cap-weighted cousins in the short-term. This results in a larger probability of adverse investor behavior, partly explaining the out-performance over a longer period of time.
However, we don’t live in the 70’s anymore. The market structure has evolved. Costs have come down drastically and more investors are aware of the equal-weight strategy. If you think liquidity is thin in small-cap stocks today, it was impossible to trade them 20 years ago unless your uncle ran a brokerage firm. So some of the earlier-period excess returns are only theoretical – you could not implement this strategy even if you knew about it.
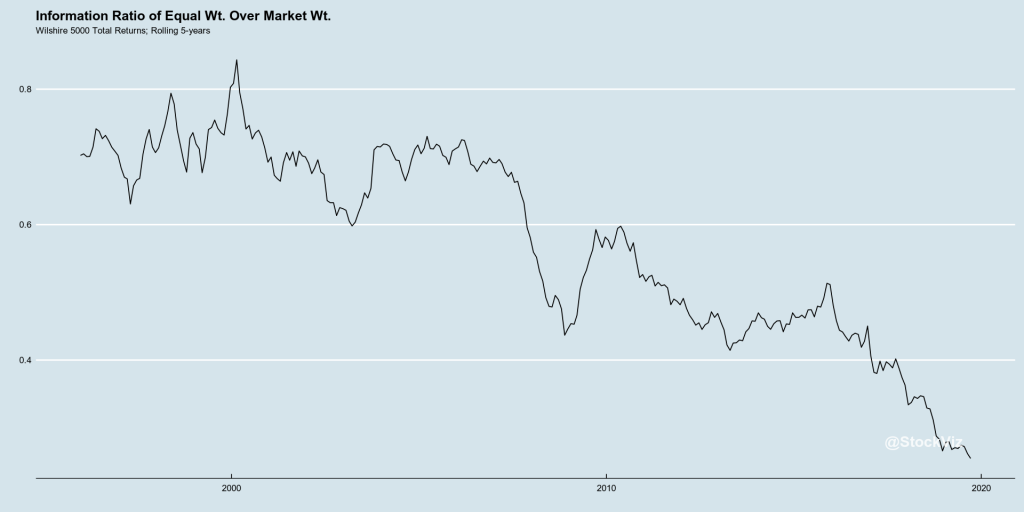
So, is it still a free-lunch? One way to visualize this is to plot the Information Ratio of the equal-weight returns over that of market-cap returns.
No longer a free lunch!
Equal-weight, as a strategy, has been losing its mojo and maybe, its best days are behind it. Excess returns could be entirely explained by higher risk.
The Indian Experience
It maybe too early for a large commitment to equal-weight portfolios in India.
First, India has a Securities Transaction Tax of 0.1% on the total notional amount traded. So, a market-cap weight portfolio that is rebalanced twice a year will have a far lower cost than an equal-weight portfolio that is rebalanced every month.
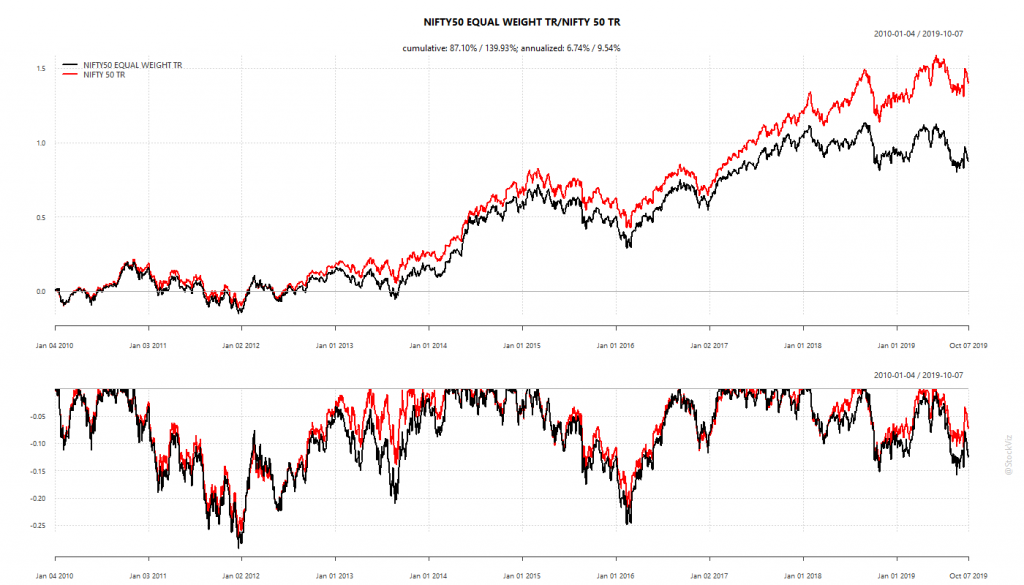
Second, there is no liquidity beyond the top 70-100 names by market-cap. So one cannot create an equal-weight version of the NIFTY 500 index. An equal-weighted NIFTY 50 is probably the only version that makes sense if you want to reduce impact costs. NIFTY 100 is the second-best option.
If you go with NIFTY 50, an equal weight portfolio of 50 stocks means than each stock has a 2% weight. Since you are constantly selling winners and buying losers, low dispersion in returns between their returns will have a big impact on the relative performance of the equal-weighted portfolio over its cap-weighted cousin.
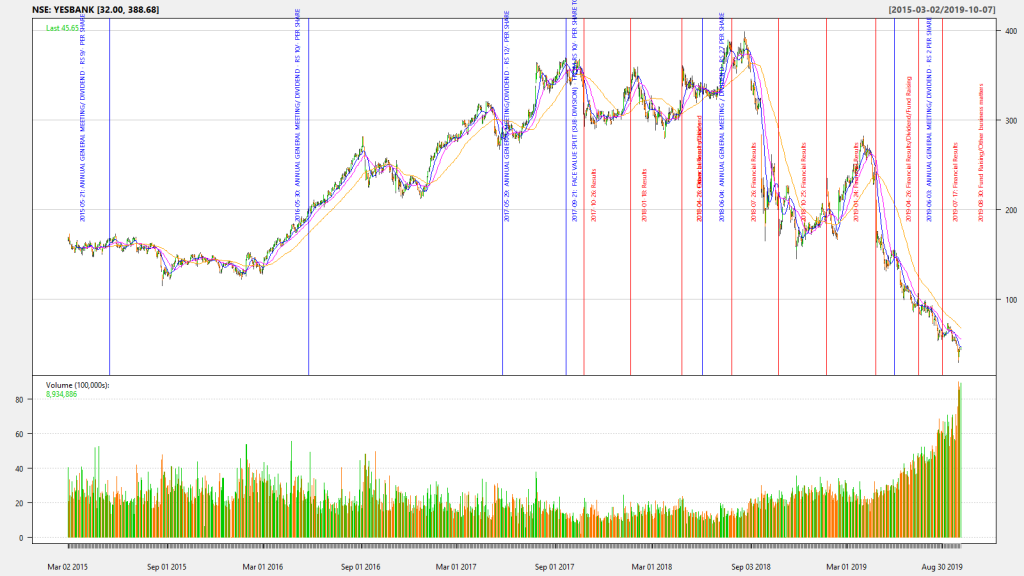
For example, YESBANK, at its peak, had a 1.74% weightage in the NIFTY 50. And its recent troubles have brought it down to about 0.18%. In the equal-weighted NIFTY 50, this would have been a constant 2% through-out. Not exactly participating fully in the up-side but doubling down on the down-side.
Price chart of YESBANK since it was added to NIFTY 50 in March 2015
YESBANK wouldn’t have been a big problem if we were equal-weighting the NIFTY 500. But it is a problem with NIFTY 50.
We consider long-only momentum returns to be composed of market returns plus excess returns.
If excess returns over a specified period, n-days, (say, 5- or 10-days) either trends or mean-reverts, then that can be used to trade the momentum portfolio.
One way to check if a time-series is trending is to calculate the Hurst exponent (H) over a rolling window (say, 5-years) of n-day excess returns . If H < 0.5, then the time-series is mean-reverting; if H > 0.5, then it is trending, else it is random.
A simple strategy would be, for H < 0.5 (mean-reverting), if excess returns is greater than its median, then exit or if excess returns is less than its median, then enter.
The problem boils down to specifying the excess-return calculation periods (n-days) and the Hurst exponent rolling windows so that it makes sense (avoid data-mining.)
Setup
We use the Barclays Euro-zone, UK, Japan and US momentum index data-sets to run our experiment. Since they provide both an excess-return index and a total-return index, we can use the former to time entries and exits in the latter.
We ran for two n-day configurations: 5 and 10. We set the Hurst (and median) rolling window at 5-years.
We expected to find H to be either consistently above or below 0.5. My personal expectation was that H would be above 0.5 (trend.)
Results
Using the Hurst exponent did not improve momentum returns. In both 5-day and 10-day configurations, a strategy that went long if n-day returns were less than their median out-performed those that incorporated H.
The back-test using 5-day returns mostly worked on Euro-zone and US momentum indices. So we are skeptical that this approach can be generalized and it will likely fall prey to data-mining.
The back-test using 10-day returns saw buy-and-hold emerge a consistent winner.
The 5-dayH toggled between trending and mean-reverting but spent most of its time trending. The 10-dayH was consistently trending. For the specifications that we tested, momentum excess returns trends.
Code and Charts
The R code is here: 5-day and 10-day config. You can login to pluto and play around with the lookback and statWindow variables to see how H, median and back-test results change.
The biggest bet that buy and hold investors of a given country are making is that their government stays committed to increase, preserve and protect their citizen’s wealth. It is a combination of regulation, property rights, human capital, investor sentiment and global capital flows.
Buy and hold worked out great for US investors in the last 30-years. Inflation was mostly under control and they enjoyed a dollarized world with the rest of the world sending their surpluses to the US. But It wasn’t always like this.
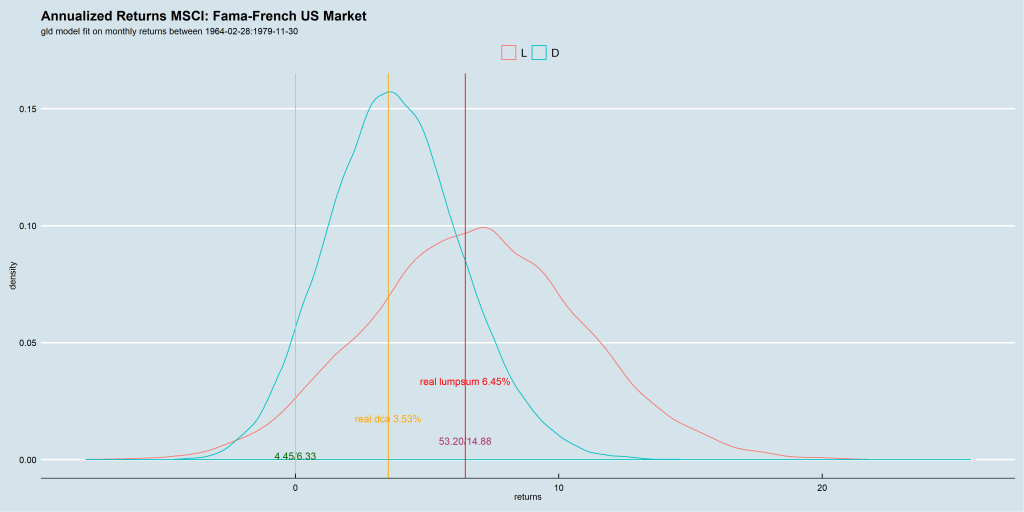
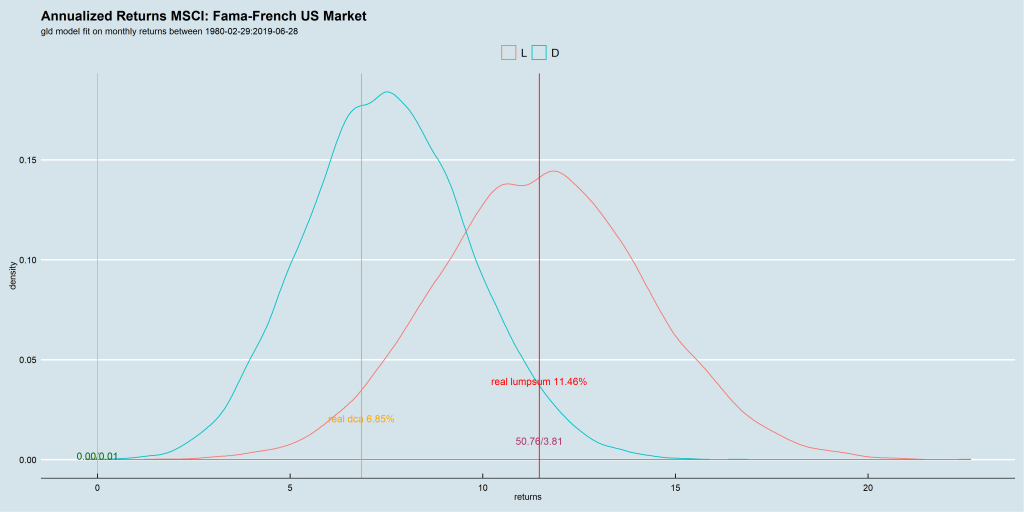
The year 1980 was a turning point for US bonds and equities. Not that there weren’t hiccups along the way – Black Friday, tech bust, GFC, etc – but it was the beginning of a huge tail-wind that continues to blow even today. Compare the simulation results of pre-1980 equity returns vs. what came next:
Pre-1980: 5% possibility of loss in a buy-and-hold portfolioPost-1980: 0% possibility of loss in a buy-and-hold portfolio
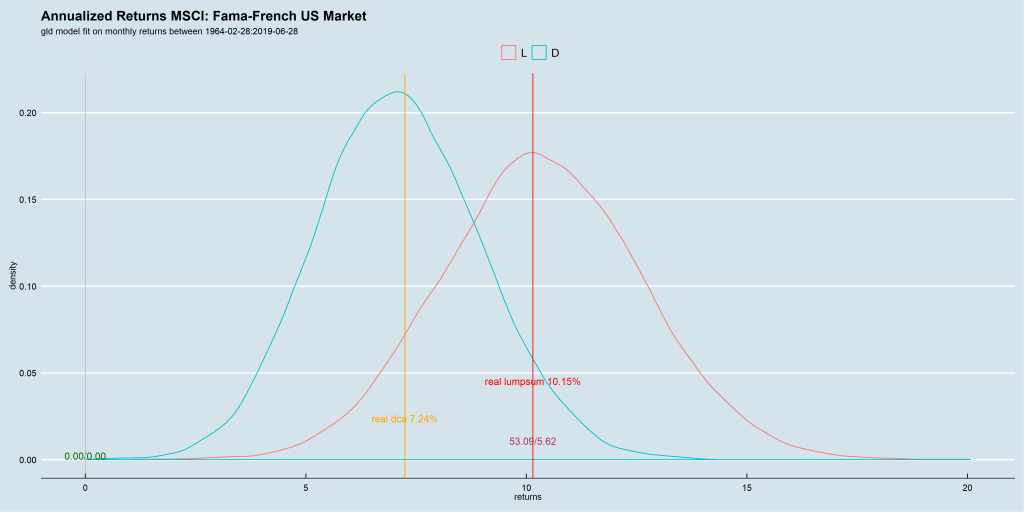
The post 1980 data-set is so skewed that when you use the entire data-set – 1964 through 2019 – for running the simulation, you end up with a 0% loss as well.
1964-2019: 0% possibility of loss in a buy-and-hold portfolio
With this data-set, it is easy to conclude that a buy-the-market “passive” buy-and-hold strategy is superior to everything else. But that would be a very aggressive conclusion to draw.
There are quite a few countries with equity returns (since 1993) in the low single digits: GREECE, CHINA, JORDAN, JAPAN, IRELAND, AUSTRIA, PAKISTAN.
CHINA, a country that grew its GDP in double digits, was a very poor equity investment. And JAPAN was the world’s second largest economy in 1995 but their equities are a joke on twitter.
Only DENMARK, USA and SWITZERLAND had an extremely small chance of posting negative buy-and-hold returns.
Out of the 43 Country specific MSCI indices we analyzed, half had more than a 10% chance of giving negative returns to buy-and-hold investors. India had a 6% chance.
6% possibility of loss in a buy-and-hold portfolio
Any analysis done on US stocks should be taken with a pinch of salt. The rest of the world does not work that way.
This post expands on an earlier one on the same topic.
Social science research is said to have a WAGS problem. Most of their research is based on White American Graduate Students and fail to replicate in the real world.
Finance has a similar problem where, thanks to the depth of the data available on the US markets, most investment research is based on American data.
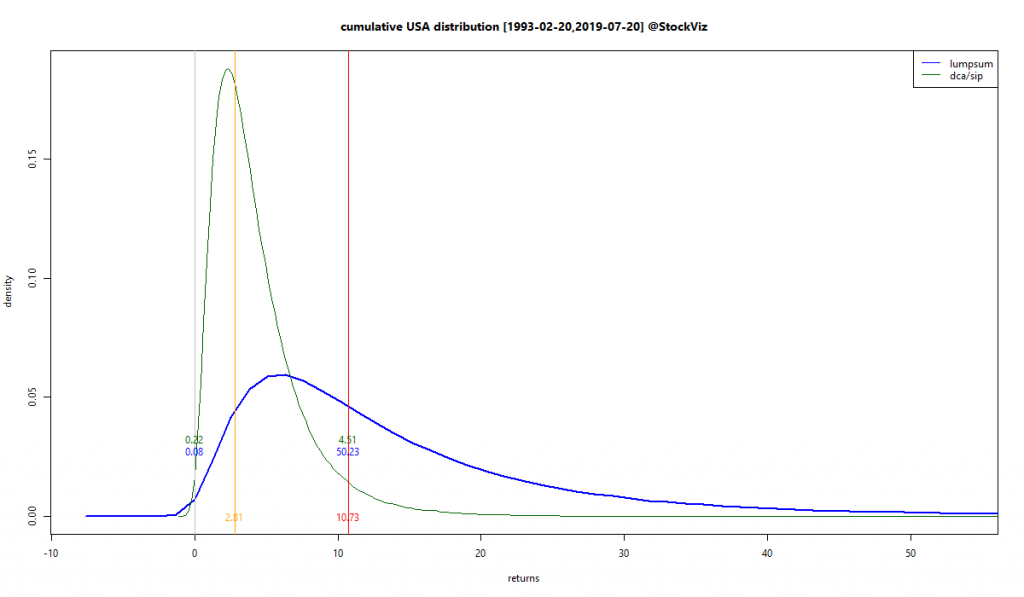
And US data clearly demonstrates the superiority of Buy and Hold. Over a 25+ year period, the probability of ending up with a loss is less than 0.1%
MSCI USA
If future returns are in the same vein as their past returns, US investors would be fools not to buy and hold forever.
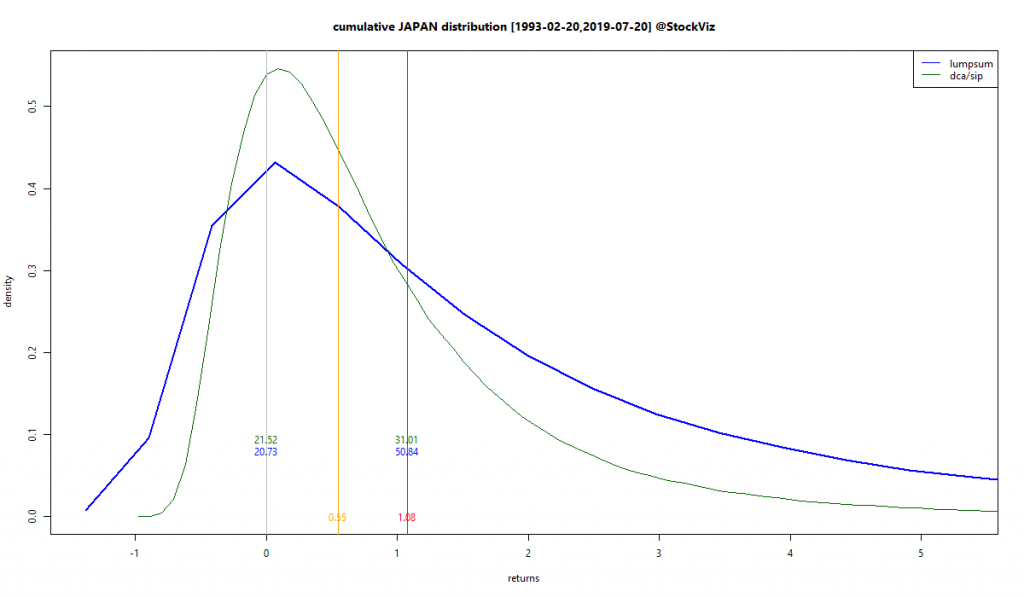
However, this does not mean that the rest of the world should do the same thing. Every market is different. The Japanese experience is a study in contrast.
MSCI JAPAN
The probability of a negative outcome is a whopping 21% for them. i.e., there is a one-in-five chance that investors will not make any money investing in Japanese equities. If past is indeed prelude.
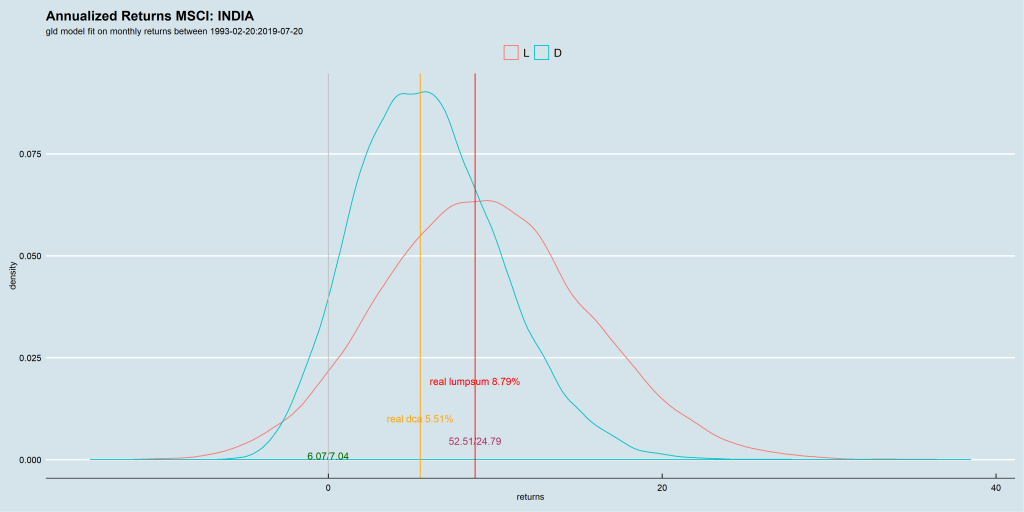
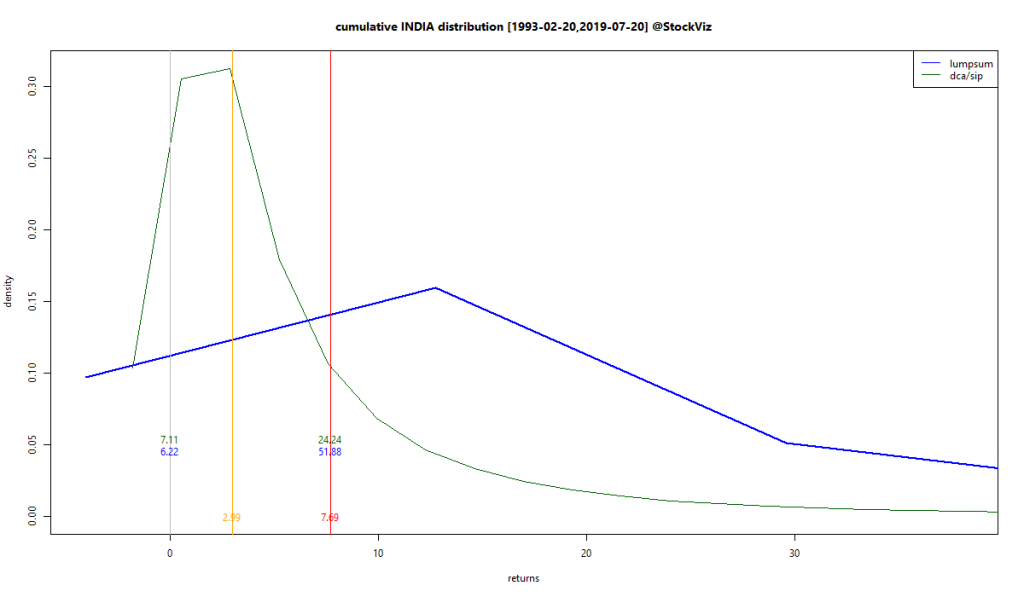
Indian investors have been better off than their Japanese counterparts. There is only a 6% chance of not making any money investing in Indian equities.
MSCI INDIA
All this goes to show that the US is a statistical outlier. “Buy and Hold” working in the US is an outlier. In every other market, there is a non-trivial chance that you will not make any money buying-and-holding equities.
When you look at research based on US markets, keep in mind that the probability distribution of returns that it is based on are an outlier. Anything that is long US equities will “look good.”
All investing is forecasting. And these probabilities will change – we are talking about equity markets after all. But know this before you adopt the “buy and hold” mantra.