Focus on what is important in life.
Often, the highest selling product is the one with the best narrative, not the one that provides the best value for money. Similarly, what drives eye-balls in media are narratives around “alpha,” “out-performance,” “best mutual funds,” “1% a day option strategies,” etc. But what really matters to you are things like “fund my kids’ college education,” “retire at a reasonable age,” “take a foreign vacation,” etc.
While it can be sexy to consider oneself as an investor – fantasizing belonging to the same tribe as Warren Buffett or Peter Lynch – people looking to meet goals that actually make a difference to their lives, are better off considering themselves as savers.
One saves their income to meet expenses in the future. Thinking this way drives focus towards the two things that are entirely within one’s control: savings rate and duration.
Once you shift the internal narrative to saving over investing, how you measure success changes as well. The last thing you’d want to do is play snakes-and-ladders with your portfolio. You’ll want to reduce risk as you get closer to withdrawal. And finally, you’ll realize that market’s return doesn’t matter as long as your funding needs are met.
Accepting lower returns
While you are stuck in Silk-Board traffic the next time, ponder this:
The current holder of the Outright World Land Speed Record is ThrustSSC driven by Andy Green, a twin turbofan jet-powered car which achieved 763.035 mph – 1227.985 km/h – over one mile in October 1997.
How come you don’t drive a jet-powered car? Wouldn’t that be the “best” car?
The reason why you drive a mini-van and not a jet is because your life involves mundane things like grocery shopping, dropping your kids off to school, going to the mall, etc.
Similarly, your portfolio should reflect your life. Just like you make-do with a mini-van (not the fastest, not the sexiest, but practical,) you should construct a portfolio that gets the job done. And that often involves not being the “best” investor but focusing on risk.
Managing risk means accepting that you will never go as fast as Andy Green.
Market returns vs. Portfolio returns
A “lost-decade” for stocks probably happens every decade.
Here’s MSCI indices for US, Developed Markets ex-US and India. The only thing that can be said for certain is that stocks fluctuate and occasionally tank 30-40% and sometimes even 70%
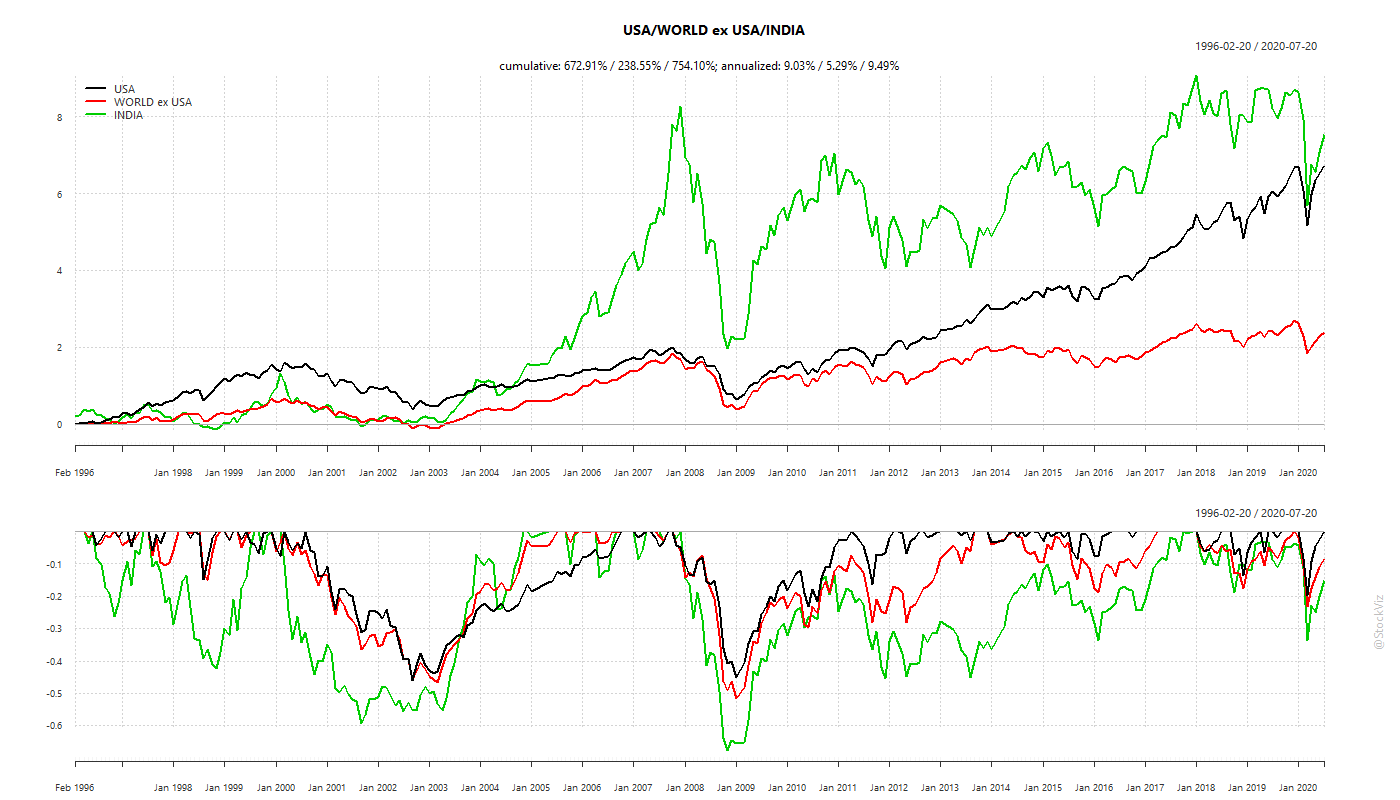
If you only invested in stocks and you needed money to send your kinds to college in 2008, then, well, good luck!
A goal-oriented portfolio constructed with this in mind will necessarily under-perform an all-stock portfolio when stocks are screaming higher. It will also not go down in flames when stocks tank, as they very often do. So, market returns ≠ portfolio returns.
Take risks when you can, not when you have to
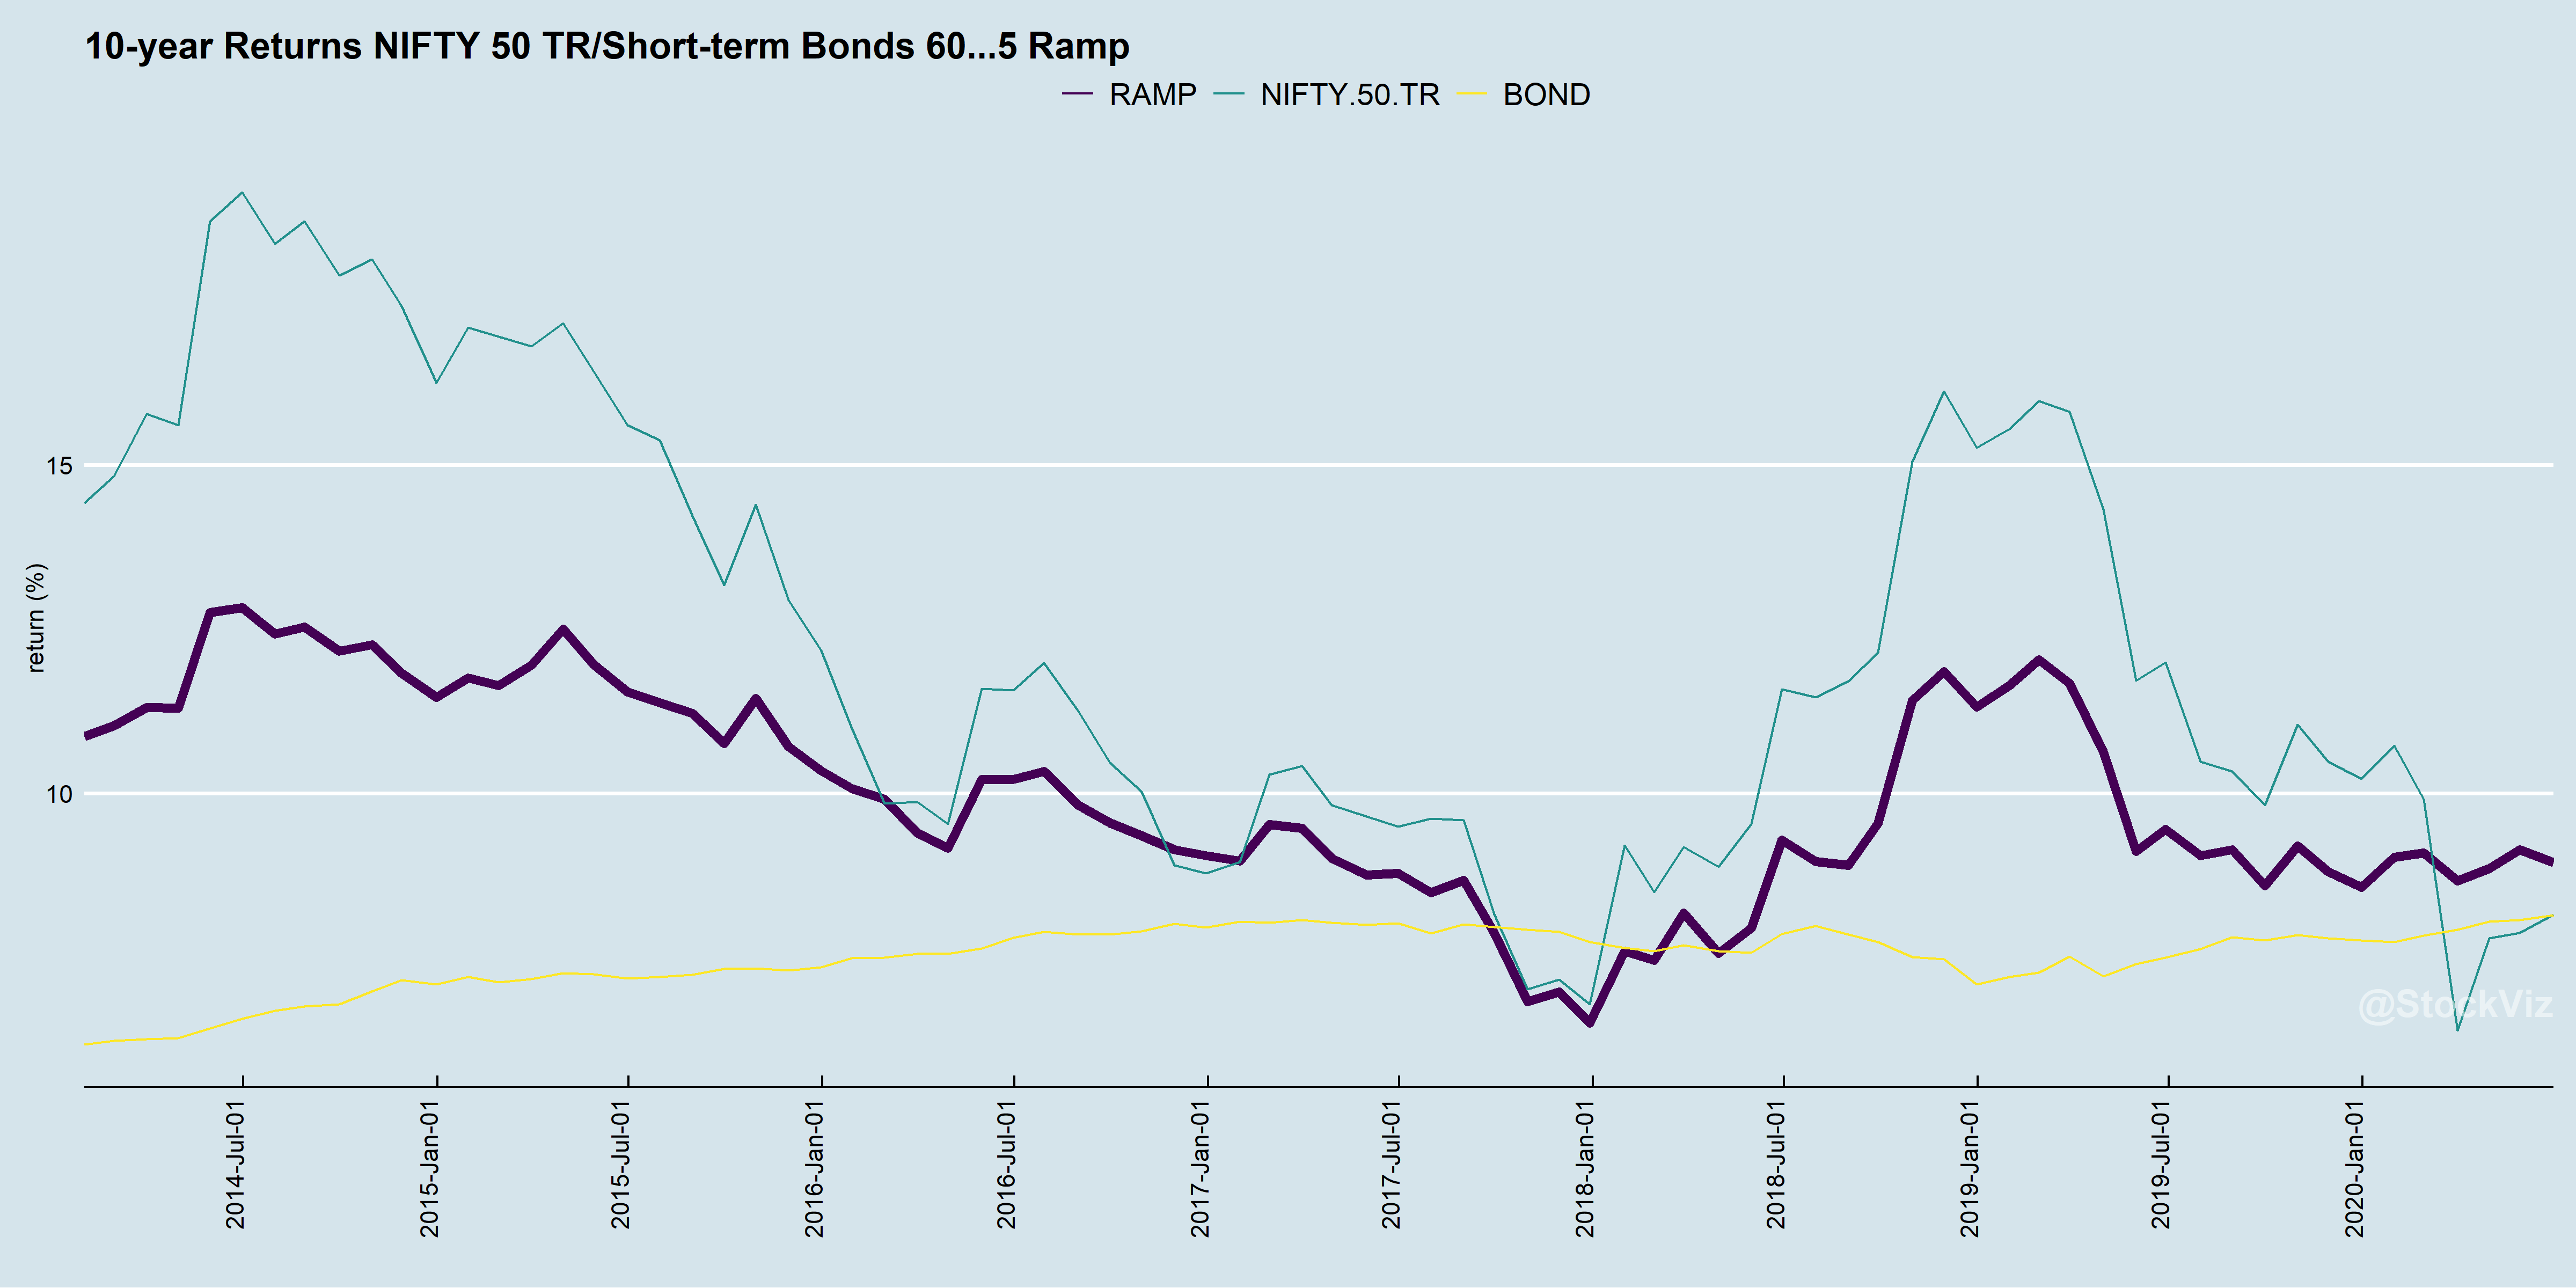
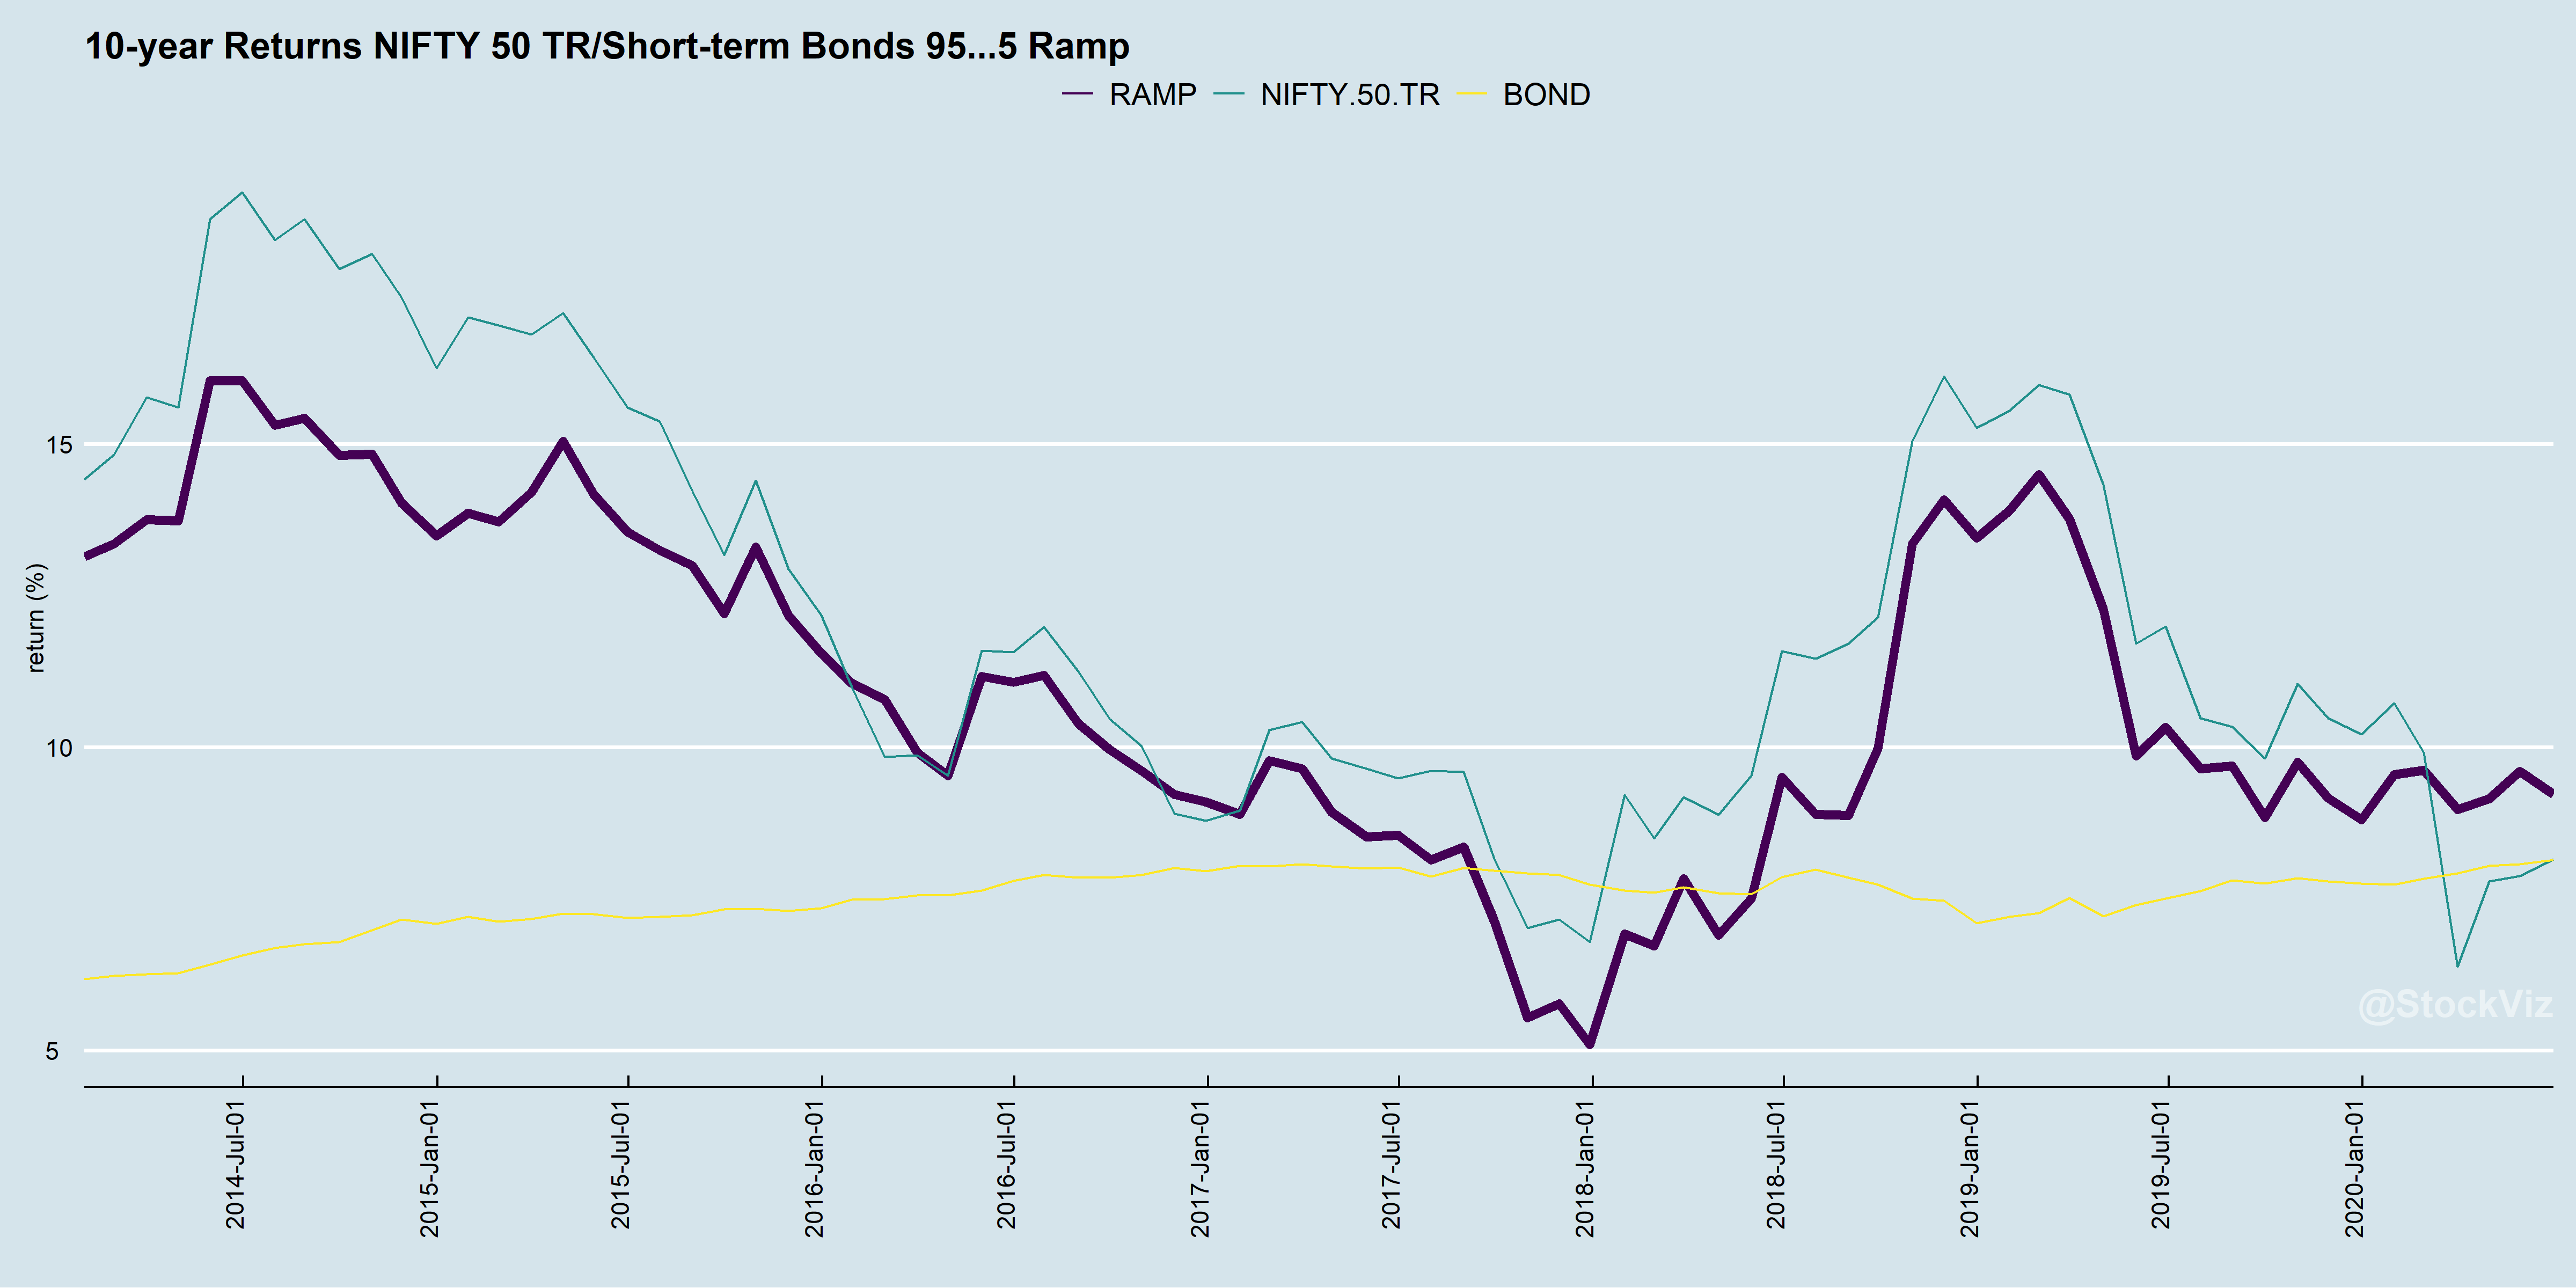
If you are saving for a goal 10 years away, it is safer to bet that markets will recover in 10 years than to bet that they will recover in one. So it maybe a good idea to load-up on risk at the beginning and slowly de-risk as time goes on. In fact, if you don’t take risk upfront, then you maybe doing it wrong.
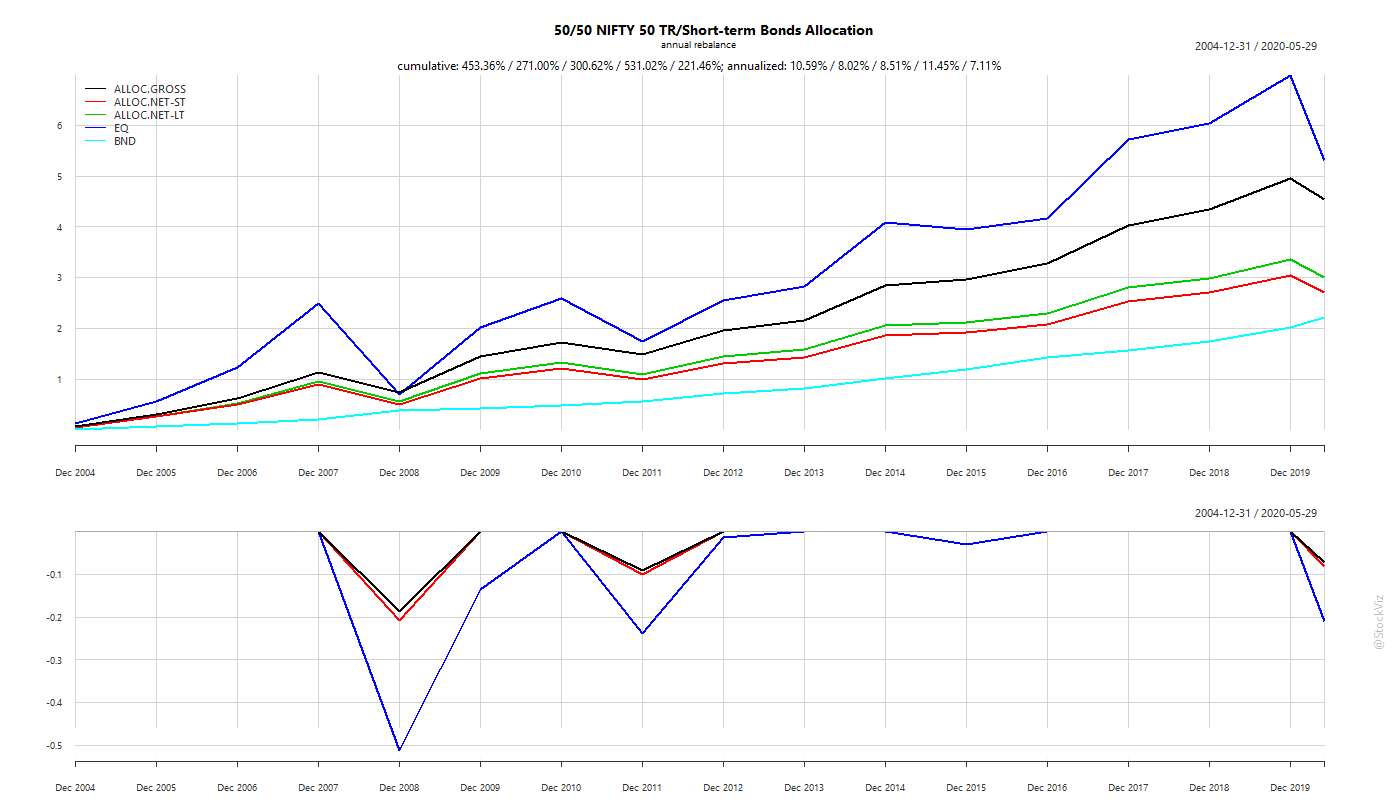
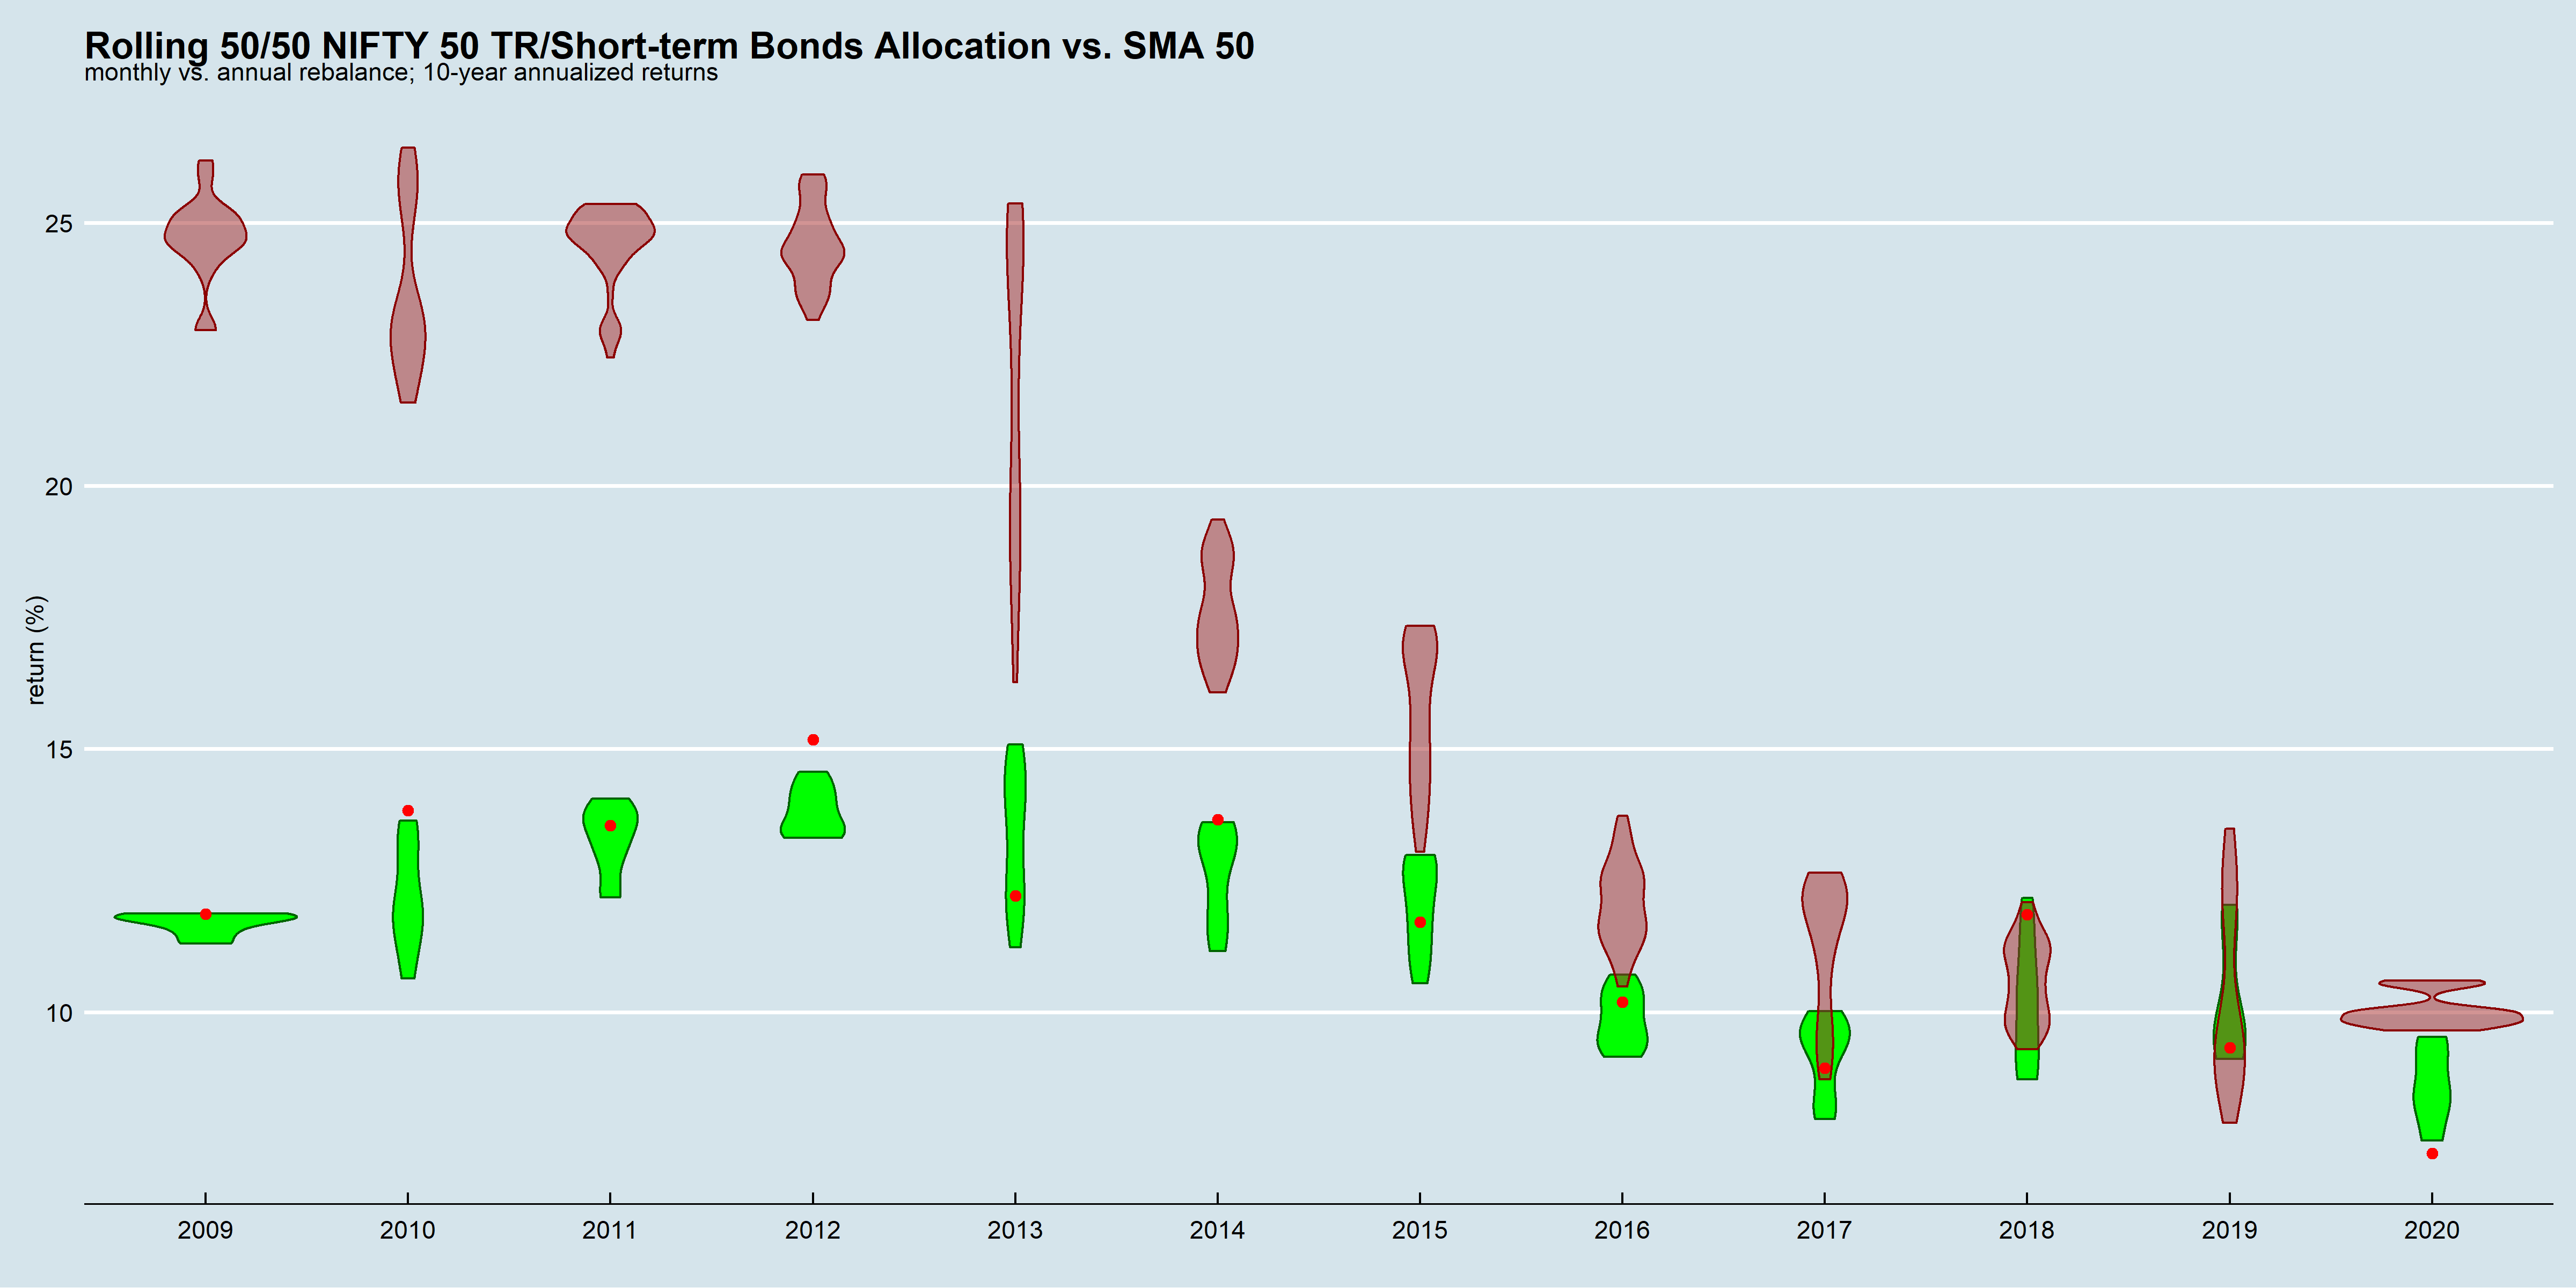
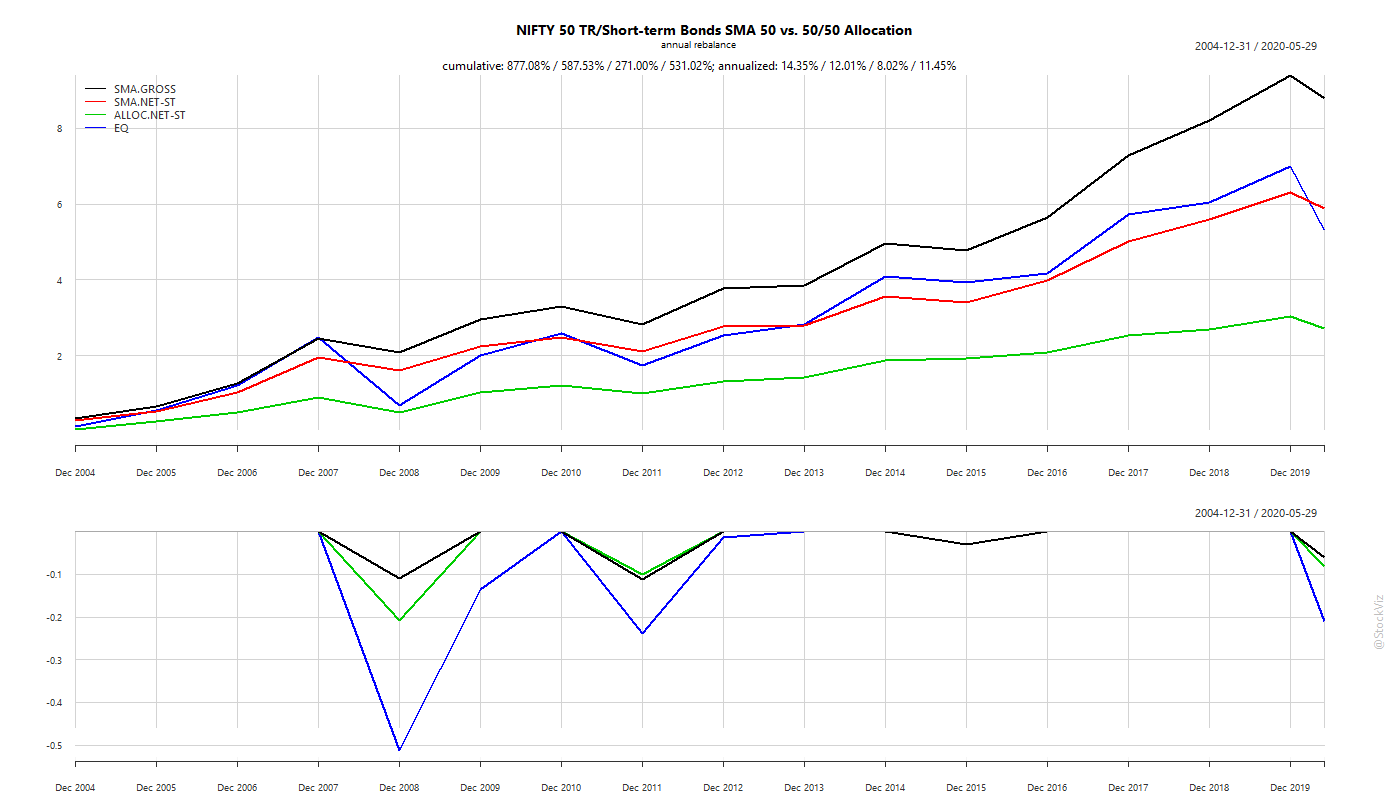
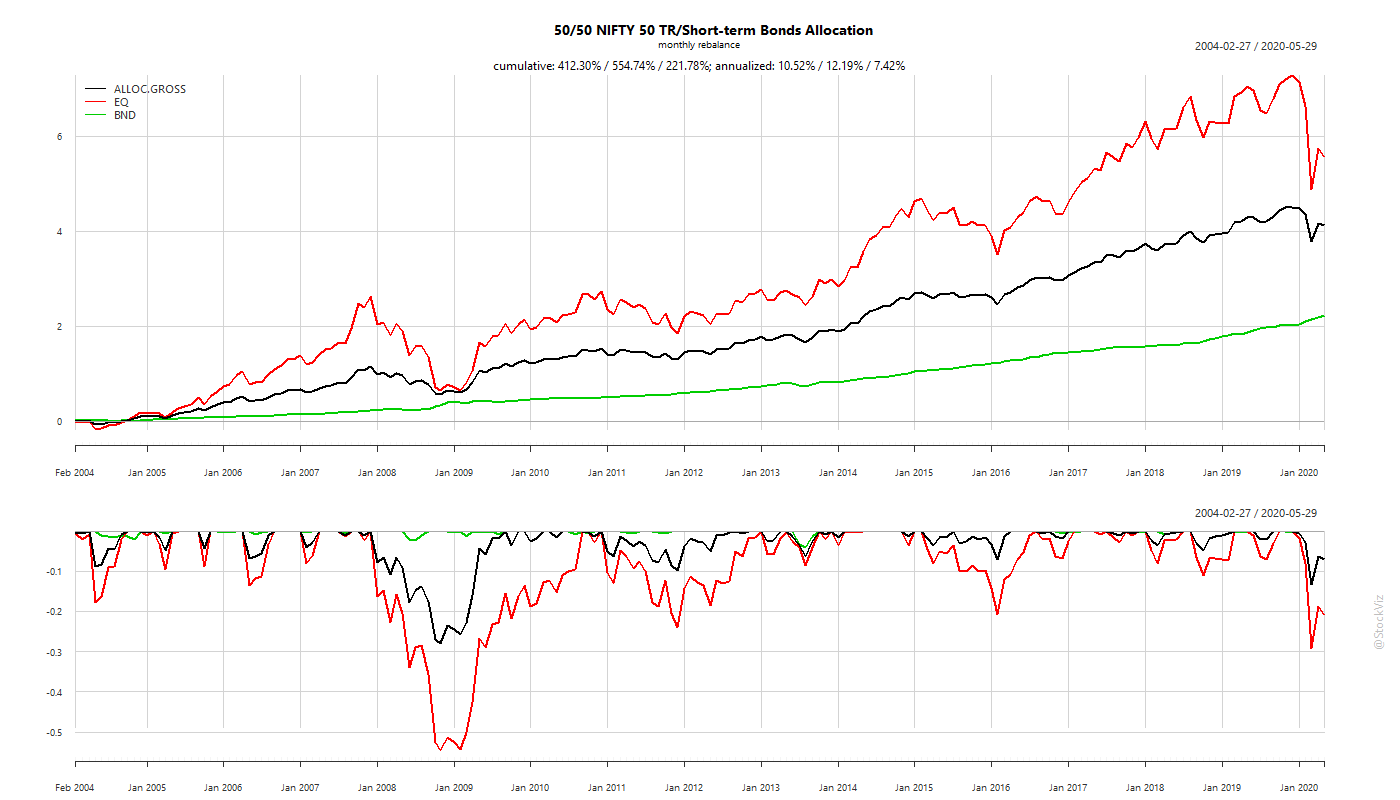
Here’s the difference between starting at 60% NIFTY vs. 95% and slowly ramping down over 10 years:
Glide path and Target-dates
The strategy described above is an example of a 10-year target-date fund with a linear glide-path. You start with an allocation that you are comfortable with – can be anything from 60/40 through 95/5 split between equities and bonds – and then every month nudge it so that at the “target-date” the allocation becomes 5/95. It is a way of taking risks upfront and de-risking the portfolio as the withdrawal date gets closer.
For longer time-horizons, say 30 years, you can also look at an exponential glide-path. The basic concept remains the same: reduce risk as you get closer towards withdrawal.
While decidedly unsexy, this “mini-van” strategy will safely get you and your family where you need to go.