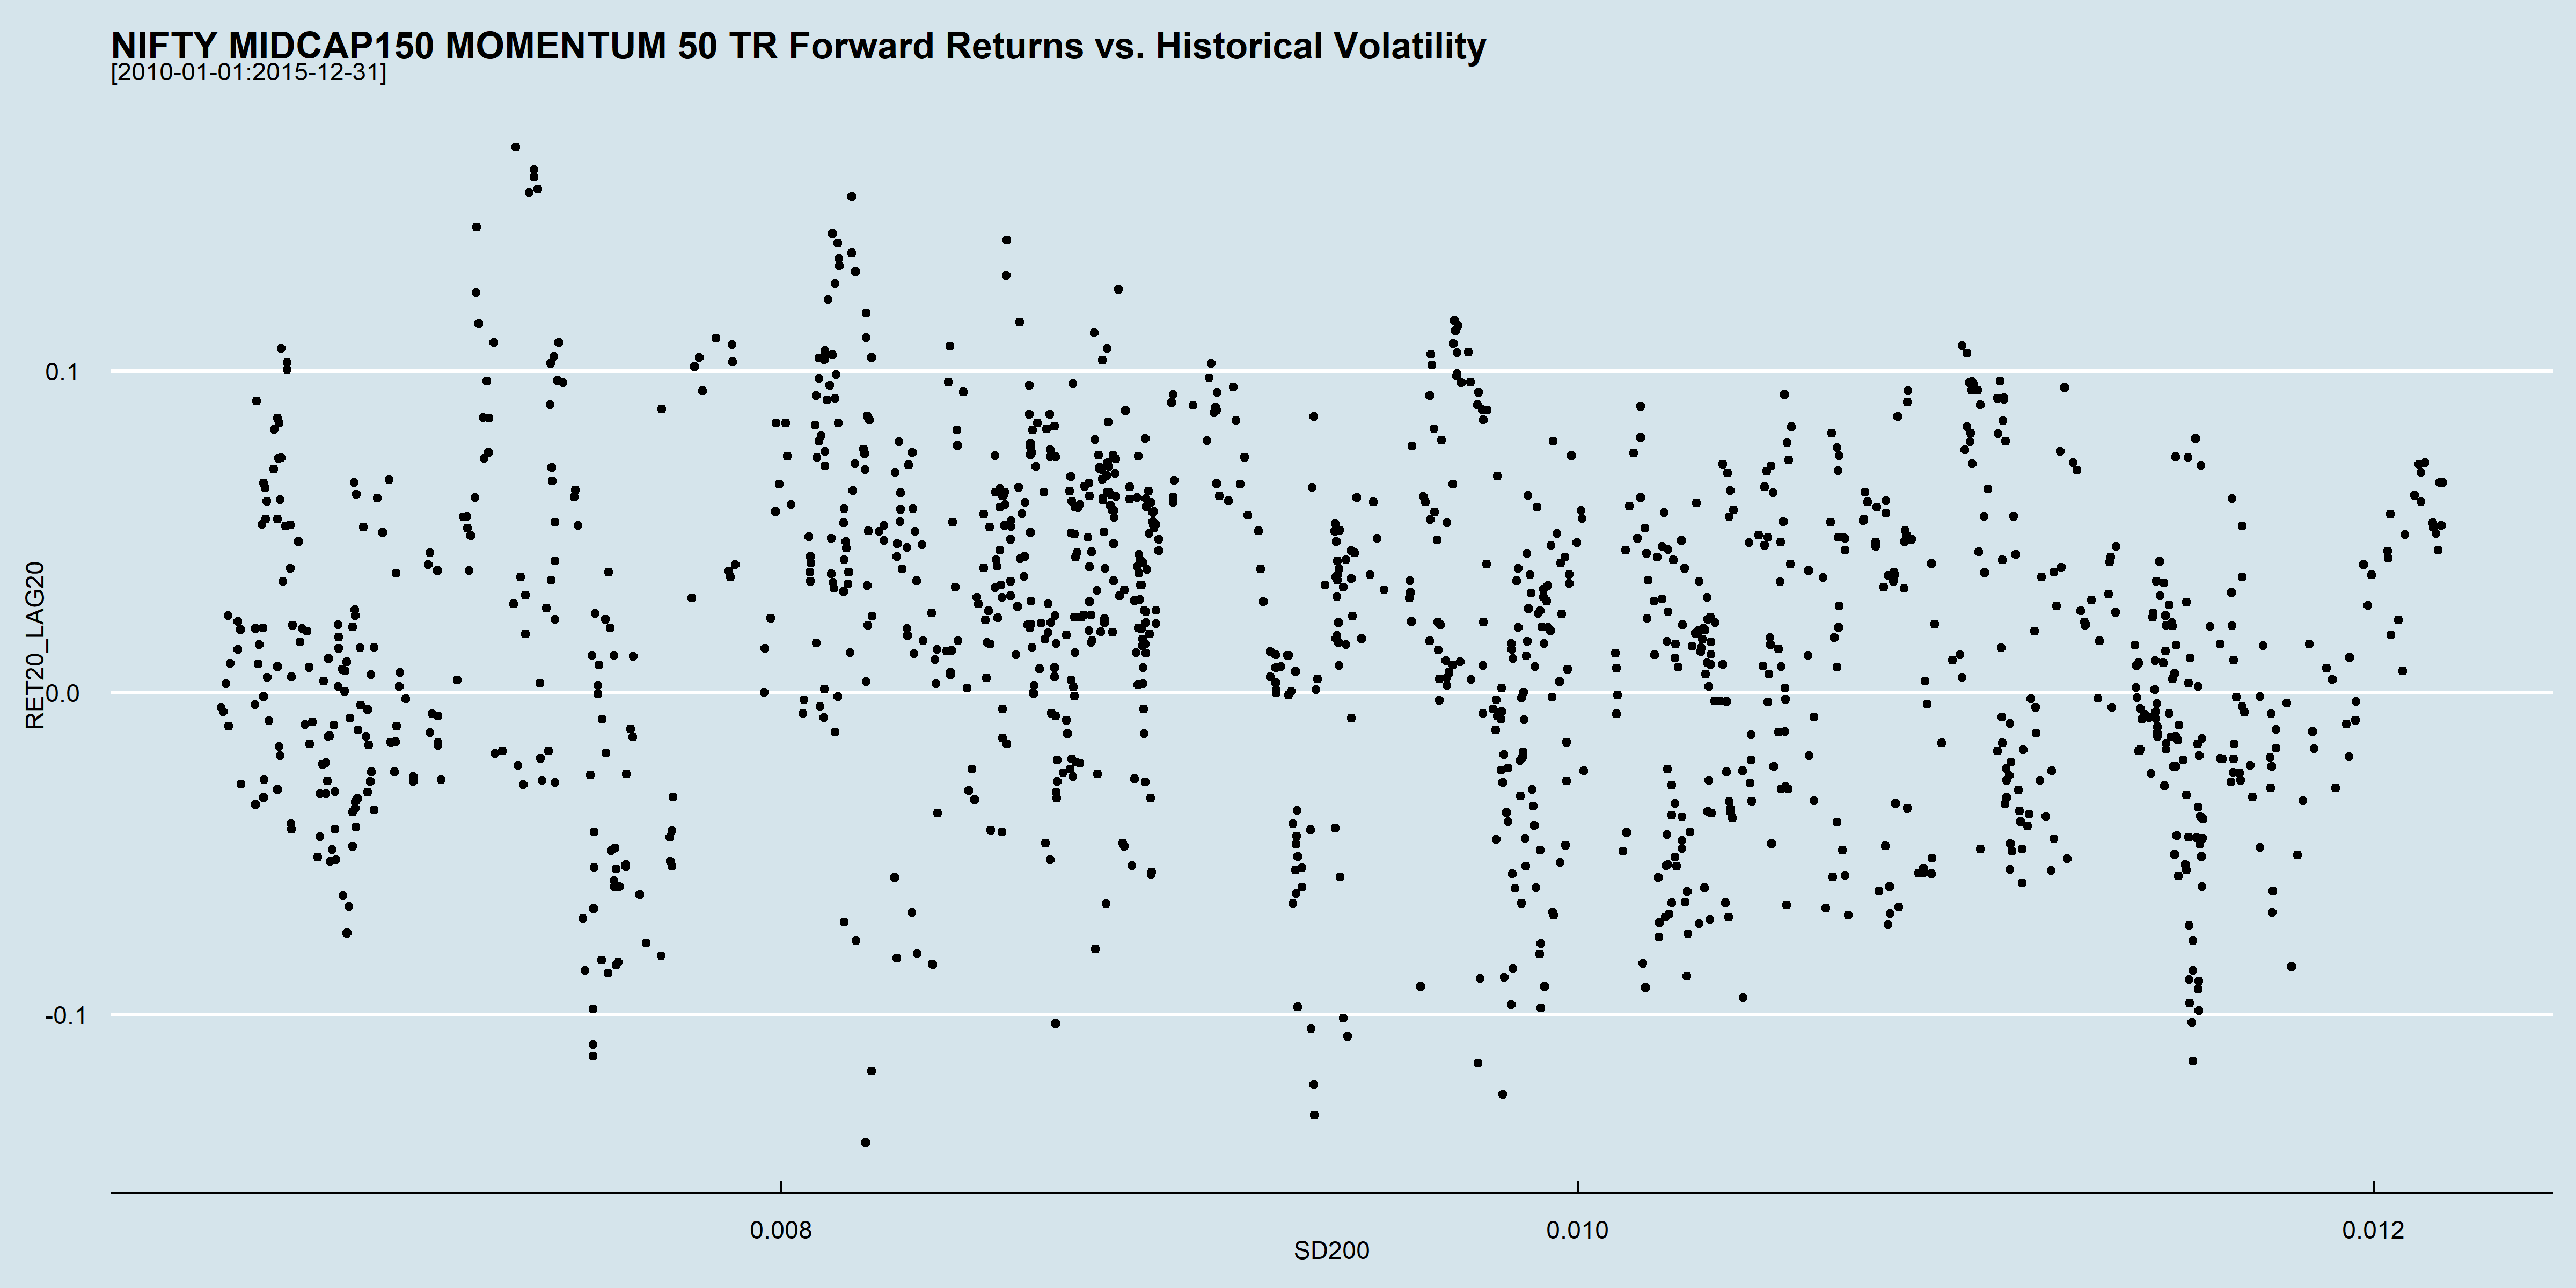
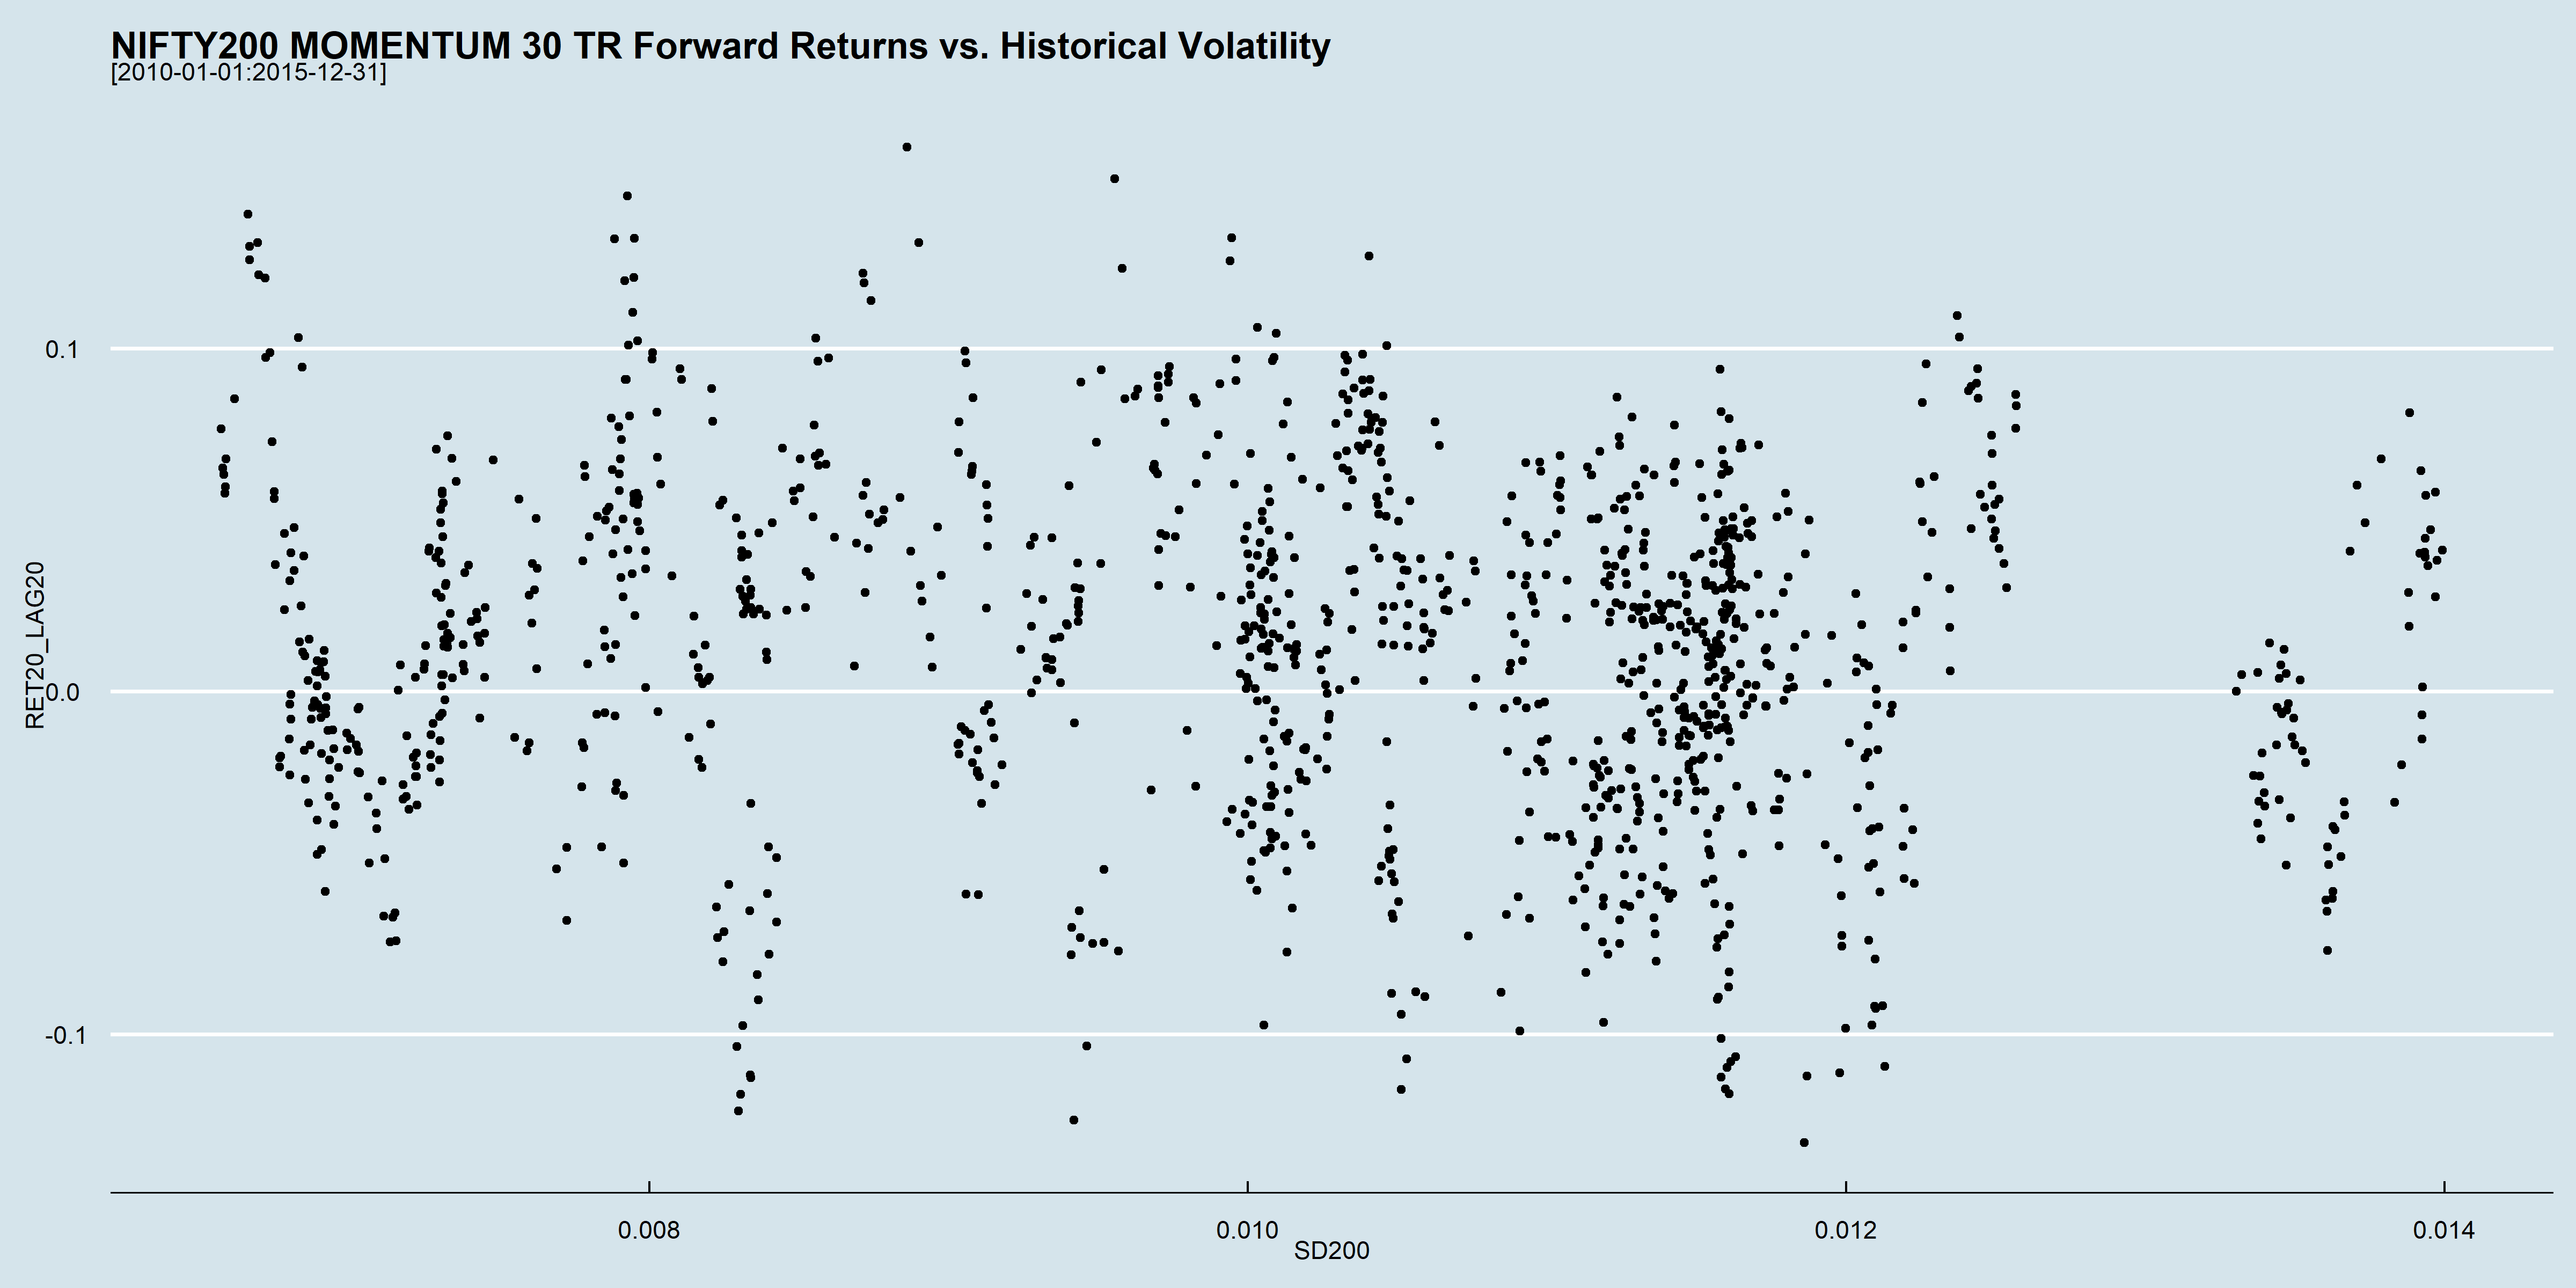
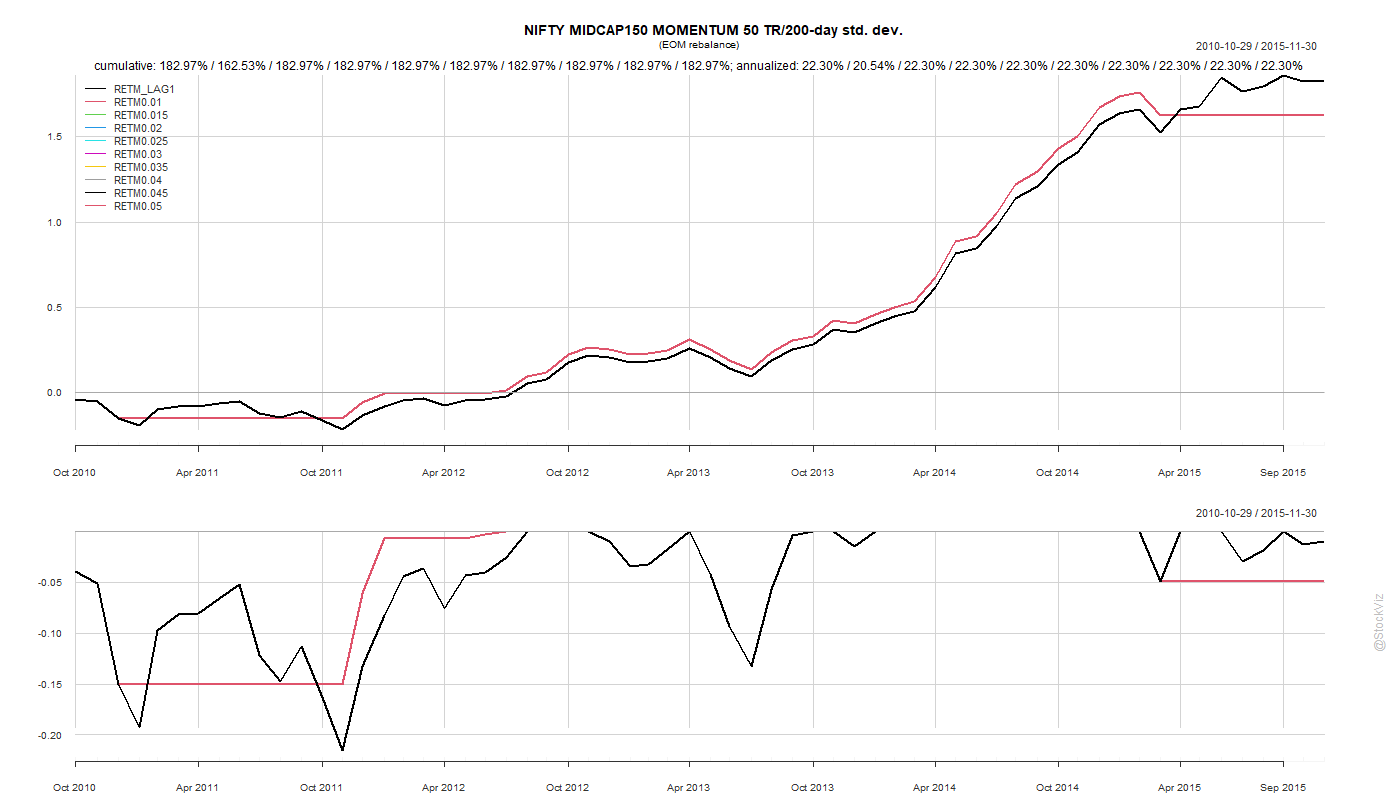
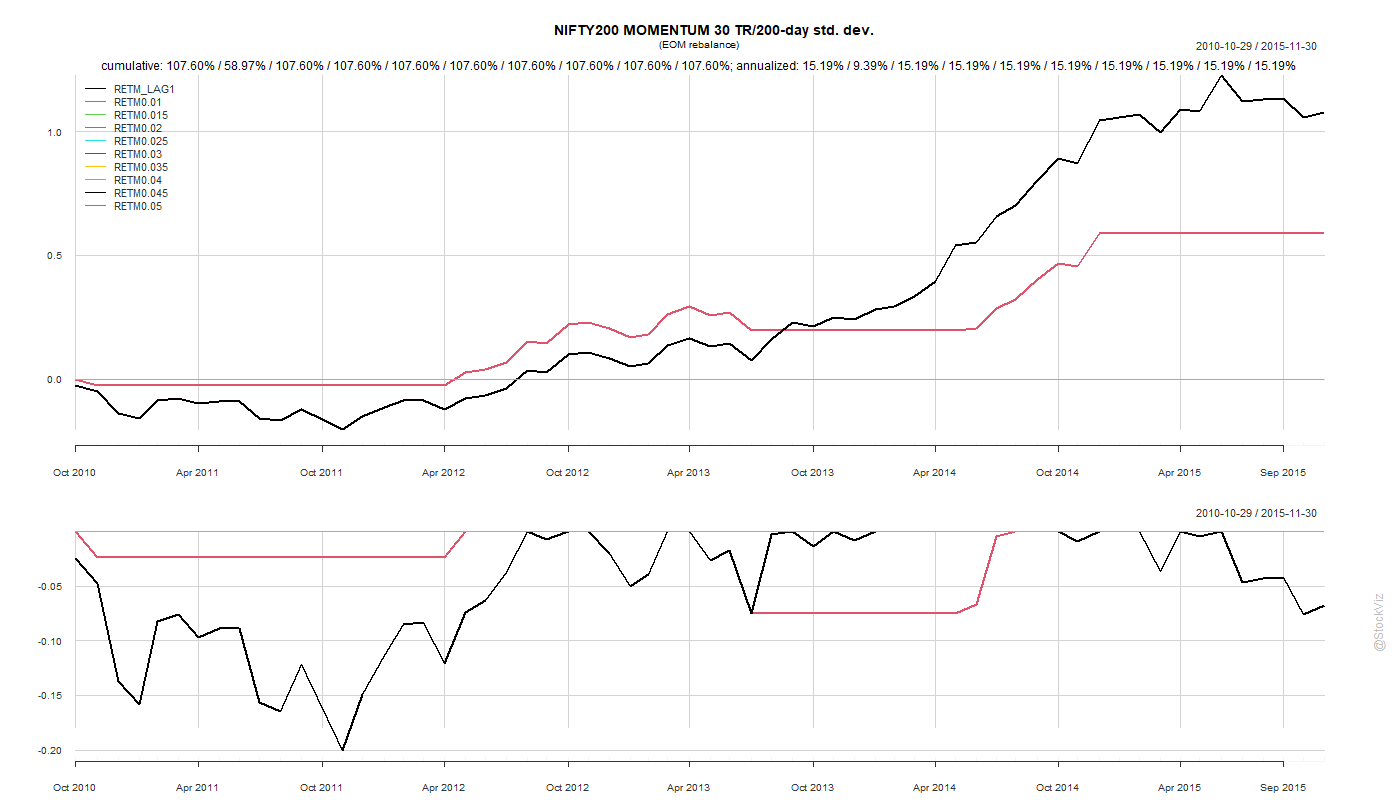
Can a simple moving-average be used to time momentum indices? Returns from 2010 through 2015 of NIFTY MIDCAP150 MOMENTUM 50 TR and NIFTY200 MOMENTUM 30 TR under different SMA strategies look like this:
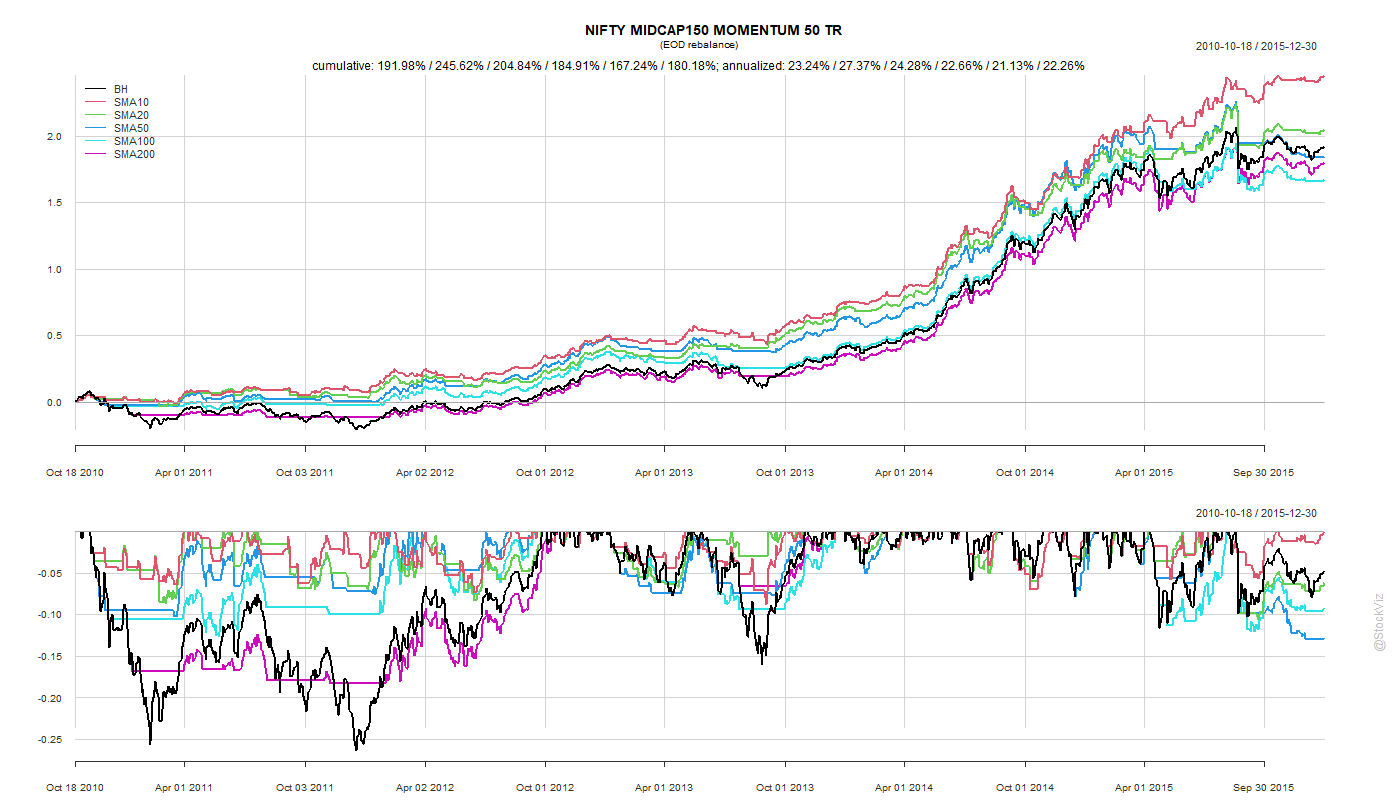
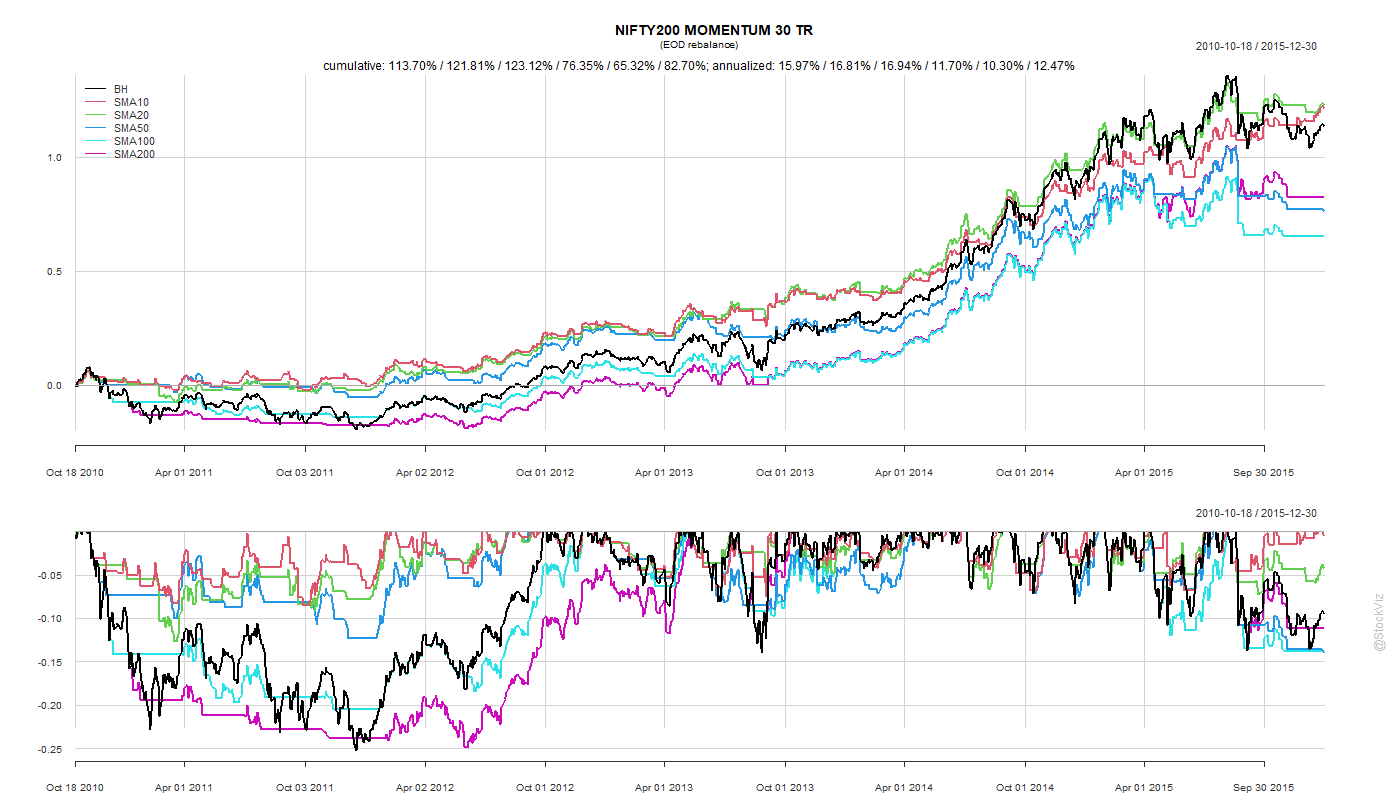
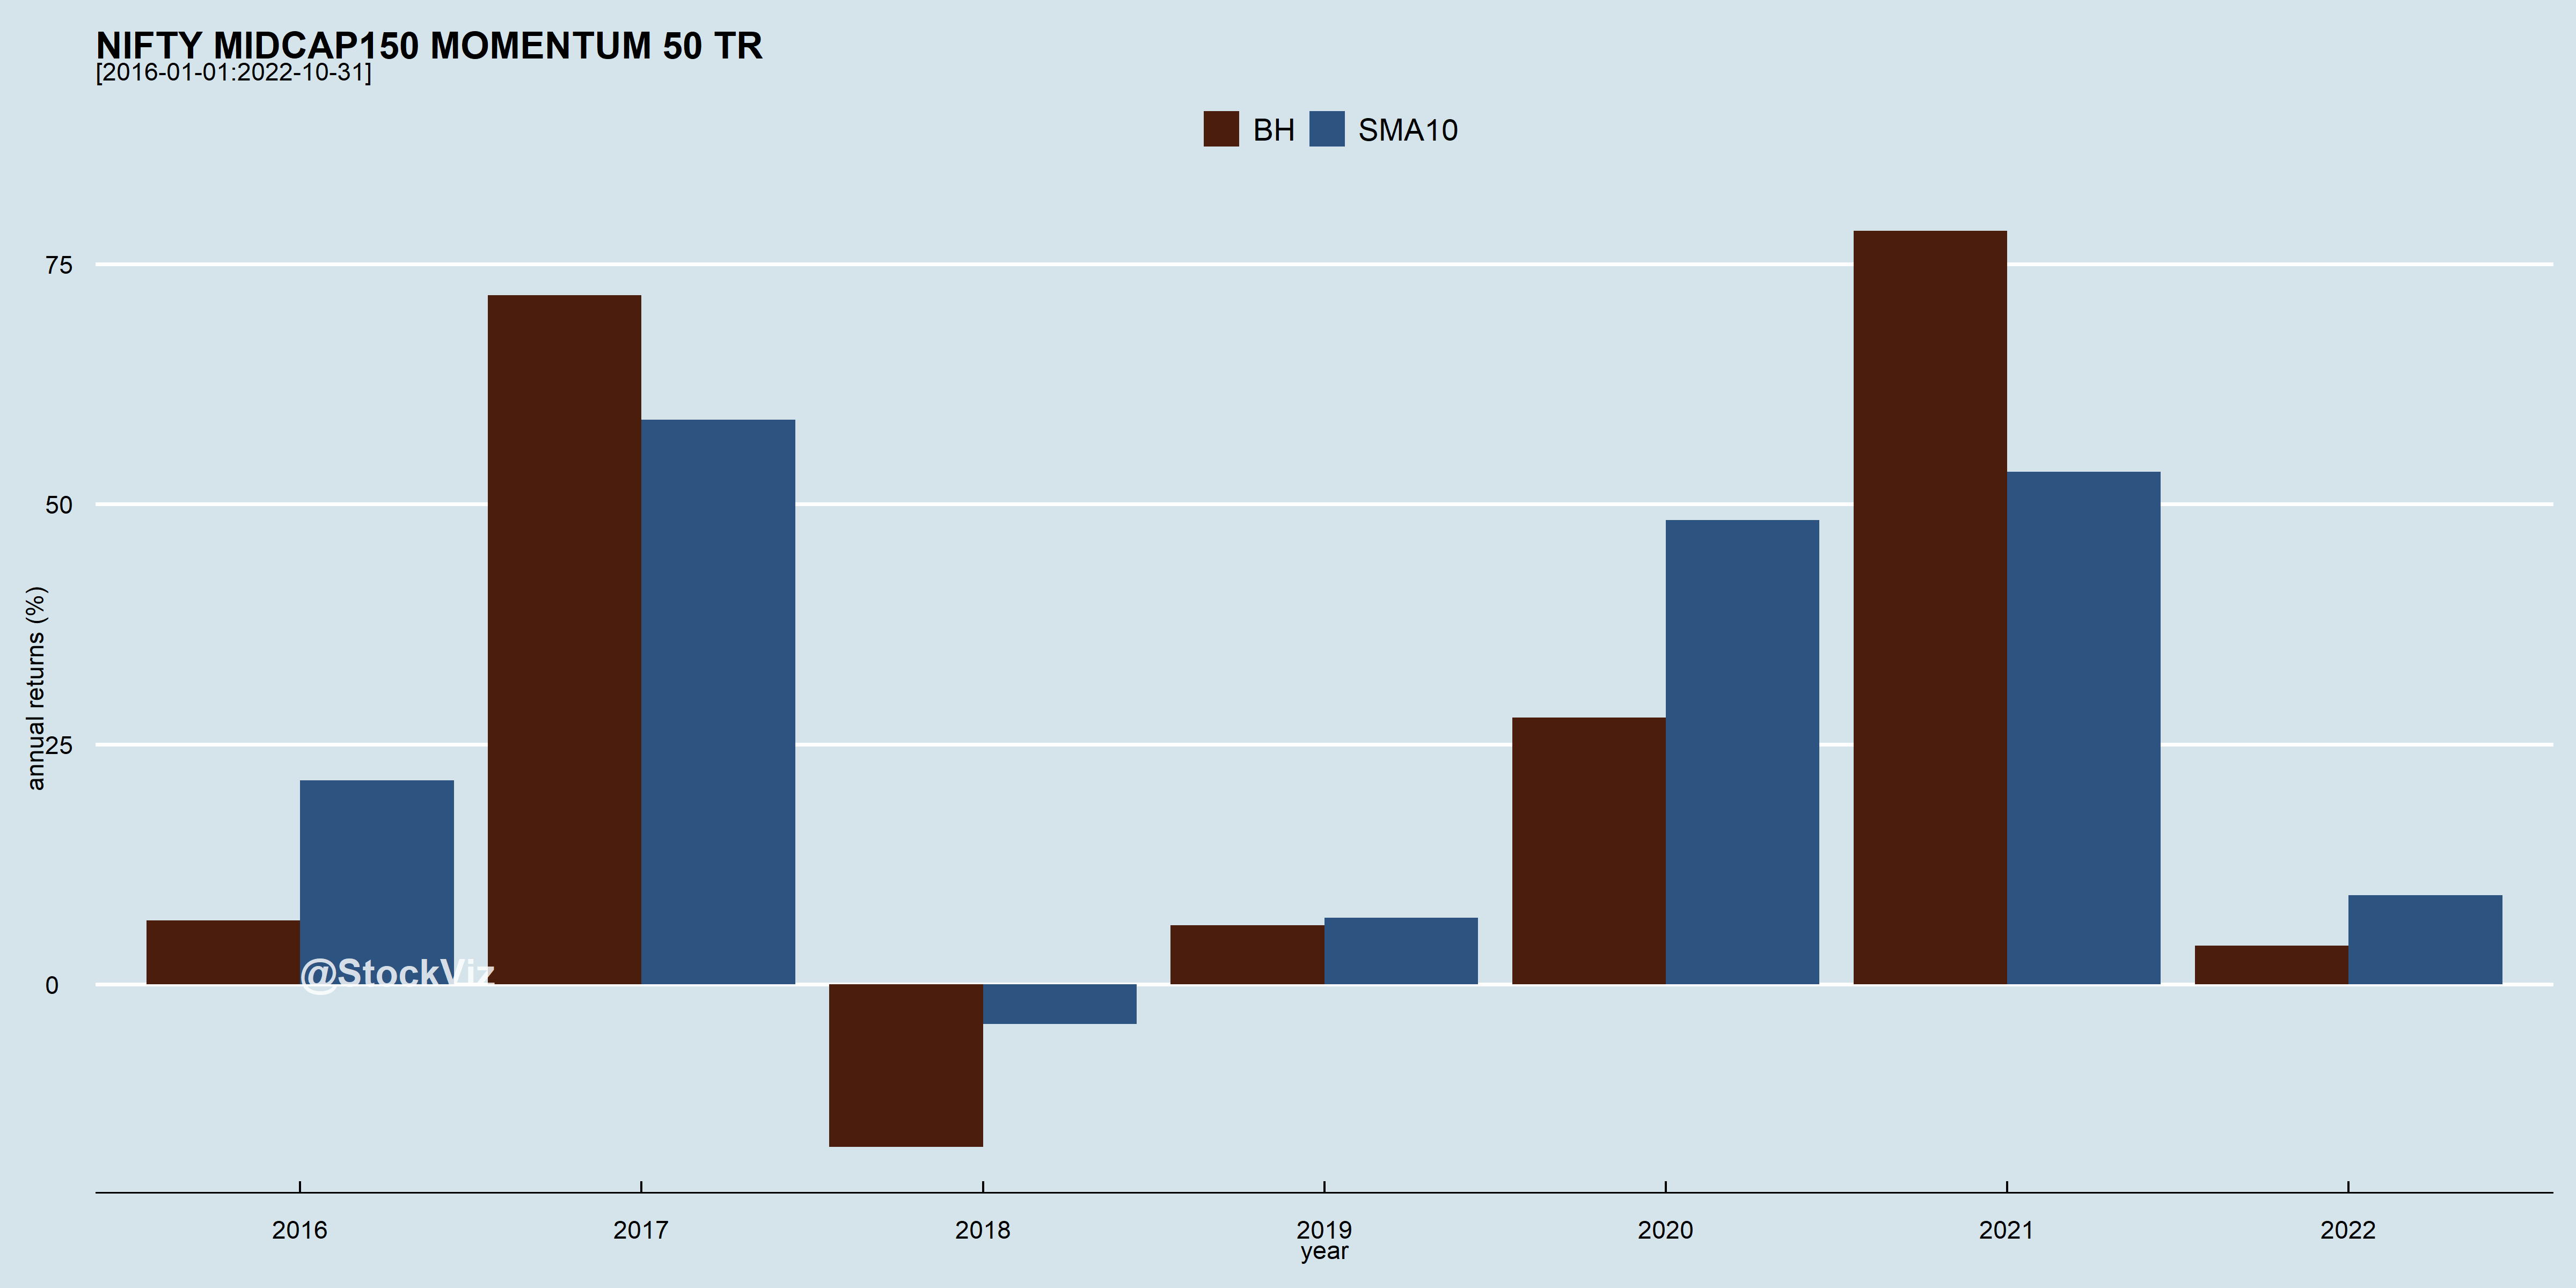
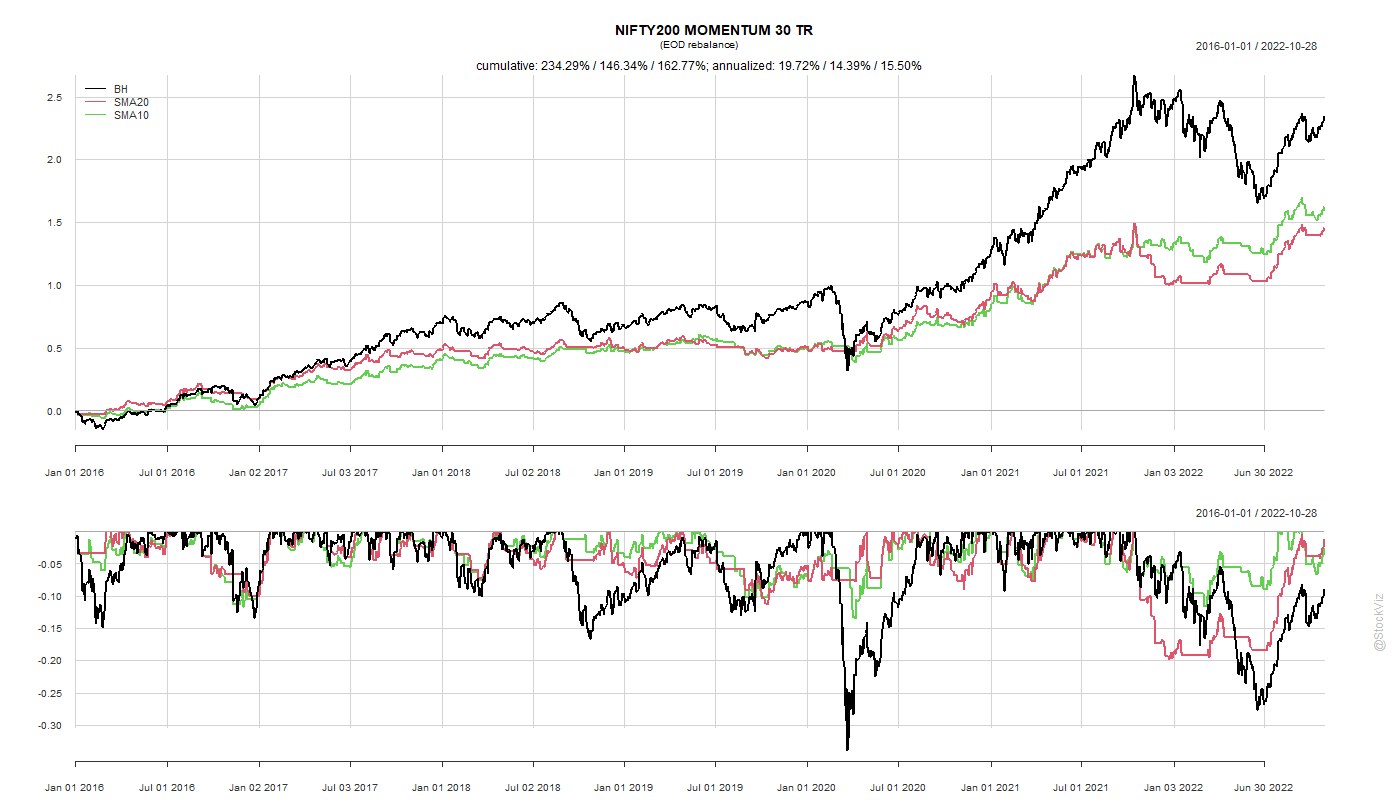
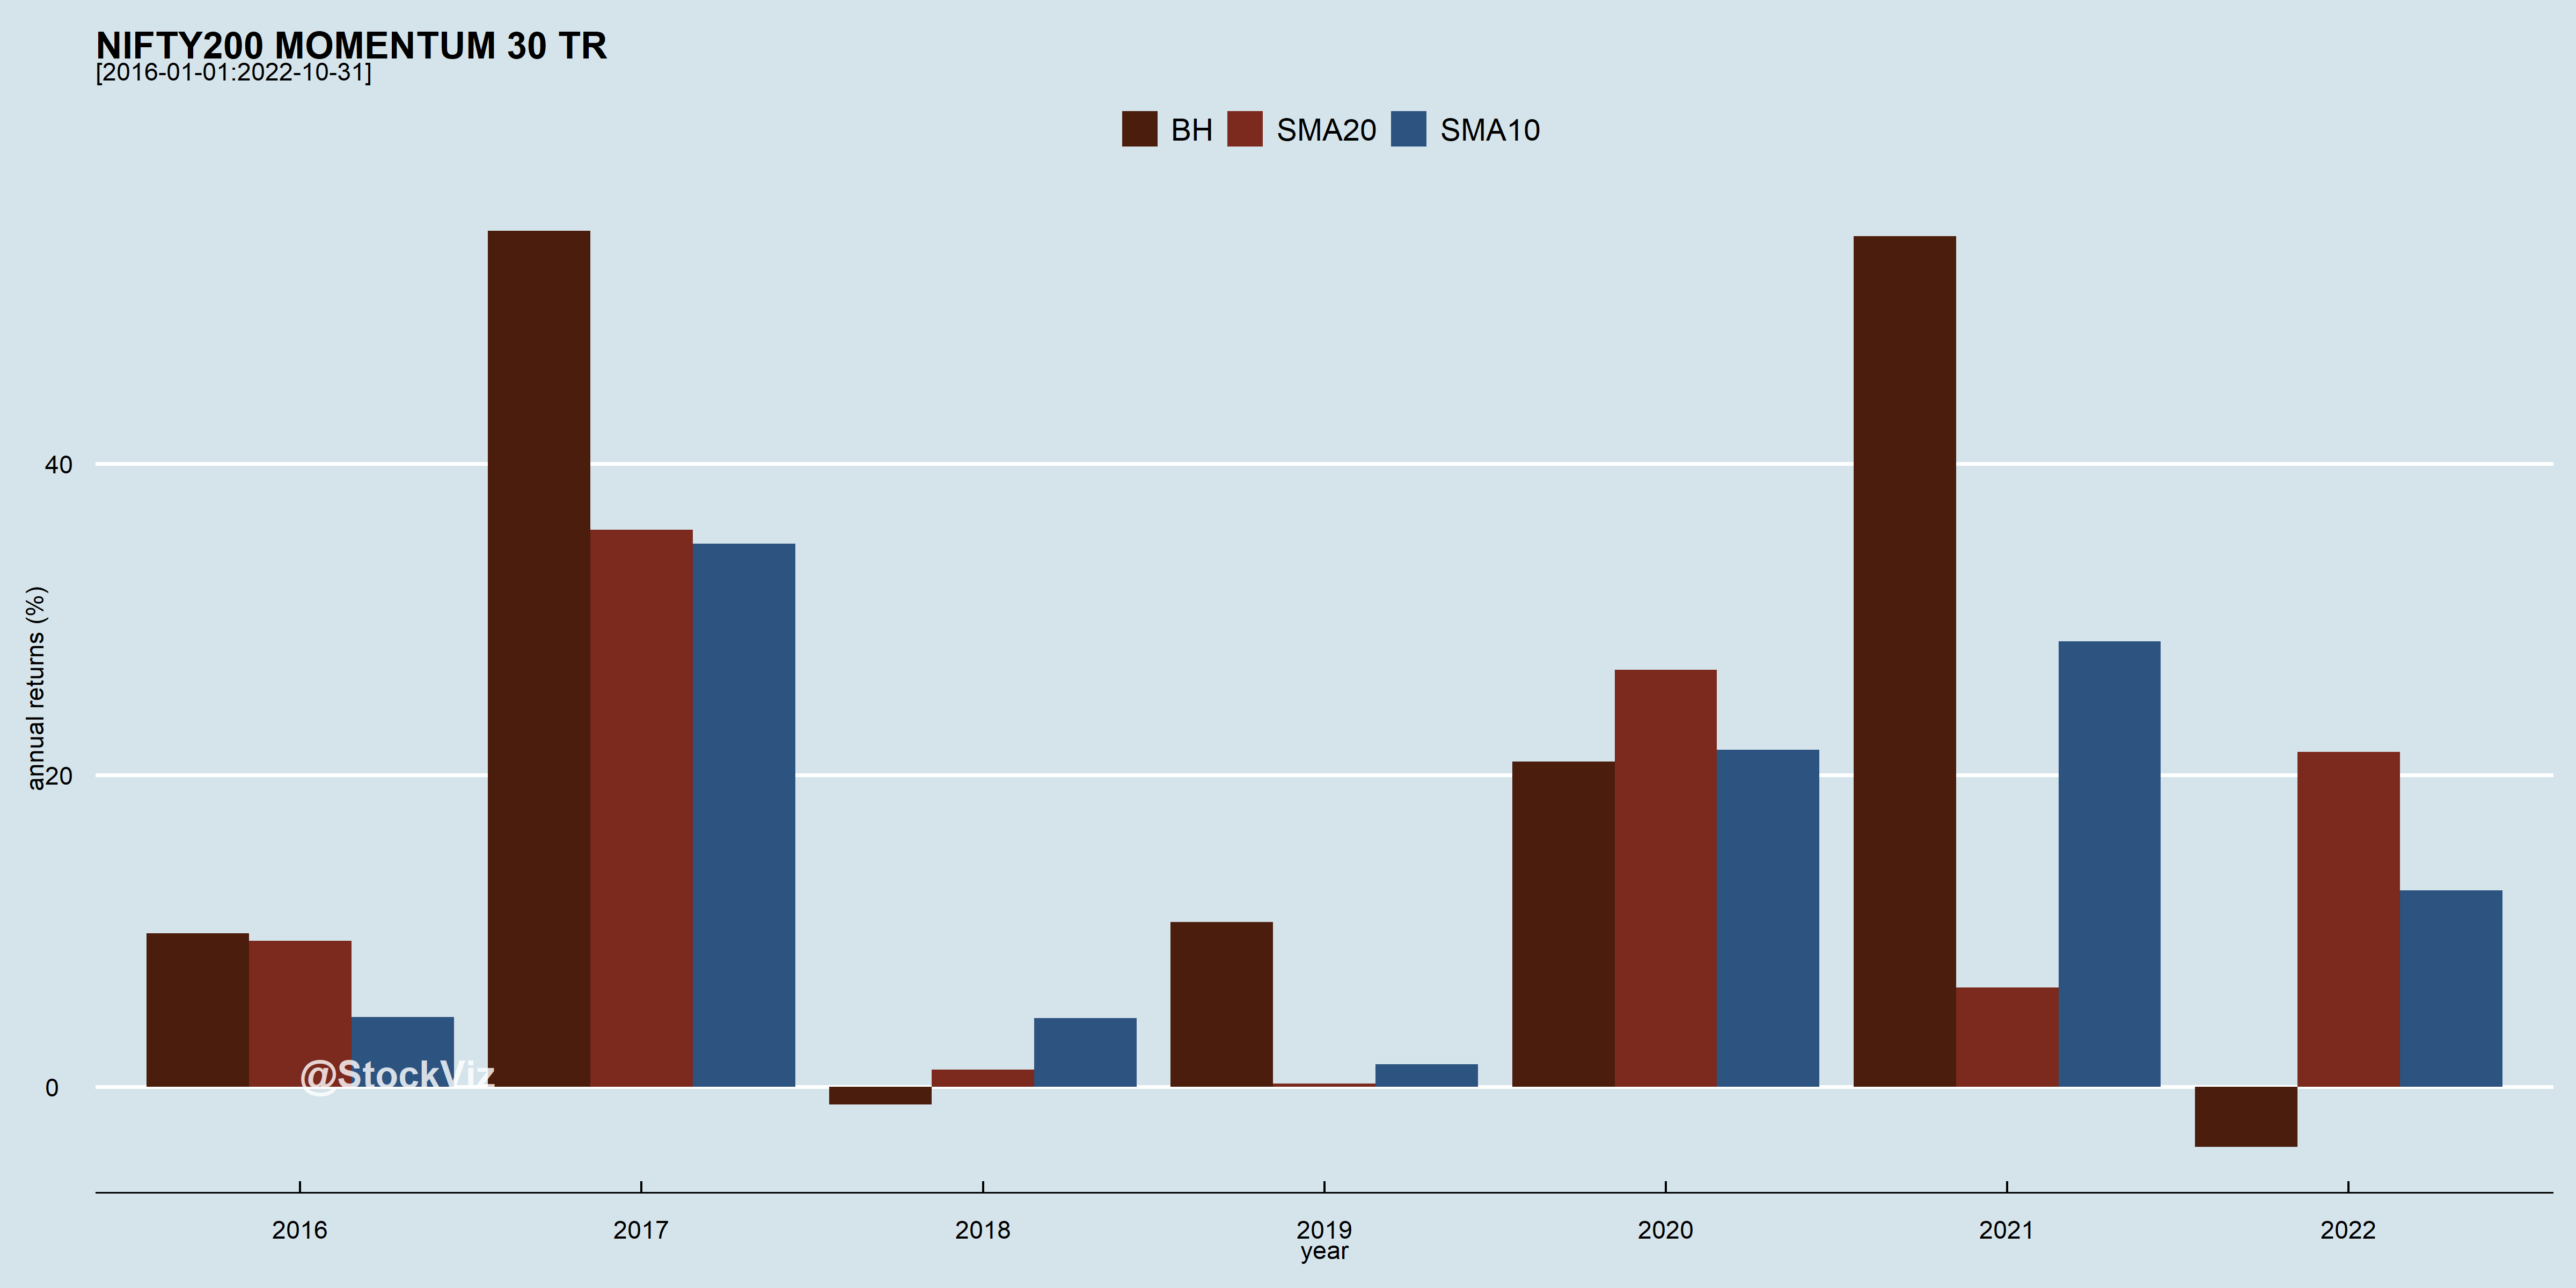
It appears the moving averages with short lookbacks can at least help reduce drawdowns, if not boost returns. If you pick the “best” config from the dataset and apply it across data from 2016 through 2022, it looks promising.
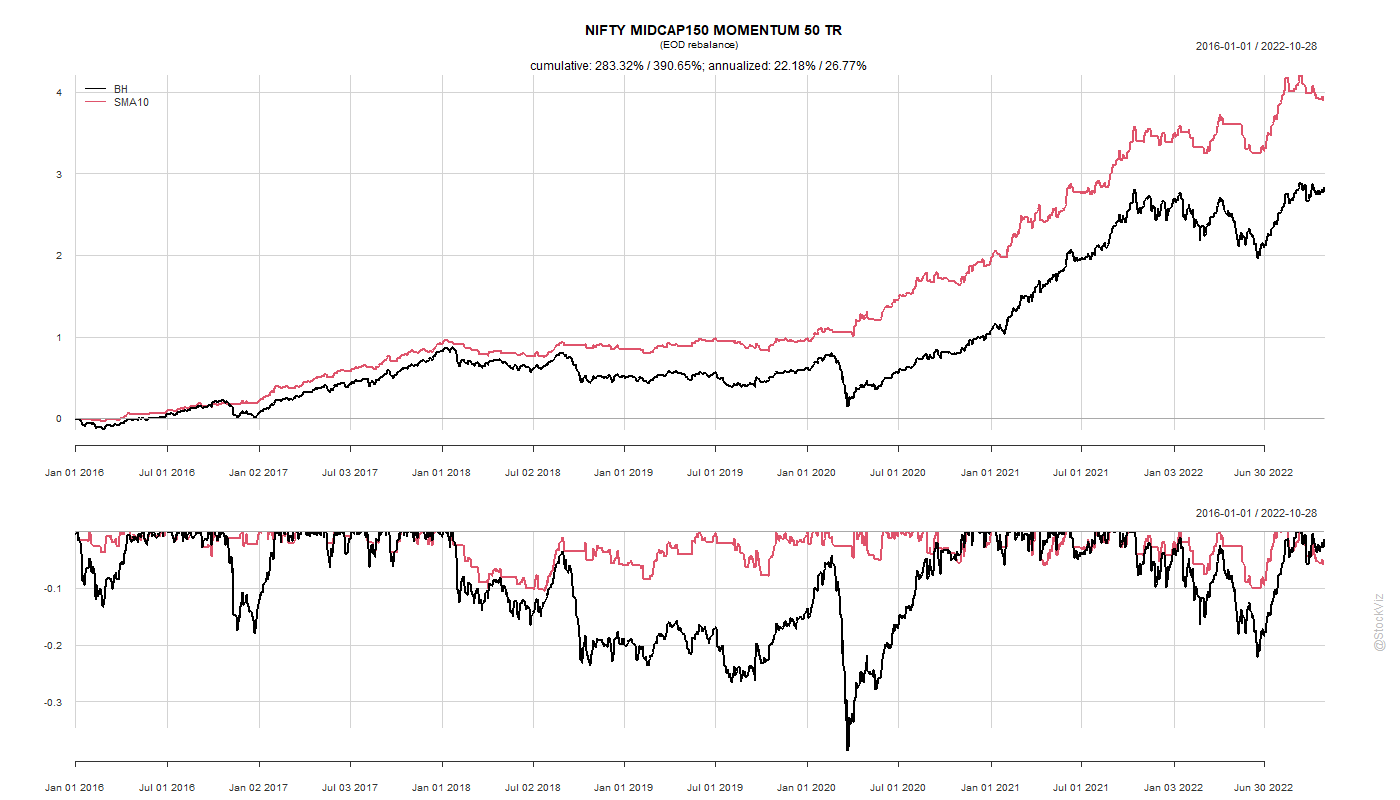
Should expect trend returns to be much lower after incorporating taxes and transaction costs but the lower drawdowns merit a closer look.
Given how our trend-midcap strategy has performed, we expect trend effects to be stronger in midcap-momentum than in the largecap version.
Code and charts: github