On our shark-fin posts earlier (here, here), we saw how even the most entrenched industries are getting disrupted as the cost of innovation plummets. But that is not to say disruption is easy. Incumbents have a number of levers to pull before they fade away. The biggest lever of them all is regulation.
Tesla Motors
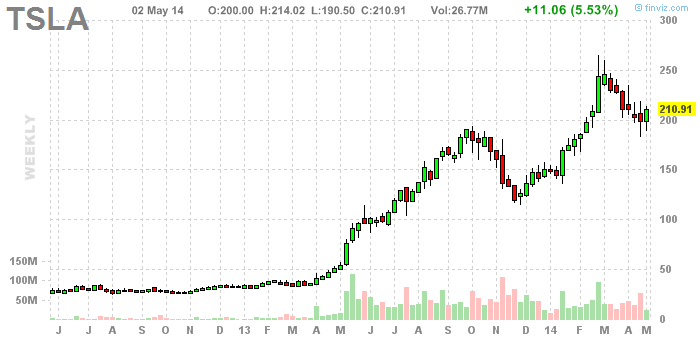
Tesla wanted to sell its cars directly to consumers. But this threatens the business model of car dealerships. So New Jersey’s franchise auto dealers association successfully got the state to make a ruling that prohibited Tesla from selling its luxury electric vehicles directly to consumers.
And its not just in New Jersey. Auto dealers around the US have been lobbying their state governments to force Tesla to change its ways. Dealers like the existing system, and they don’t want other automakers to get any ideas.

So while Tesla can cry itself hoarse as to how a direct sales model is beneficial to its customers, it’s plan to disrupt the way in which cars are sold has been effectively stalled.
Read: Shut up and deal
Uber
Uber is a “ride-share” company that allows you to request, ride, and pay for a “taxi” all through your mobile phone. They have mobile apps that connects you with a driver who gets the GPS coordinates of your location. You can then track where the driver is on your mobile and usually, the car arrives within 15 minutes.
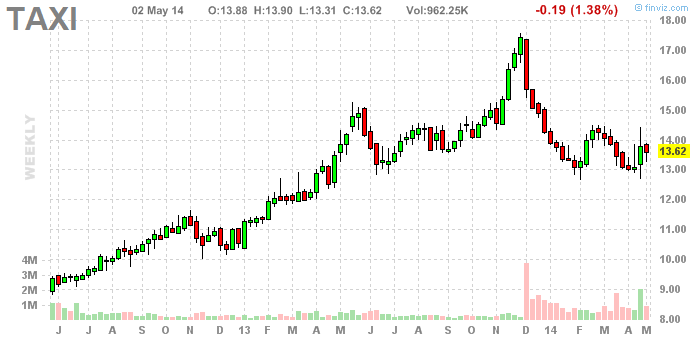
The problem is that taxis are tightly regulated and unionized. For example, in New York City, taxi “medallions” are auctioned off once a year and wanna-be taxi drivers pay as much as a million dollars for these rare and wonderful permits that give them the right to operate a taxi and pick up street hails. In fact, this business model is so profitable, that there’s actually a publicly listed firm that finances taxi medallions.

In Chicago, cab drivers are suing the city, arguing that the city is damaging and discriminating against them by refusing to enforce the same stringent regulations it has long imposed on the taxi industry on these newer “de facto taxi services,” which function “in all material respects as taxi companies.”
In France, there are plans to allow only existing taxis to use GPS services like Uber. Spanish taxi drivers are now calling for an Uber ban.
Some critics think that Uber is a race to the bottom, a way of ducking valuable regulations in place to ensure the quality of existing taxi services, slashing working class wages and simultaneously using tax loopholes to dodge paying their fair share into the system.
So while Uber can cry itself hoarse as to how it is bringing efficiency into the public transportation marketplace, its expansion plans are effectively bogged down by street fighting.
Read: Brace yourself for the European Uber war
Outbox
At least Tesla and Uber have huge war chests of venture capital to fight regulatory assaults against their business model. But not all startups are this lucky. Take Outbox for example. They wanted to allow consumers to digitize all of their postal mail so that individuals could get rid of junk mail, keep important things organized and never have to go out to their mailbox again. Customers would opt-in for $5 a month with “Outbox” to have their mail redirected, opened, scanned and available online or through a phone app. Consumers could then click on a particular scanned letter and ask that it be physically delivered, or that certain types of letters not be opened.
But the US Postal Service would have none of it. In the words of the Postmaster General himself: “You mentioned making the service better for our customers; but the American citizens aren’t our customers—about 400 junk mailers are our customers. Your service hurts our ability to serve those customers.”
Outbox decided to shutdown rather than take on the USPS.
Read: Outbox vs. USPS: How the Post Office Killed Digital Mail
Forgiveness vs. Permission
“It’s better to beg for forgiveness than to ask for permission.”
Eric Jackson, who was PayPal’s first marketing director, had this to say in the book The PayPal Wars: “Regulators say, ‘If we don’t know what you are, you must be dangerous, and later on we’ll figure out what we’ll call you.'” In 2002, Louisiana regulators nearly banned PayPal from operating in the state, sending the company a warning that it might be operating there illegally.
Paypal argued for years with officials over whether it was, or wasn’t, an illegal banking operation. Cut to the present, PayPal has licenses wherever it needs state approval and that has become a big part of its competitive advantage. But it had to sell itself to eBay in order to win the war.
Read: Who Killed PayPal?
A cash-strapped startup typically won’t have the patience, expertise or resources to ‘ask permission’ as such. Instead, they calculate that it’s better to move forward with bringing their product to market and deal with the consequences if and when they gain traction (because if they don’t gain traction, no one will come after them and it will all be moot anyway).
For example, in the music business, negotiating content licensing deals with record labels can take months. While the original Napster is one example where begging forgiveness didn’t pay off, there are successful startups that begged forgiveness once they had traction: iMeem, YouTube and MySpace.
Read: Digital Music Startups
Samsung first copied Nokia and then blatantly copied Apple. Four days ago a jury found Samsung guilty of patent infringement and ordered it to pay $290 million. A year ago another jury also ruled in Apple’s favor against Samsung, accessing $1.049 billion in damages. In the meantime, Samsung generated almost $30 billion in annual revenue in its IT & Mobile Communications Division. So that $1 billion and change penalty levied by two juries might be less than 2% of the annual revenue that mobile device sales generate for the company.
Read: The GoldieBlox playbook: Imitate Youtube and Samsung
What should disruptors do?
There’s life before meaningful traction and then there’s the life after. Disruptors can get away with a lot of things before they become a big enough target. But once they do, the biggest mistake is to assume that the competitive response will be through product innovation alone. Existing regulatory frameworks can be used by incumbents to put up a long and expensive fight and can be a significant source of their competitive advantage.
The way out of the dilemma: forget about permission, but start asking for forgiveness soon after you get traction.


