Author: shyam

Game Theory: Rajan vs. Government

Came across this incredible paper by Alan S. Binder, Issues in the Coordination of Monetary and Fiscal Policy, 1982 that uses game theory to explain the relationship between a country’s central bank and the government. It seemed appropriate, given that Raghuram Rajan, the RBI governor, is the same for both the UPA-2 and NDA governments, to study the options before both Rajan and the NDA in framing their relationship.

The paper was written when Regan was the President and Volcker was the chairman of the Federal Reserve. Inflation in 1980 had soared to 13.5% and Volcker had raised the federal funds rate to 20% by June 1981.

The feeling that Rajan and the government are at cross-purposes are echoed in the paper’s introduction:

Now, as often in the past, there are complaints from all quarters about the lack of coordination between monetary and fiscal policy. Indeed, the feeling that monetary and fiscal policies are acting at cross purposes is quite prevalent. This attitude, I think, reflects dissatisfaction with the current mix of expansionary fiscal policy and contractionary monetary policy, which pushes aggregate demand sideways while keeping interest rates sky high.

But how is this game played?

The game being played

The players in this game is Rajan, who sets interest rates, and the politicians, who determine the mix between government spending and tax revenues. Rajan thinks that the control of inflation is his primary responsibility and he’s anyway appointed for a fixed tenure. The politicians, on the other hand, have elections to win, which leads them to favor economic expansion over economic contraction.

The object of the game is for one player to force the other to make the unpleasant decisions. Rajan would prefer to have tax revenues exceed spending rather than to have the government suffer a budget deficit. The politicians, who worry about being elected, would prefer Rajan to keep interest rates low and the money supply ample. That policy would stimulate business activity and employment.

The preferences matrix

There are 3 decisions in front of each player: contract, do nothing, or expand. The numbers above the diagonal in each square represent the order of preference of Rajan; the numbers below the diagonals represent the order of preference of the politicians.

game theory RBI vs Government

The highest-ranked preferences of Rajan (A, B, and D) appear in the upper left-hand corner of the matrix, where at least one side is contractionary while the other is either supportive or does nothing to rock the boat. The three highest-ranked preferences of the politicians appear in the lower right-hand corner (F, H and I).

End game

Assuming that the relationship between Rajan and the politicians is such that collaboration and coordination are impossible, the game will end in the lower left-hand corner where monetary policy is contractionary and fiscal policy is expansionary. If Rajan cannot persuade the politicians to run a budget surplus and that the politicians cannot persuade Rajan to lower interest rates, neither side has any desire to alter its preferences nor can either dare to be simply neutral. As long as Rajan is contractionary and the politicians are expansionary, both sides are making the best of a bad bargain. And this is where we were under UPA-2.

The challenge, is to shift the play to the upper right hand corner. Here, neither side is “happy”, but this is the best case scenario – things are stable. This outcome is known as a Nash Equilibrium.

The Nash Equilibrium

Under the Nash Equilibrium the outcome, though stable, is less than optimal. Both sides would obviously prefer almost anything to this one. Yet they cannot reach a better bargain unless they drop their adversarial positions and work together on a common policy that would give each a supportive, or at least a neutral, role that would keep them from getting into each other’s way.

Will the budget provide the push to get us to the upper right hand corner? Only time will tell.

Sources:

  • Issues in the Coordination of Monetary and Fiscal Policy (pdf)
  • Early 1980s recession (Wikipedia)
  • Against the Gods: The Remarkable Story of Risk (Amazon)

Broker’s Call: Lucky 16 for 100%

DOOD…

MoneyControl combined the calls of different brokers who recommended them for 100% returns in a slideshow.

… YA PAANI?

We have created a Theme containing an equally weighted portfolio of stocks contained in this report: Lucky 13: Brokerages betting on these stocks for 100% returns

You can now follow the Theme, keep track of its performance, risk metrics etc. and answer the question yourself: Dood, ya Paani?

Monthly Recap: You and Your Research

world equity markets 2014-05-30.2014-06-30

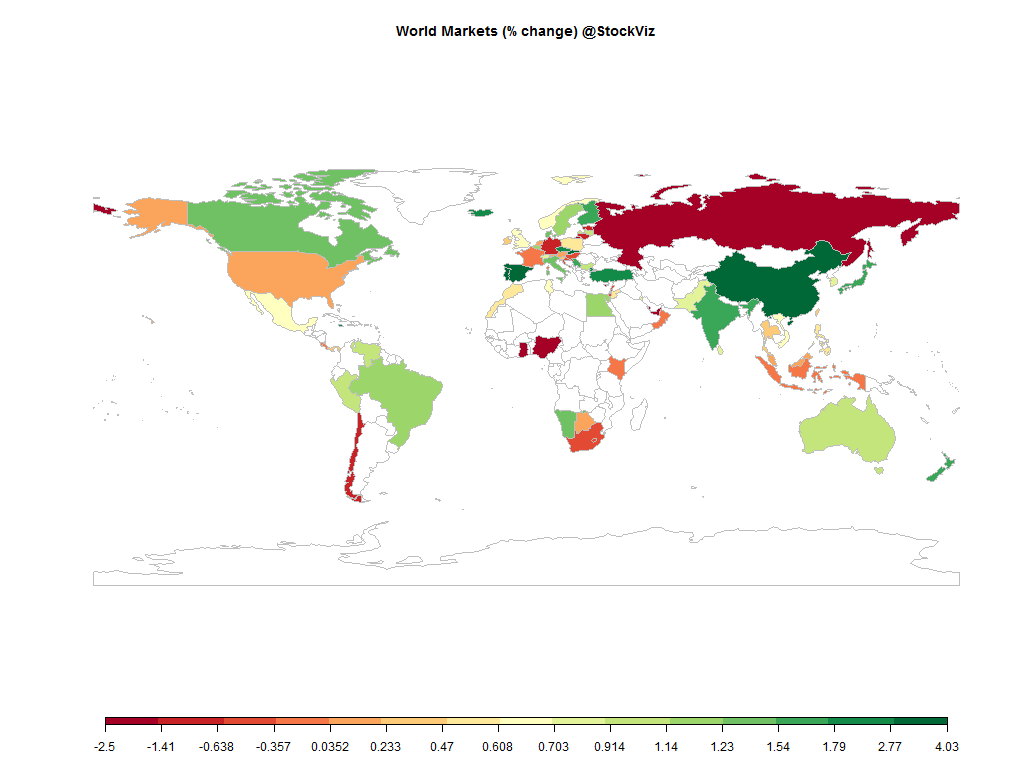
The Nifty ended the month a whopping +5.28% (+3.42% in USD terms)

Equities

Major
DAX(DEU) -1.11%
CAC(FRA) -2.14%
UKX(GBR) -1.47%
NKY(JPN) +4.80%
SPX(USA) +2.06%
MINTs
JCI(IDN) -0.54%
INMEX(MEX) +2.20%
NGSEINDX(NGA) +2.43%
XU030(TUR) -1.07%
BRICS
IBOV(BRA) +3.32%
SHCOMP(CHN) +0.28%
NIFTY(IND) +5.55%
INDEXCF(RUS) +2.85%
TOP40(ZAF) +2.98%

Commodities

Energy
Brent Crude Oil +2.92%
Ethanol -10.38%
Heating Oil +3.42%
Natural Gas -2.66%
RBOB Gasoline +1.63%
WTI Crude Oil +2.98%
Metals
Copper +1.59%
Gold 100oz +6.58%
Palladium +1.06%
Platinum +2.49%
Silver 5000oz +12.83%

Currencies

USDEUR:-0.34% USDJPY:-0.29%

MINTs
USDIDR(IDN) +1.21%
USDMXN(MEX) +0.95%
USDNGN(NGA) -0.18%
USDTRY(TUR) +1.16%
BRICS
USDBRL(BRA) -1.31%
USDCNY(CHN) -0.71%
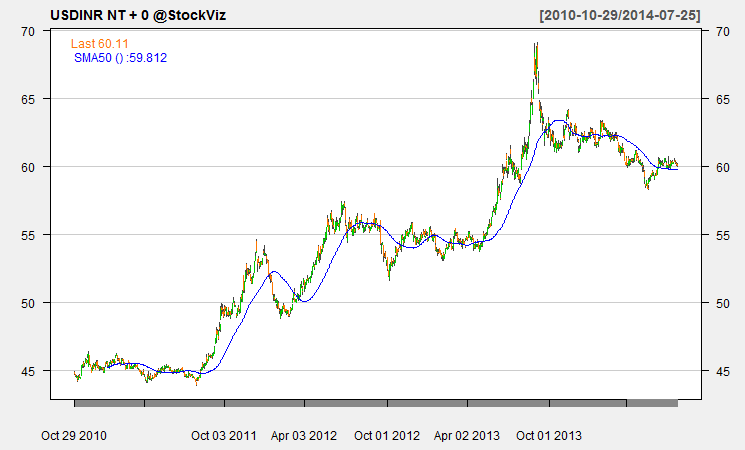
USDINR(IND) +1.79%
USDRUB(RUS) -2.62%
USDZAR(ZAF) +0.49%
Agricultural
Cattle +11.07%
Cocoa +1.54%
Coffee (Arabica) -2.68%
Coffee (Robusta) +6.90%
Corn -9.97%
Cotton -7.64%
Feeder Cattle +9.12%
Lean Hogs +16.89%
Lumber +8.05%
Orange Juice -11.85%
Soybean Meal -8.93%
Soybeans -6.41%
Sugar #11 -4.26%
Wheat -10.15%
White Sugar +0.40%

Nifty Heatmap

CNX NIFTY.2014-05-30.2014-06-30

Index performance

indexperformance.2014-05-30.2014-06-30

Top winners and losers

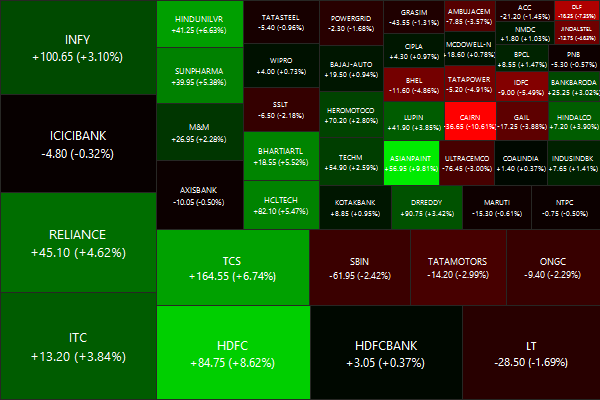
GAIL +22.56%
RELCAPITAL +24.02%
BHARATFORG +24.79%
MCDOWELL-N -14.98%
UBL -7.46%
M&M -7.15%
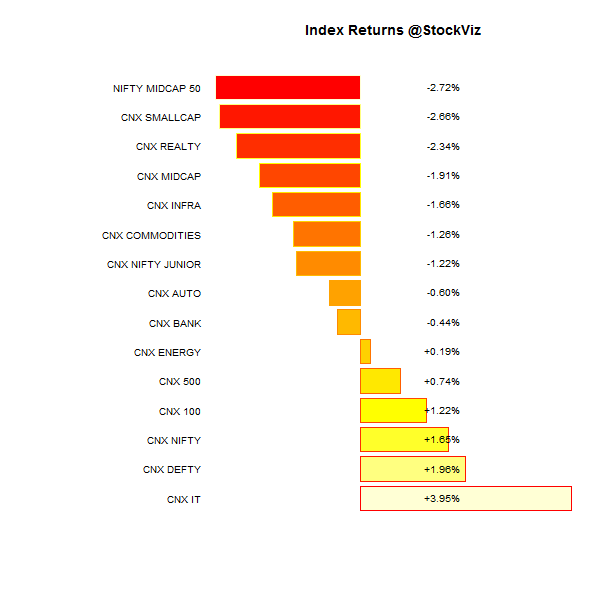
A pretty board-based rally…

ETFs

BANKBEES +9.16%
JUNIORBEES +6.06%
NIFTYBEES +5.65%
PSUBNKBEES +5.25%
INFRABEES +4.93%
GOLDBEES +4.60%
No ETF left behind!

Investment Theme Performance

All strategies ended in the green this month.

Sector Performance

sectorperformance.2014-05-30.2014-06-30

Yield Curve

yieldCurve.2014-05-30.2014-06-30

Interbank lending rates

mibor.30days.2014-06-30

Thought to Sum up the Month

“Knowledge and productivity are like compound interest.” Given two people of approximately the same ability and one person who works ten percent more than the other, the latter will more than twice outproduce the former. The more you know, the more you learn; the more you learn, the more you can do; the more you can do, the more the opportunity – it is very much like compound interest.

Source: You and Your Research, by Richard Hamming

Broker’s Call: Top 10 Agri Stocks

Dood…

Microsec Capital identified 10 agricultural companies which, they believe, will outperform in the medium-to-long term. (ET)

… Ya Paani?

We have created a Theme containing an equally weighted portfolio of stocks contained in this report: Microsec’s Top 10 Agri Stocks

You can now follow the Theme, keep track of its performance, risk metrics etc. and answer the question yourself: Dood, ya Paani?

Weekly Recap: Single-Variable Analysis

Equities

world.2014-06-20.2014-06-27

The Nifty ended flat for the week.

Major
DAX(DEU) -1.72%
CAC(FRA) -2.30%
UKX(GBR) -0.99%
NKY(JPN) -1.66%
SPX(USA) -0.07%
MINTs
JCI(IDN) -0.05%
INMEX(MEX) -1.19%
NGSEINDX(NGA) +2.57%
XU030(TUR) -0.10%
BRICS
IBOV(BRA) -2.82%
SHCOMP(CHN) +0.49%
NIFTY(IND) -0.04%
INDEXCF(RUS) -0.60%
TOP40(ZAF) -1.48%

Commodities

Energy
Brent Crude Oil -1.19%
Ethanol +1.34%
Heating Oil -1.65%
Natural Gas -2.05%
RBOB Gasoline -0.79%
WTI Crude Oil -1.44%
Metals
Copper +0.96%
Gold 100oz +0.05%
Palladium +2.27%
Platinum +1.59%
Silver 5000oz -0.48%

Currencies

USDEUR:-0.42% USDJPY:-0.71%

MINTs
USDIDR(IDN) +0.18%
USDMXN(MEX) -0.23%
USDNGN(NGA) -0.09%
USDTRY(TUR) -0.82%
BRICS
USDBRL(BRA) -1.78%
USDCNY(CHN) -0.12%
USDINR(IND) -0.17%
USDRUB(RUS) -2.16%
USDZAR(ZAF) -0.88%
Agricultural
Cattle +3.71%
Cocoa +1.17%
Coffee (Arabica) -2.02%
Coffee (Robusta) +1.76%
Corn -1.94%
Cotton -8.32%
Feeder Cattle +3.80%
Lean Hogs +2.27%
Lumber +3.05%
Orange Juice -9.38%
Soybean Meal +3.00%
Soybeans +1.71%
Sugar #11 -5.08%
Wheat -0.21%
White Sugar -2.30%

Nifty heatmap

CNX NIFTY.2014-06-20.2014-06-27

Index returns

indexperformance.2014-06-20.2014-06-27

Top winners and losers

FEDERALBNK +6.45%
DIVISLAB +8.55%
BOSCHLTD +9.92%
MCDOWELL-N -7.08%
KOTAKBANK -6.96%
IDEA -6.01%
A mixed bag, but Bosch was on fire this week!

ETFs

BANKBEES +2.90%
JUNIORBEES +1.34%
PSUBNKBEES +0.04%
NIFTYBEES -0.18%
GOLDBEES -0.33%
INFRABEES -4.78%
Banks got back on the saddle…

Investment Theme Performance

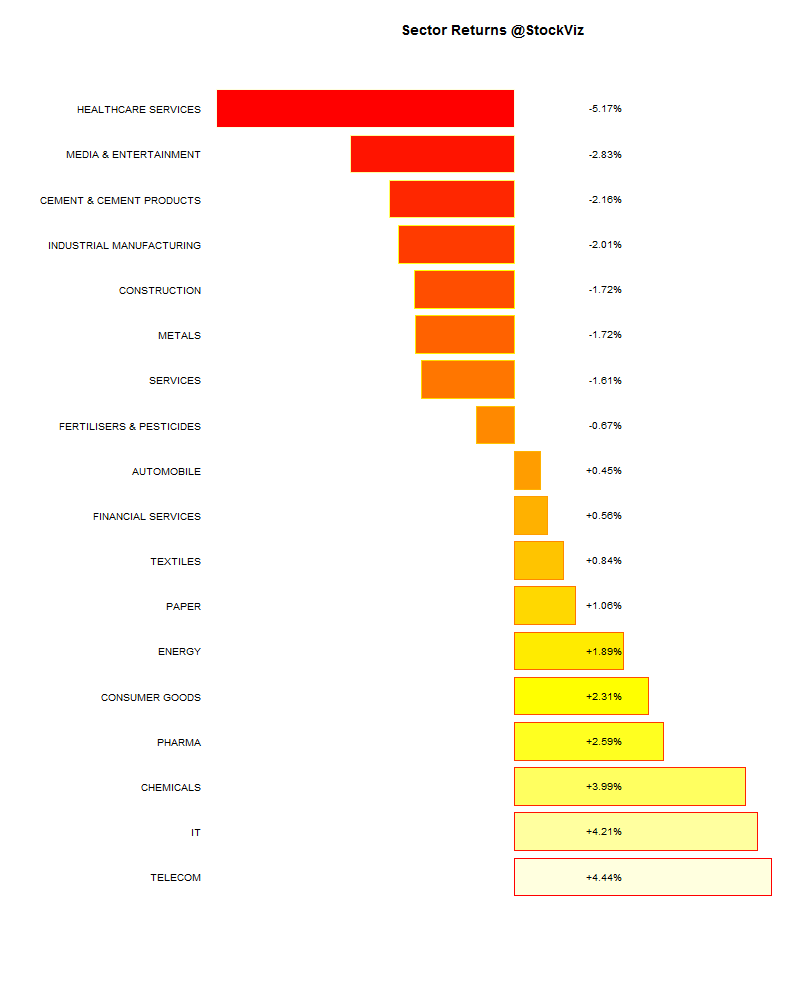
Sector Performance

sectorperformance.2014-06-20.2014-06-27

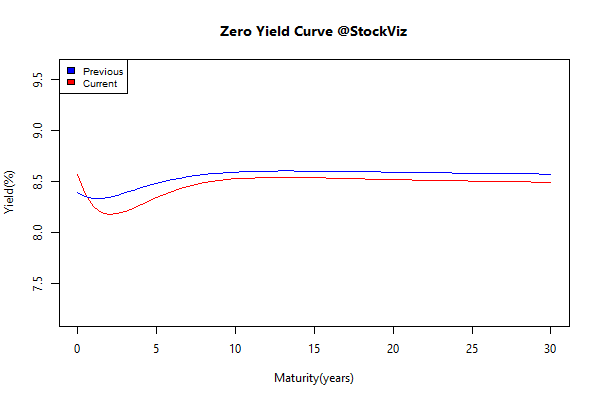
Yield Curve

yieldCurve.2014-06-20.2014-06-27

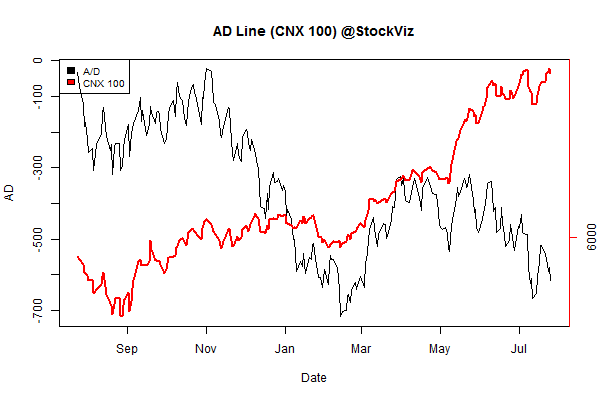
Advance Decline

advance.decline.line2.2014-06-20.2014-06-27

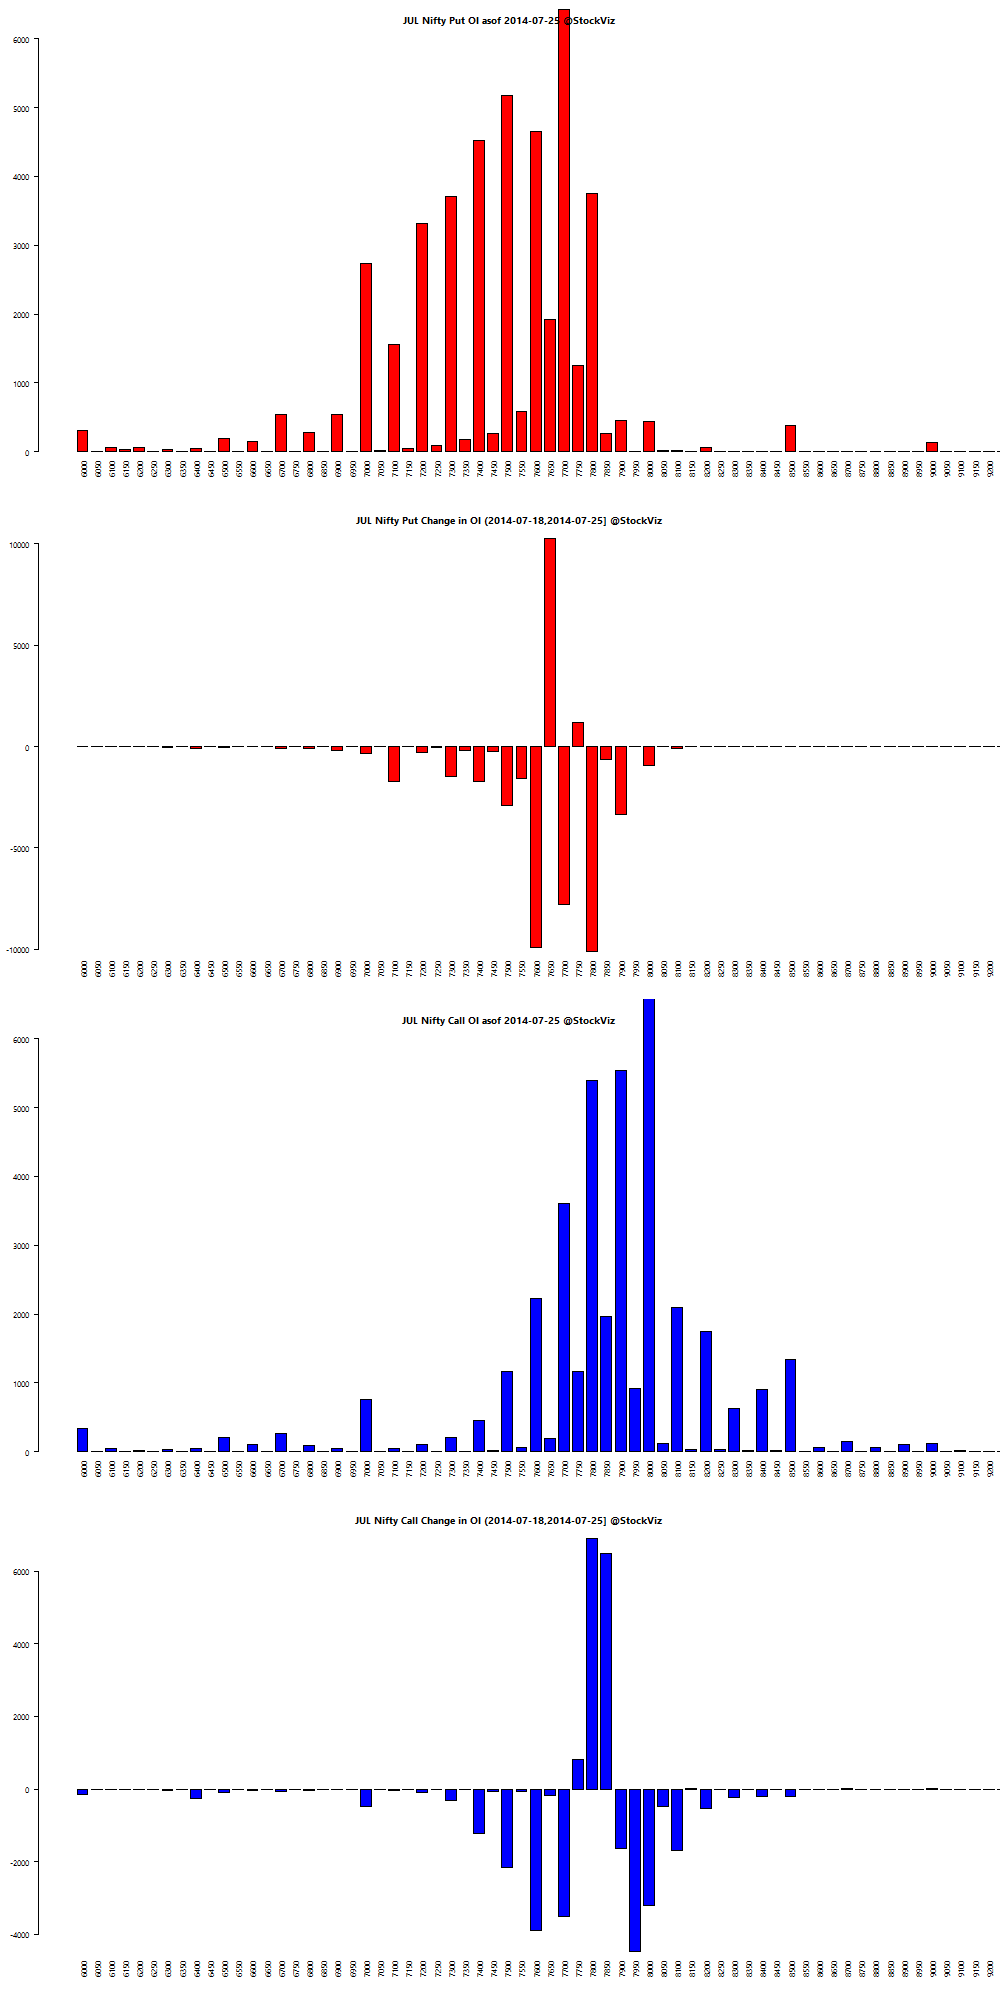
Nifty OI

nifty.puts.calls.JUL.2014-06-20.2014-06-27

Thought for the Weekend

The behavior of markets or economies simply can’t be explained by looking at just one thing. conomies and markets are extremely complex. They have a variety of different inputs, including earnings, interest rates, psychology, economic activity, fund flows, taxes, sentiment, momentum, geopolitics, etc. The relevant significance of all of these inputs varies over time.

Source: When Correlations Lie

Related: Musings on stock-market forecasts