Author: shyam

Trending Momentum

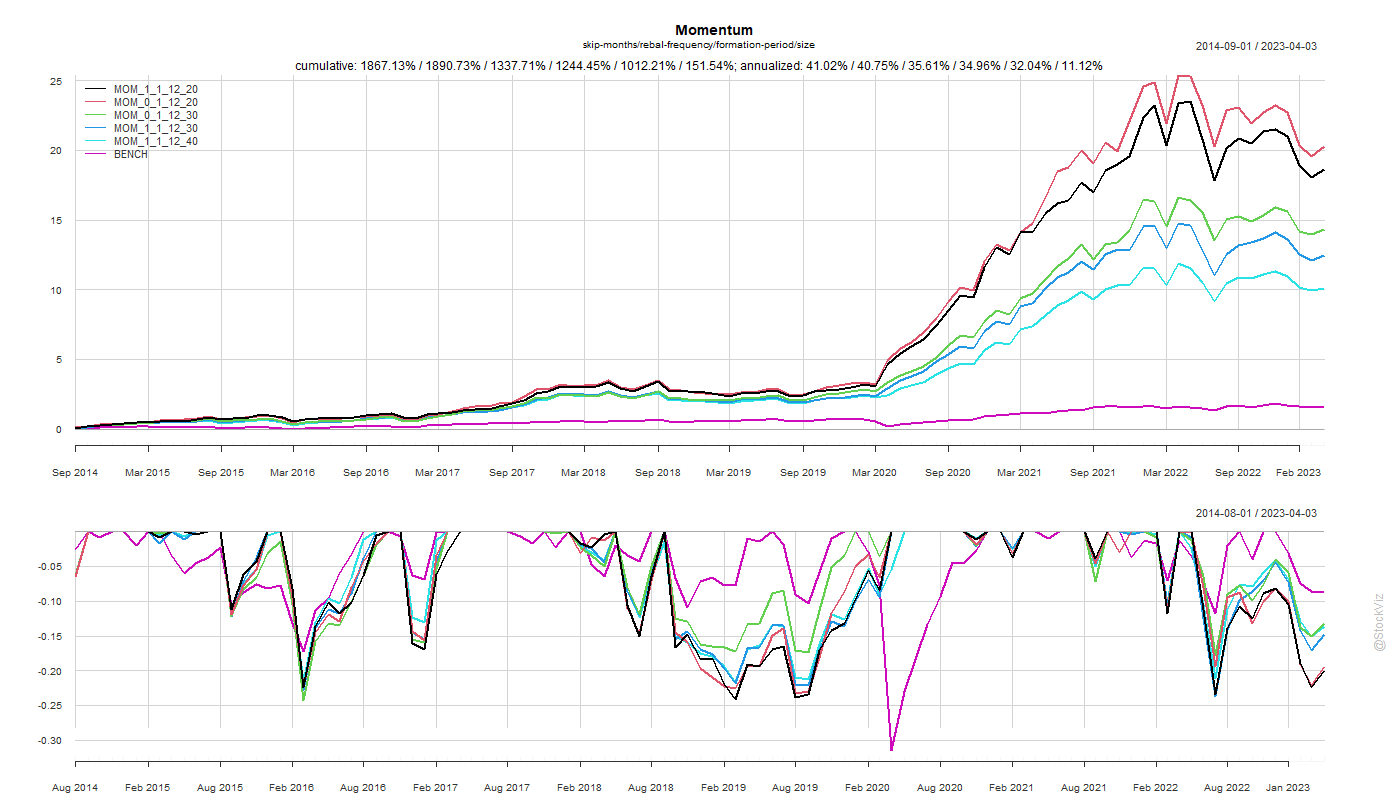
Can a simple moving-average be used to time momentum indices? Returns from 2010 through 2015 of NIFTY MIDCAP150 MOMENTUM 50 TR and NIFTY200 MOMENTUM 30 TR under different SMA strategies look like this:

It appears the moving averages with short lookbacks can at least help reduce drawdowns, if not boost returns. If you pick the “best” config from the dataset and apply it across data from 2016 through 2022, it looks promising.

Should expect trend returns to be much lower after incorporating taxes and transaction costs but the lower drawdowns merit a closer look.

Given how our trend-midcap strategy has performed, we expect trend effects to be stronger in midcap-momentum than in the largecap version.

Code and charts: github

Volatility and Returns of Momentum Indices

The standard deviation over 200-days and future 20-day returns from 2010 through 2015 of NIFTY MIDCAP150 MOMENTUM 50 TR and NIFTY200 MOMENTUM 30 TR looks like this:

Can historical volatility, as measured by standard deviation, be used to enter and exit momentum strategies?

On a rolling basis, there doesn’t seem to be a strong correlation between historical volatility and future returns. Back-tests over this period might give you a config that might look like it works but it is probably a fluke.

Given that liquid ETFs for these indices are not available and we are stuck with index funds for the foreseeable future, we setup a back-test to calculate the 200-day std. dev. at the end of each month to decide whether to hold it for the next month. Needless to say, the results were pretty lackluster.

We chose the 2010-2015 period because it avoids the 2008 crash and the subsequent recovery. The back-tests look phenomenal when you include that data but we wanted to see how such a strategy would perform in “normal” markets before stress-testing it. We don’t want to be the generals always fighting the last war.

Code & charts: github

Related:

Adventures in Pattern Matching, Part I

Hypothesis: If a price segment is similar to a set of historical segments, then there should be a correlation between historical and future returns.

Setup: Take 60-minute segments of 1-minute bars. Match them with 200 of the most recent days’ with times aligned. Take the top 40 days with the closest match and calculate their median next 30-minute returns. Plot the median vs. actual.

Simplifications:

  1. Non-overlapping segments. Its can be argued that patterns don’t start and stop and perfectly aligned boundaries.
  2. Most-recent 200 day look-back period. What if that’s not enough? Or too much?
  3. 30-minute prediction. Too short? Too long?

Verdict: There is no discernable relationship.

Code: github

Related: Euclidean Distance for Pattern Matching

Book Review: Wanting

In Wanting: The Power of Mimetic Desire in Everyday Life (Amazon,) Luke Burgis lays out the “why” behind why we want things.

The gist of it is that we want things that we think others want. Everything else flows from it.

Desire is manufactured. Just look at the influencer marketing industry that grew from $1.7 billion in 2016 to $9.7 billion in 2020 and $13.8 billion in 2021. You might think that it doesn’t affect you but desire is our primordial concern. Long before people can articulate why they want something, they start wanting it.

Are we destined to me miserable, running in an hamster-wheel of desire? The book presents some things that you could try.

Recommendation: Worth flipping through.

Volume Clock, Candles

Our previous post showed how a chrono-clock frequency can be translated into a volume-clock frequency. The aggregated High-Low price data looks very similar to a candle-stick chart.

The difference between the high and the low on each “candle” of the longest living contract doesn’t vary a lot between the two clocks.

The distribution is based on a month’s worth of streaming data. As we accumulate more data points, it is likely that the divergence between the Chrono-Clock and the Volume-Clock increases.