Conventional wisdom has it that RSI values over 70 to represent overbought market conditions and under 30 to represent oversold market conditions. But where did these numbers, 70 and 30, come from? We already tested two naive RSI strategies that bombed spectacularly. We were curious as to what an SVM (Support Vector Machine) would do if we gave it a 14 day RSI and 50-day SMA of the Nifty index. This is what came out of it:
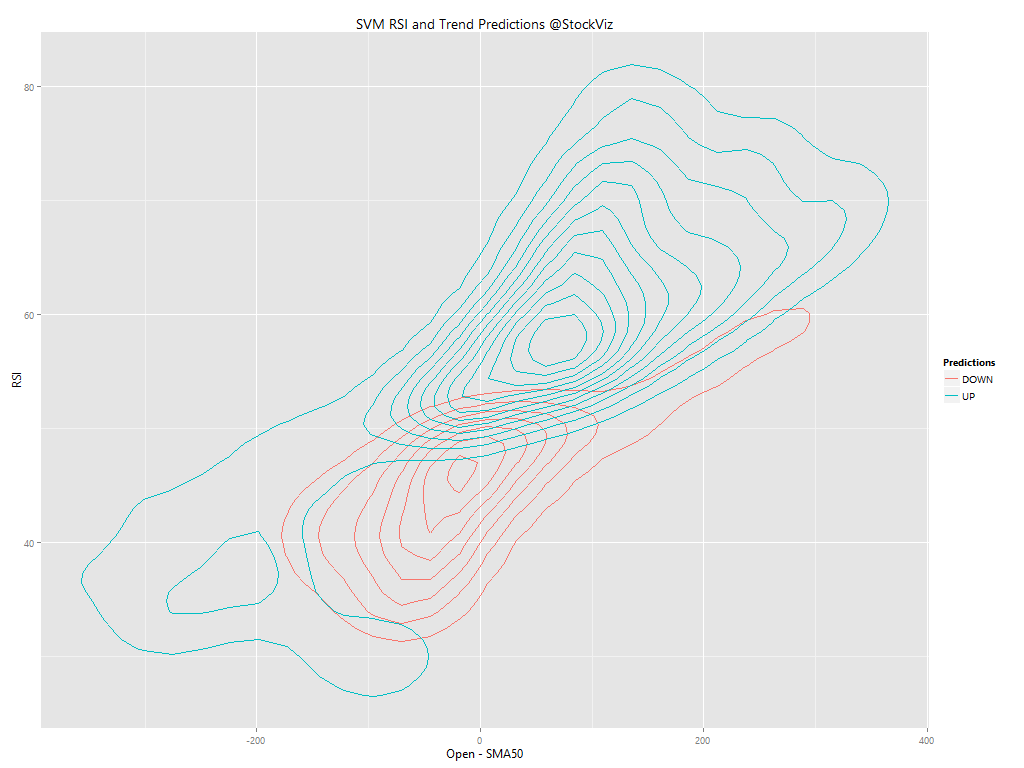
The bifurcation between long and short is pretty well defined. And is seems that trend overshadows RSI. Is RSI even relevant?