Author: shyam

Weekly Recap: Conflicts

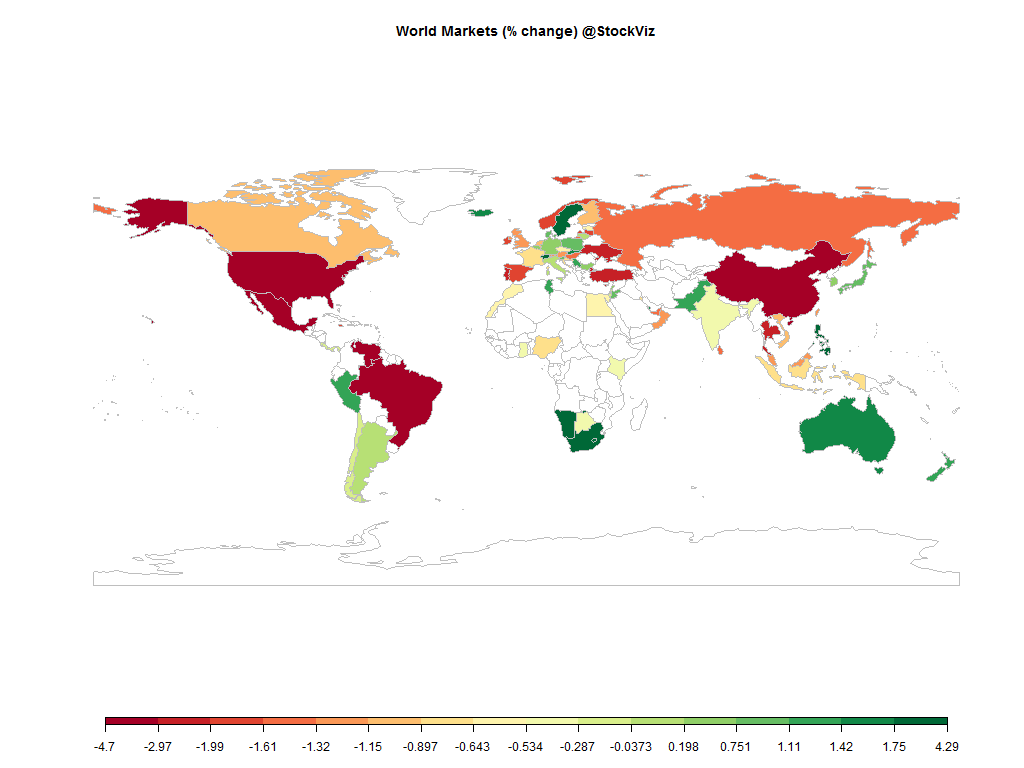
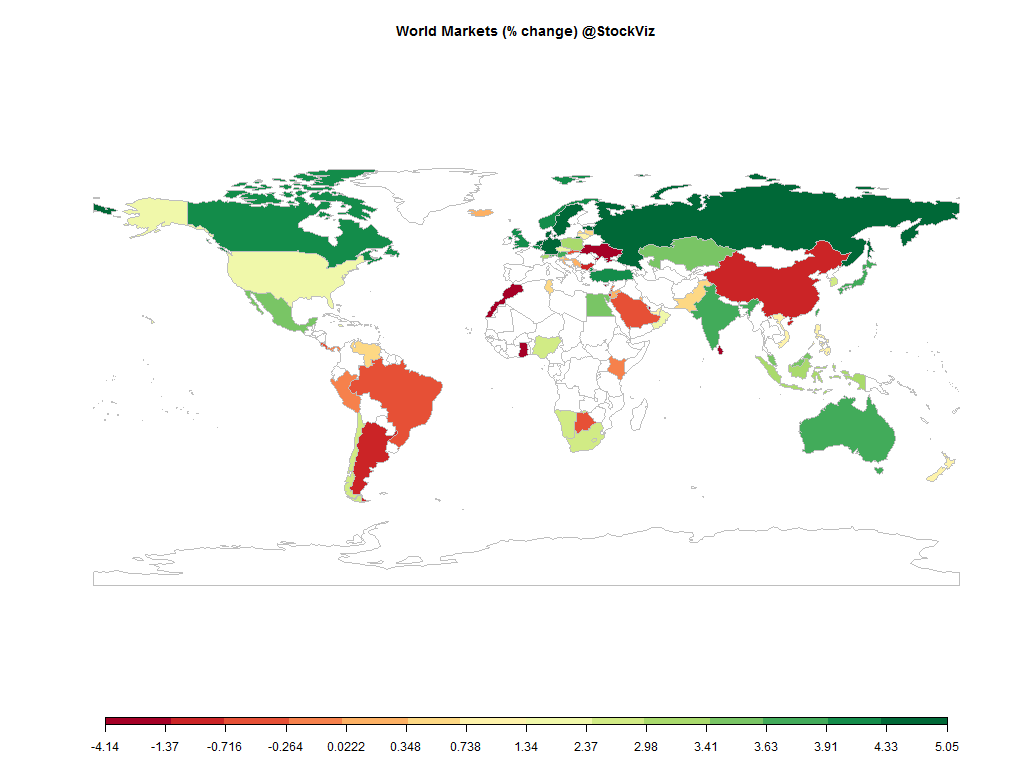
world.2014-12-12.2014-12-19

Equities

Major
DAX(DEU) +2.00%
CAC(FRA) +3.23%
UKX(GBR) +3.88%
NKY(JPN) +1.44%
SPX(USA) +2.42%
MINTs
JCI(IDN) -0.31%
INMEX(MEX) +2.18%
NGSEINDX(NGA) -1.49%
XU030(TUR) +0.92%
BRICS
IBOV(BRA) +3.43%
SHCOMP(CHN) +5.80%
NIFTY(IND) +0.01%
INDEXCF(RUS) -0.72%
TOP40(ZAF) +2.96%

Commodities

Energy
Ethanol -5.78%
WTI Crude Oil -0.41%
RBOB Gasoline -1.60%
Brent Crude Oil -1.00%
Heating Oil -2.34%
Natural Gas -8.76%
Metals
Gold 100oz -2.18%
Palladium -1.18%
Platinum -2.83%
Copper -0.68%
Silver 5000oz -7.02%

Currencies

USDEUR:+1.82% USDJPY:+0.64%

MINTs
USDIDR(IDN) +0.24%
USDMXN(MEX) -0.68%
USDNGN(NGA) +0.83%
USDTRY(TUR) +0.75%
BRICS
USDBRL(BRA) +0.32%
USDCNY(CHN) +0.53%
USDINR(IND) +1.61%
USDRUB(RUS) +2.29%
USDZAR(ZAF) -0.08%
Agricultural
Cocoa +3.59%
Corn +3.53%
Soybean Meal -3.96%
Soybeans -1.39%
Coffee (Arabica) +0.57%
Cotton +0.12%
Feeder Cattle -2.39%
Orange Juice -5.25%
Sugar #11 -0.40%
Wheat +0.88%
Cattle -0.34%
Coffee (Robusta) -2.21%
Lean Hogs -6.49%
Lumber +0.29%
White Sugar +0.10%

Credit Indices

Index Change
Markit CDX EM -0.30%
Markit CDX NA HY +0.52%
Markit CDX NA IG +0.73%
Markit iTraxx Asia ex-Japan IG +8.59%
Markit iTraxx Australia +7.20%
Markit iTraxx Europe +4.16%
Markit iTraxx Europe Crossover +16.58%
Markit iTraxx Japan +2.11%
Markit iTraxx SovX Western Europe +2.94%
Markit LCDX (Loan CDS) -0.18%
Markit MCDX (Municipal CDS) +2.46%
All I can say about this week is that I am glad that its over.
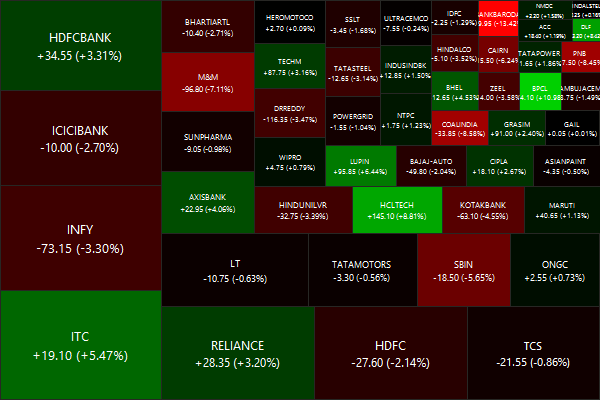
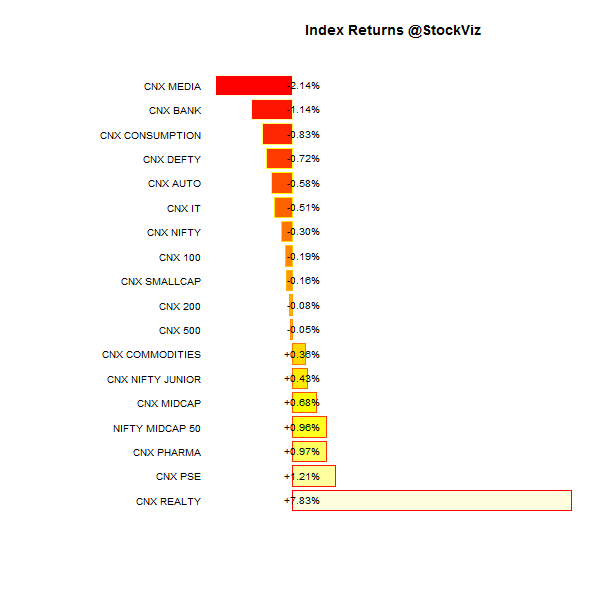
The NIFTY ended flat for the week but that hides the roller-coaster ride it put investors through. After all the oil-related panic, the S&P ended up more than 2% for the week.
Oil ended down, dollar up.
Hopefully Santa visits before expiry.

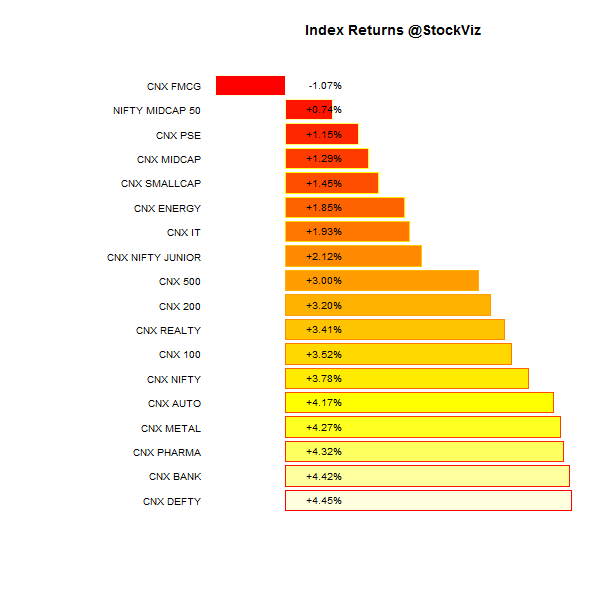
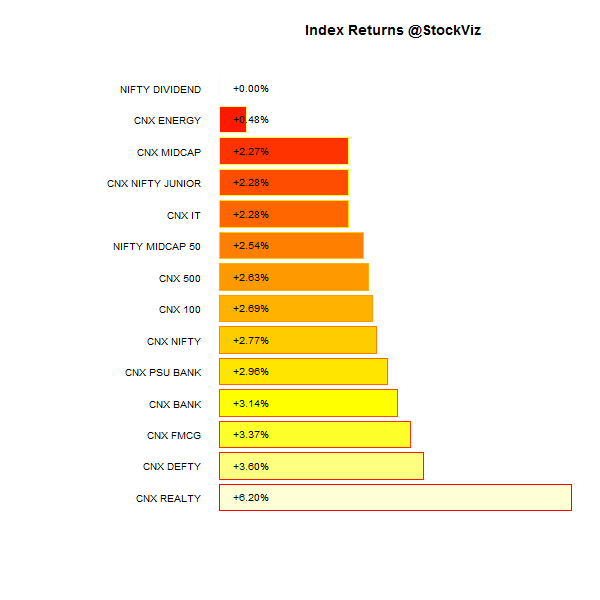
Index Returns

index performance.2014-12-12.2014-12-19

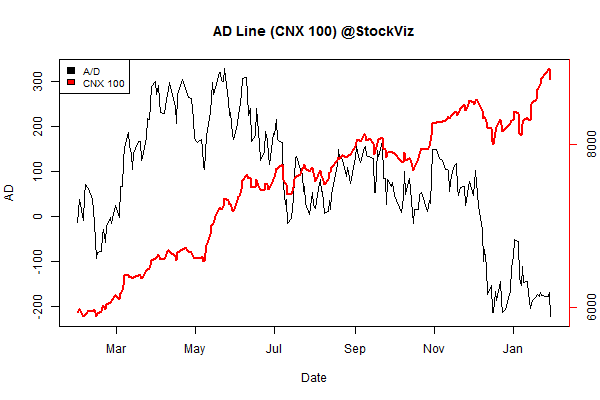
Advance Decline

advance.decline.line2.2014-12-12.2014-12-19

Market Cap Decile Performance

Decile Mkt. Cap. Adv/Decl
1 (micro) -6.25% 63/74
2 -3.65% 63/73
3 -2.93% 64/73
4 -2.21% 61/75
5 -3.07% 63/73
6 -1.98% 65/72
7 -2.00% 56/80
8 -1.38% 64/73
9 -1.17% 64/72
10 (mega) -0.01% 68/69
The sell-off was brutal below the mega-caps…

Top Winners and Losers

ZEEL +5.45%
PETRONET +6.27%
PFC +8.11%
DLF -13.19%
BAJAJHLDNG -8.34%
RCOM -7.32%
Broad based action saw a mix of winners and losers…

ETF Performance

CPSEETF +3.32%
BANKBEES +0.98%
INFRABEES +0.54%
NIFTYBEES -0.03%
JUNIORBEES -0.22%
GOLDBEES -0.99%
PSUBNKBEES -1.93%
Banks withstood the onslaught well…

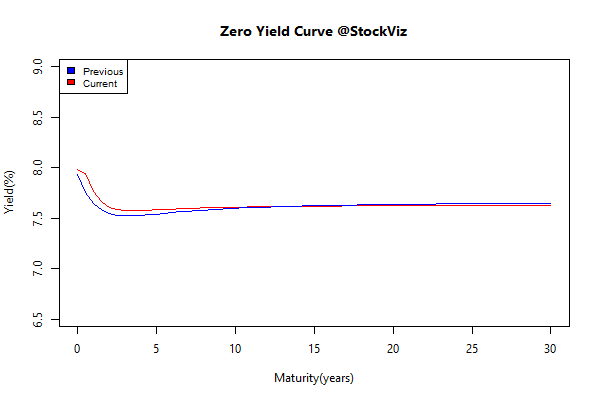
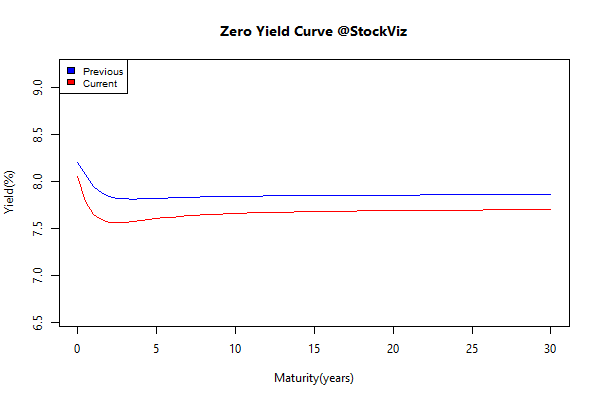
Yield Curve

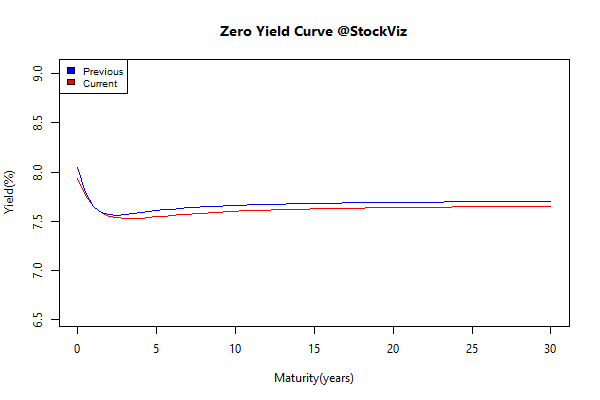
yield Curve.2014-12-12.2014-12-19

Bond Indices

Sub Index Change in YTM Total Return(%)
GSEC TB +0.44 +0.04%
GSEC SUB 1-3 +0.43 -0.43%
GSEC SUB 3-8 +0.19 -0.53%
GSEC SUB 8 +0.08 -0.34%
Yields went up – breaking a long streak of falling rates.

Investment Theme Performance

Thought for the weekend

Asset managers and asset owners have a relationship beset with natural conflicts.

  1. Asset owners want fees below 10 bps; asset managers prefer “2% + 20%.”
  2. Asset owners want transparency; asset managers favor black-box opacity.
  3. Asset owners want simplicity; asset managers hire rocket scientists to create complex optimized solutions for sex appeal.
  4. Asset owners want “future” outperformance after they fund a manager; asset managers would be satisfied with strong past outperformance to facilitate future asset gathering.
  5. Asset owners want a bigger alpha; asset managers would happily sell them the possibility of alpha and charge handsomely for the service of selling hope.

Source: The Promise of Smart Beta

Weekly Recap: They’re all making it up

world.2014-12-05.2014-12-12

Equities

Major
DAX(DEU) -4.88%
CAC(FRA) -7.03%
UKX(GBR) -6.56%
NKY(JPN) -3.06%
SPX(USA) -3.61%
MINTs
JCI(IDN) -0.53%
INMEX(MEX) -3.90%
NGSEINDX(NGA) -7.42%
XU030(TUR) -2.58%
BRICS
IBOV(BRA) -7.42%
SHCOMP(CHN) +0.02%
NIFTY(IND) -3.68%
INDEXCF(RUS) -4.55%
TOP40(ZAF) -3.36%

Commodities

Energy
RBOB Gasoline -10.98%
Ethanol -3.18%
Natural Gas -0.87%
WTI Crude Oil -13.42%
Brent Crude Oil -11.22%
Heating Oil -5.34%
Metals
Copper +0.34%
Gold 100oz +2.74%
Palladium +1.51%
Platinum +0.66%
Silver 5000oz +5.56%

Currencies

USDEUR:-1.39% USDJPY:-2.31%

MINTs
USDIDR(IDN) +1.37%
USDMXN(MEX) +2.25%
USDNGN(NGA) -0.98%
USDTRY(TUR) +1.61%
BRICS
USDBRL(BRA) +2.24%
USDCNY(CHN) +0.59%
USDINR(IND) +0.83%
USDRUB(RUS) +10.19%
USDZAR(ZAF) +2.05%
Agricultural
Corn +4.55%
Cotton -0.49%
Lean Hogs -4.11%
Wheat +3.80%
Cocoa -3.08%
Sugar #11 -0.92%
White Sugar -1.09%
Coffee (Arabica) -2.77%
Feeder Cattle -4.18%
Orange Juice +4.01%
Soybean Meal -3.86%
Cattle -2.12%
Coffee (Robusta) -4.66%
Lumber +0.24%
Soybeans +1.82%

Credit Indices

Index Change
Markit CDX EM -2.51%
Markit CDX NA HY -1.44%
Markit CDX NA IG +6.32%
Markit iTraxx Asia ex-Japan IG +1.58%
Markit iTraxx Australia +2.31%
Markit iTraxx Europe +2.14%
Markit iTraxx Europe Crossover +18.62%
Markit iTraxx Japan +2.77%
Markit iTraxx SovX Western Europe +0.48%
Markit LCDX (Loan CDS) -0.37%
Markit MCDX (Municipal CDS) +2.93%
It was a brutal week at the markets. All major indices went down like a rock. Dollar rallied and the precious metal complex found a bid. The energy sector is like a drunk grouping in the dark for a bottom. But don’t you worry, SEBI will soon some up with a rule where your broker will have to send you a bag of cash whenever you lose money in the markets.

Nifty Heatmap

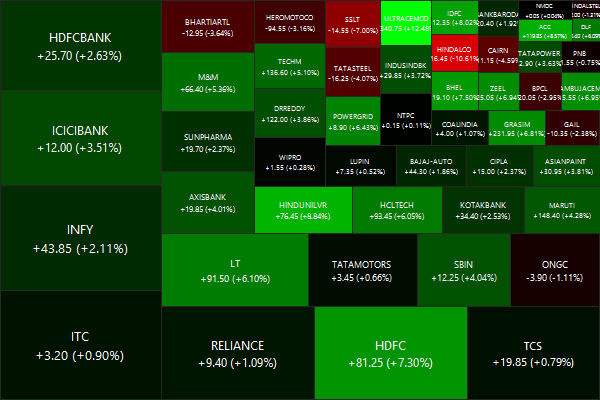
CNX NIFTY.2014-12-05.2014-12-12

Index Returns

index performance.2014-12-05.2014-12-12

Sector Performance

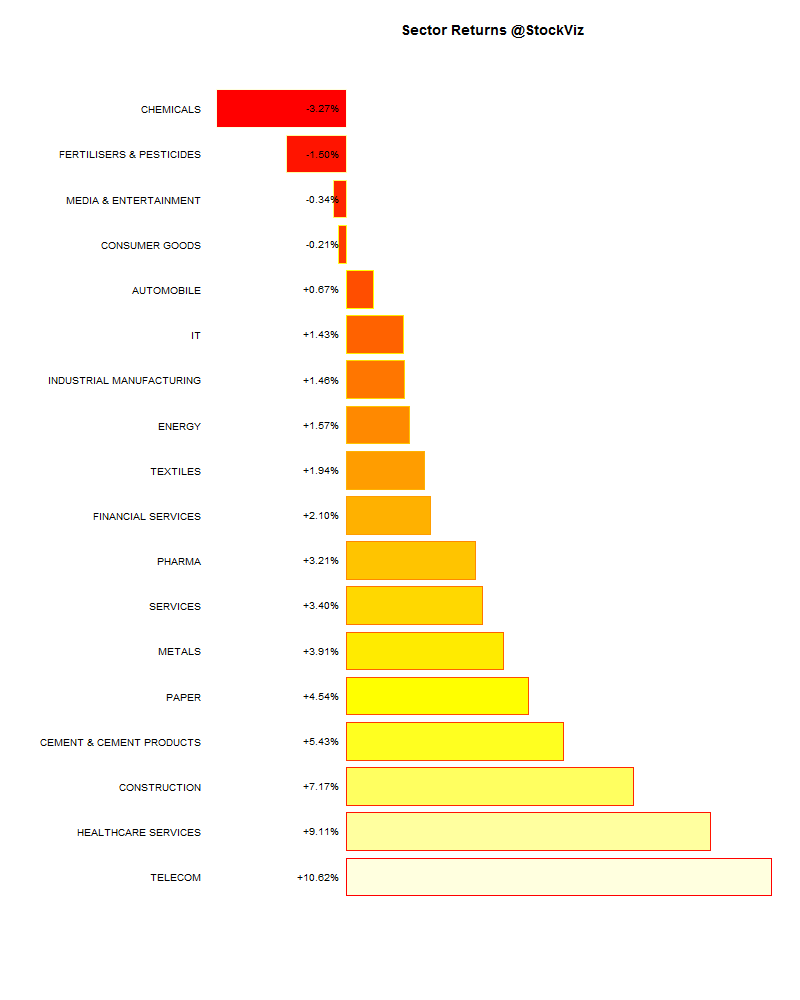
sector performance.2014-12-05.2014-12-12

Advance Decline

advance.decline.line2.2014-12-05.2014-12-12

Market Cap Decile Performance

Decile Mkt. Cap. Adv/Decl
1 (micro) -7.17% 67/72
2 -4.35% 62/77
3 -4.12% 55/84
4 -4.96% 56/83
5 -5.77% 54/85
6 -5.63% 61/78
7 -4.51% 61/79
8 -3.75% 66/72
9 -4.15% 68/71
10 (mega) -3.60% 74/66
Maximum pain in the lower market cap tiers…

Top Winners and Losers

AUROPHARMA +2.74%
RANBAXY +4.10%
INFRATEL +9.98%
RCOM -12.68%
TATASTEEL -12.67%
SSLT -10.69%
Select “Story” stocks ended the week in the green.

ETF Performance

GOLDBEES +2.44%
PSUBNKBEES -2.50%
BANKBEES -3.04%
NIFTYBEES -3.82%
JUNIORBEES -3.87%
CPSEETF -4.86%
INFRABEES -7.22%
Nice to see gold in the green after weeks in the red.

Yield Curve

yield Curve.2014-12-05.2014-12-12

Bond Indices

Sub Index Change in YTM Total Return(%)
GSEC TB -0.10 +0.18%
GSEC SUB 1-3 -0.01 +0.35%
GSEC SUB 3-8 -0.17 +0.64%
GSEC SUB 8 -0.17 +0.89%
Falling inflation, slowing growth and a dash for safe assets.

Investment Theme Performance

Not a single strategy worked this week. Here’s to hoping for better days ahead…

Thought for the weekend

They’re watching market prices fluctuate and assigning meaning where none exists. Stories are being told and headlines are being crafted so that there is something for you to click on from your app when you check the news.

They’re giving you an ex-post description of the beliefs of your fellow guessers who are no better at explaining day-to-day randomness than you are.

Source: They’re all making it up.

Related: Why Do Models Beat Experts?

Re-factored Indices and Momentum

We have created a whole bunch of Themes based on indices published by the NSE. We call them Re-factored Indices because they use a weighting that is different from NSE’s. We currently have free-float cap weighted and equal weighted themes. Investors can now invest in standard indices directly, without having to go through an index fund.

These Themes are automatically re-balanced once a month. There is no discretion on what goes into them, the portfolio is decided by the NSE/IISL. Investors can use these to “set it and forget it.”

Long-term out performance

Some indices show persistent long-term out-performance. For example, MNCs have beaten PSEs (StockViz) and have shown to have lower draw-downs. Investors can map the MNC Theme and let NSE/IISL figure out what stocks should be part of that index.

Momentum

Short-term investors can use momentum effects to their advantage and implement a switching strategy. For example, CNX BANK shows greater momentum than CNX ENERGY:

CNX BANK

CNX ENERGY

And over the last week, momentum in CNX REALTY has improved drastically whereas CNX IT has decreased:

CNX IT

CNX REALTY

Conclusion

Re-factored Indices can act as ETF-proxies for long-term, passive investors and opens up interesting momentum strategies for short-term investors.

Weekly Recap: Is Risk Cheap?

world.2014-11-28.2014-12-05

Equities

Major
DAX(DEU) +1.06%
CAC(FRA) +0.67%
UKX(GBR) +0.30%
NKY(JPN) +2.64%
SPX(USA) +0.38%
MINTs
JCI(IDN) +0.74%
INMEX(MEX) -2.55%
NGSEINDX(NGA) -3.81%
XU030(TUR) -1.38%
BRICS
IBOV(BRA) -5.46%
SHCOMP(CHN) +9.50%
NIFTY(IND) -0.58%
INDEXCF(RUS) -0.29%
TOP40(ZAF) -0.75%

Commodities

Energy
Brent Crude Oil -2.76%
Ethanol -17.62%
Heating Oil -6.10%
Natural Gas -7.90%
RBOB Gasoline -7.91%
WTI Crude Oil -2.38%
Metals
Copper +1.74%
Gold 100oz +2.04%
Palladium -0.44%
Platinum +1.89%
Silver 5000oz +5.19%

Currencies

USDEUR:+1.24% USDJPY:+2.36%

MINTs
USDIDR(IDN) +0.77%
USDMXN(MEX) +3.26%
USDNGN(NGA) +0.89%
USDTRY(TUR) +1.82%
BRICS
USDBRL(BRA) +0.81%
USDCNY(CHN) +0.12%
USDINR(IND) -0.40%
USDRUB(RUS) +6.92%
USDZAR(ZAF) +2.52%
Agricultural
Cattle -2.85%
Coffee (Robusta) -2.81%
White Sugar -2.95%
Corn +1.46%
Sugar #11 -2.89%
Cocoa +3.07%
Lean Hogs -3.27%
Lumber +2.64%
Soybean Meal +1.38%
Wheat +5.19%
Coffee (Arabica) -4.20%
Cotton -0.96%
Feeder Cattle +1.23%
Orange Juice -2.05%
Soybeans +2.17%

Credit Indices

Index Change
Markit CDX EM -0.96%
Markit CDX NA HY -0.21%
Markit CDX NA IG +1.16%
Markit iTraxx Asia ex-Japan IG +0.70%
Markit iTraxx Australia +0.11%
Markit iTraxx Europe -1.46%
Markit iTraxx Europe Crossover -2.94%
Markit iTraxx Japan -2.13%
Markit iTraxx SovX Western Europe -0.97%
Markit LCDX (Loan CDS) +0.08%
Markit MCDX (Municipal CDS) +1.07%
The ECB did not announce the sovereign QE that everybody hoped for. Oil continued to tumble. Credit spreads seem to be sending out warning signals. The dollar rally continued, especially against oil producing currencies. Metals caught a breather.

Oil

oil

Index Returns

index performance.2014-11-28.2014-12-05

Advance Decline

advance.decline.line2.2014-11-28.2014-12-05

Market Cap Decile Performance

Decile Mkt. Cap. Adv/Decl
1 (micro) -0.09% 72/68
2 +1.65% 68/72
3 +2.01% 69/71
4 +1.81% 69/70
5 +1.60% 69/71
6 +1.34% 74/66
7 +2.57% 72/68
8 +2.78% 79/61
9 +2.26% 76/64
10 (mega) +0.03% 75/65
Midcaps outperformed large caps…

Top Winners and Losers

GLAXO +8.87%
SRTRANSFIN +9.10%
BAJAJFINSV +10.38%
SAIL -6.91%
HINDALCO -6.23%
DRREDDY -5.84%
SAIL turned out to be a classic value trap – moats eroded and its largest investor axed to get rid of it…

ETF Performance

JUNIORBEES +2.40%
PSUBNKBEES +2.12%
BANKBEES +1.69%
NIFTYBEES -0.21%
GOLDBEES -0.65%
CPSEETF -1.44%
INFRABEES -2.43%
The rally in banking stocks continued, outperforming the Nifty…

Yield Curve

yield Curve.2014-11-28.2014-12-05

Bond Indices

Sub Index Change in YTM Total Return(%)
GSEC TB -0.15 +0.19%
GSEC SUB 1-3 -0.08 +0.43%
GSEC SUB 3-8 -0.16 +0.67%
GSEC SUB 8 -0.19 +1.48%
The long bond continued to post gains – falling inflation and rate cuts backed in.

Investment Theme Performance

Value is back after a month long period of under-performance. Momentum 200 now references 20 stocks to reduce volatility.

Thought for the weekend

When people invest in lower-risk strategies, what they are really buying is the perception of lower risk. Risk is like the air in a long balloon, with the result that when anyone tries to squeeze it away in one area they only succeed in redistributing it – and building up extra pressure – elsewhere.

Thus, if investors are seeking to reduce the volatility of earning streams by buying certain businesses then all they are doing is increasing their risk elsewhere – namely in the elevated valuations they are now having to pay.

When one looks at valuations and the fact so many people are so worried about all the different risks they see in the world has led to risk itself being lowly valued. Ironically enough, one of the cheapest things you can find in the market these days and therefore with a reduced level of valuation risk… is risk.

Source: Why investors are wrong to think they can eliminate risk completely

Related: Risk, Volatility and Returns

Weekly Recap: Constraints make us better

world.2014-11-21.2014-11-28

Equities

Major
DAX(DEU) +2.55%
CAC(FRA) +0.99%
UKX(GBR) -0.42%
NKY(JPN) +0.59%
SPX(USA) +0.37%
MINTs
JCI(IDN) +0.74%
INMEX(MEX) -1.56%
NGSEINDX(NGA) +1.82%
XU030(TUR) +3.78%
BRICS
IBOV(BRA) -1.62%
SHCOMP(CHN) +7.88%
NIFTY(IND) +1.31%
INDEXCF(RUS) -0.34%
TOP40(ZAF) -2.31%

Commodities

Energy
Brent Crude Oil -11.89%
Ethanol +2.24%
Heating Oil -9.33%
Natural Gas -5.18%
RBOB Gasoline -10.86%
WTI Crude Oil -12.88%
Metals
Copper -6.84%
Gold 100oz -2.94%
Palladium +2.13%
Platinum -2.27%
Silver 5000oz -4.35%

Currencies

USDEUR:-0.54% USDJPY:+0.68%

MINTs
USDIDR(IDN) +0.49%
USDMXN(MEX) +2.12%
USDNGN(NGA) +0.85%
USDTRY(TUR) -0.07%
BRICS
USDBRL(BRA) +2.15%
USDCNY(CHN) +0.33%
USDINR(IND) +0.42%
USDRUB(RUS) +7.93%
USDZAR(ZAF) +0.91%
Agricultural
Coffee (Arabica) -1.68%
Soybeans -1.86%
Wheat +5.37%
White Sugar -3.37%
Cattle -1.01%
Coffee (Robusta) +1.30%
Corn +0.13%
Lumber -1.11%
Soybean Meal +4.13%
Cocoa +1.48%
Cotton +3.50%
Lean Hogs -0.91%
Feeder Cattle -2.09%
Orange Juice +3.69%
Sugar #11 -3.23%

Credit Indices

Index Change
Markit CDX EM +0.29%
Markit CDX NA HY +1.06%
Markit CDX NA IG -5.64%
Markit iTraxx Asia ex-Japan IG -5.64%
Markit iTraxx Australia -3.11%
Markit iTraxx Europe -4.96%
Markit iTraxx Europe Crossover -34.92%
Markit iTraxx Japan -0.26%
Markit iTraxx SovX Western Europe -1.73%
Markit LCDX (Loan CDS) -0.02%
Markit MCDX (Municipal CDS) -0.97%
The biggest news this week was OPEC’s non-cut and the subsequent collapse in oil prices. The US dollar continued to rally, precious metals weakened and Nigeria devalued their currency…

Nifty Heatmap

CNX NIFTY.2014-11-21.2014-11-28

Index Returns

index performance.2014-11-21.2014-11-28

Sector Performance

sector performance.2014-11-21.2014-11-28

Market Cap Decile Performance

Decile Mkt. Cap. Adv/Decl
1 (micro) -4.81% 65/75
2 -0.79% 67/72
3 -1.80% 63/76
4 -0.72% 62/77
5 -1.35% 66/73
6 -1.30% 67/72
7 -0.84% 70/69
8 -0.55% 66/73
9 +0.95% 72/67
10 (mega) +1.09% 70/70
Large cap outperformed small caps this week…

Top Winners and Losers

HINDALCO +8.58%
HINDPETRO +11.60%
BHEL +12.51%
IDEA -7.79%
CONCOR -6.44%
RCOM -5.46%
OMC’s put in a good show on the back of the OPEC non-cut. Has the cycle finally turned for BHEL?

ETF Performance

PSUBNKBEES +4.22%
BANKBEES +1.97%
NIFTYBEES +1.66%
CPSEETF +1.18%
GOLDBEES +0.48%
JUNIORBEES +0.25%
INFRABEES -0.64%
The financial sector put in a good show in the back of RBI’s new regulations on small and payment banks…

Yield Curve

yield Curve.2014-11-21.2014-11-28

Bond Indices

Sub Index Change in YTM Total Return(%)
GSEC TB +0.07 +0.14%
GSEC SUB 1-3 +0.11 +0.12%
GSEC SUB 3-8 -0.08 +0.31%
GSEC SUB 8 -0.08 +0.87%
Next rate cut is more than priced in at this point. Falling inflation, wavering growth..

Investment Theme Performance

Thought for the weekend

When we create new constraints, we force ourselves to adapt. This, in turn, exercises skills that otherwise might never be tapped. Constraints foster creativity. We have to perform in new ways to adapt to challenging constraints.

Source: Expanding Our Trading by Imposing Constraints