Author: shyam

Your Portfolio Correlations

We often like to quote Howard Marks before we begin any discussion on diversification:

If you concentrate your portfolio, your mistakes will kill you;
If you diversify, the payoff from your successes will be diminished.

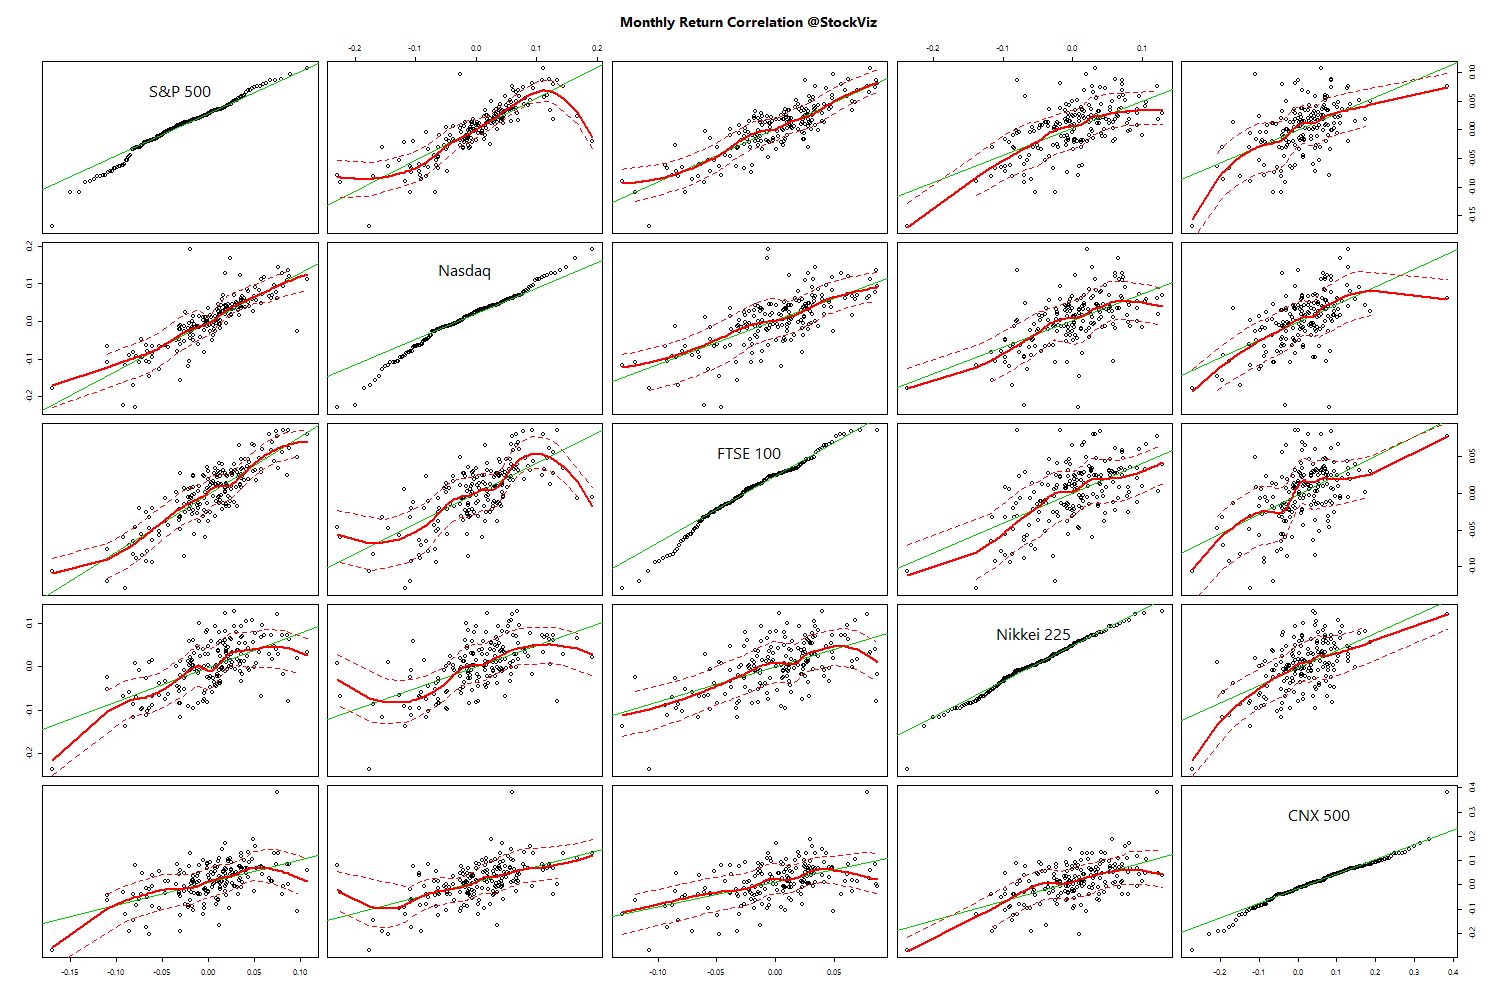
Irrespective of what your preference is, you can now track it on StockViz. Head over to Portfolio and click on ‘Analytics.’ You should see one-year and one-month correlation charts of your portfolio right away. These are updated overnight.

Here’s how my one-month correlation chart looks like. How does yours look like?

Predicting vs. Positioning

Predicting is a losers game

We have always maintained that financial prognosticating is harmful to your wealth (see: Prepare – Don’t Predict!) But the lure of prediction is too strong for most investors to ignore.

One recent example is the RBI’s “surprise” rate cut. The media went gaga over it, some pundits did a “I told you so” dance and you probably went and subscribed to a newsletter hoping that you too will be clued in when it happens next. The question is: did you make money?

Positioning your portfolio

Back in September last year, we had pointed out that with the consensus behind RBI rate cuts happening in early 2015, its time to look at long duration bond funds. We had picked the UTI Gilt Advantage fund as our favorite. Between 2014-10-01 and 2015-01-15, UTI – GILT ADVANTAGE has returned a cumulative 11.08% with an IRR of 43.61% vs. CNX NIFTY’s cumulative return of 6.90% and an IRR of 25.85%.

UTI - GILT ADVANTAGE vs. CNX NIFTY

Heck, with the RBI getting serious about trampling down inflation, bonds have been rallying for almost the whole of 2014. Between 2014-01-01 and 2015-01-15, UTI – GILT ADVANTAGE has returned a cumulative 21.90% with an IRR of 21.01% vs. CNX NIFTY’s cumulative return of 34.79% and an IRR of 33.31%.

Good investing is boring

From the Wolf of Wall Street:

Mark Hanna: Nobody knows if a stock is going to go up, down, sideways or in circles. You know what a Fugazi is?
Jordan Belfort: Fugazi, it’s a fake.
Mark Hanna: Fugazi, Fugazi. It’s a wazy. It’s a woozie. It’s fairy dust.

The difference between trying to predict market events and positioning your portfolio is in the level of excitement you feel. If you feel very smart while putting your money to work, then you are doing something wrong. If you feel that your investments are a “sure thing”, then you are doing something wrong. Good investing will feel like a boring routine that you keep doing – like flossing your teeth – because it is good for you.

Process vs. Outcome

The end result of process oriented investing is a well positioned portfolio. Investors should give up on trying to figure out what the outcome is going to be. Who knows what the NIFTY IRR is going to be this year? Who knew that plain old bonds will give 20% returns in 2014? What is the one-day price target for anything?

Positioning your portfolio would have allowed you to actually realize the returns that the market gave. The alternative is all Fugazi.

Weekly Recap: Big Bets

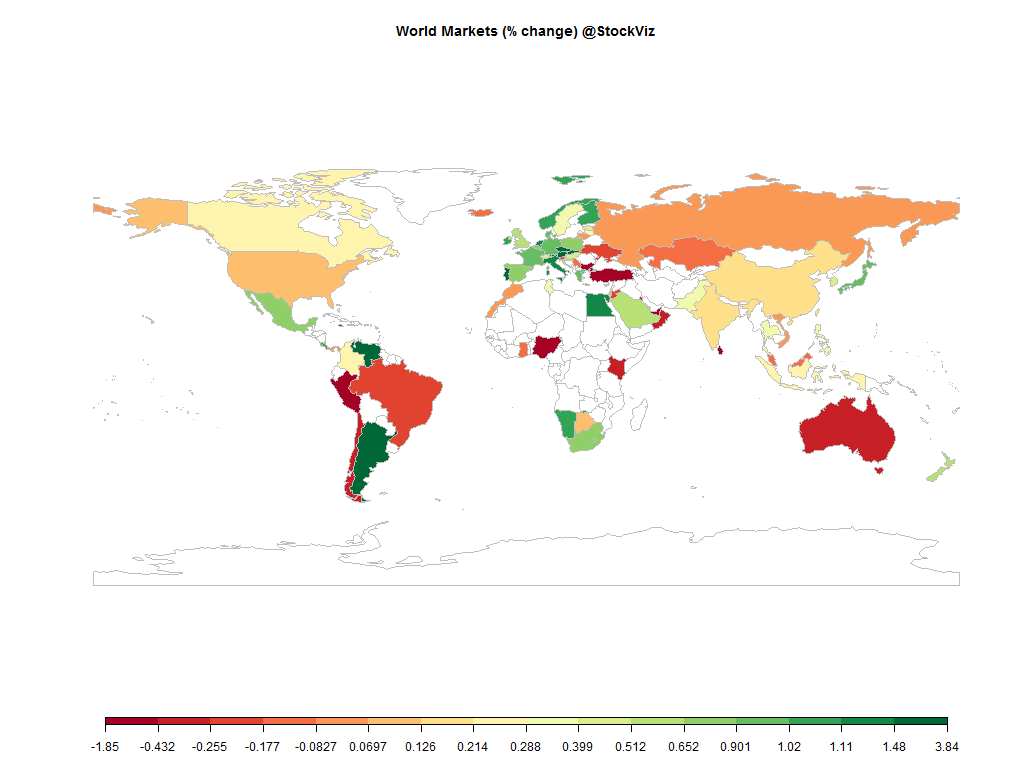
world.2015-1-9.2015-1-16

Equities

Major
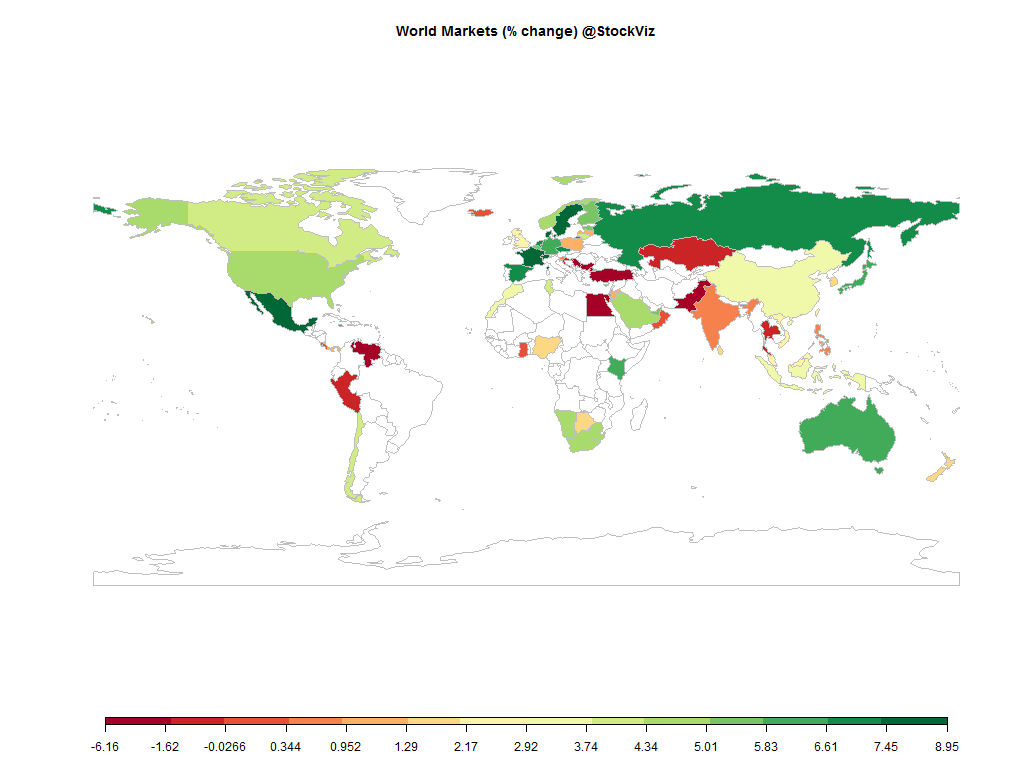
DAX(DEU) +5.38%
CAC(FRA) +4.80%
UKX(GBR) +0.76%
NKY(JPN) -1.94%
SPX(USA) -1.44%
MINTs
JCI(IDN) -1.31%
INMEX(MEX) -2.57%
NGSEINDX(NGA) -3.68%
XU030(TUR) +0.10%
BRICS
IBOV(BRA) +0.54%
SHCOMP(CHN) +2.77%
NIFTY(IND) +2.77%
INDEXCF(RUS) +5.02%
TOP40(ZAF) -1.25%

Commodities

Energy
Heating Oil -1.82%
Brent Crude Oil +0.95%
WTI Crude Oil +0.96%
Natural Gas +4.83%
RBOB Gasoline +3.74%
Ethanol -8.81%
Metals
Gold 100oz +4.96%
Palladium -5.39%
Platinum +3.02%
Silver 5000oz +8.54%
Copper -4.66%

Currencies

USDEUR:+2.42% USDJPY:-0.89%

MINTs
USDIDR(IDN) -0.45%
USDMXN(MEX) -0.20%
USDNGN(NGA) +1.90%
USDTRY(TUR) +1.42%
BRICS
USDBRL(BRA) -0.72%
USDCNY(CHN) -0.01%
USDINR(IND) -0.73%
USDRUB(RUS) +5.82%
USDZAR(ZAF) +0.58%
Agricultural
Corn -3.20%
Feeder Cattle -3.05%
Lean Hogs -4.84%
Soybean Meal -9.92%
Wheat -6.01%
Cattle -3.58%
Coffee (Robusta) -1.52%
Cotton -2.49%
Lumber -3.34%
Sugar #11 +2.41%
Cocoa -0.25%
Coffee (Arabica) -4.38%
Orange Juice +5.89%
Soybeans -5.62%
White Sugar +1.48%

Credit Indices

Index Change
Markit CDX EM -0.63%
Markit CDX NA HY -0.40%
Markit CDX NA IG +2.89%
Markit iTraxx Asia ex-Japan IG +3.23%
Markit iTraxx Australia +2.03%
Markit iTraxx Europe +0.73%
Markit iTraxx Europe Crossover +7.83%
Markit iTraxx Japan +0.75%
Markit iTraxx SovX Western Europe -0.74%
Markit LCDX (Loan CDS) -0.43%
Markit MCDX (Municipal CDS) +2.56%
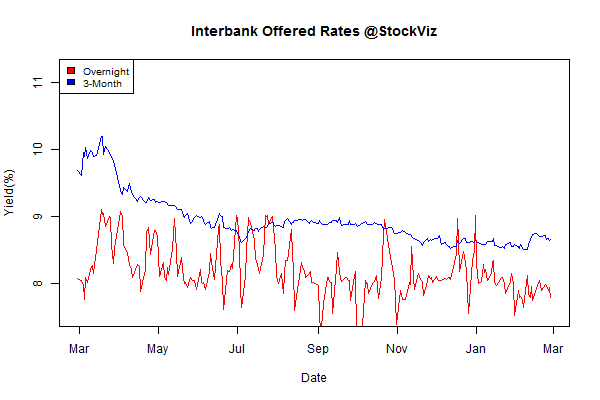
Rajan surprised us with a rate cut. But the Swiss central bank surprised a whole bunch of FX brokers and punters by abandoning their peg against the Euro. Most developed country 10-year yields are either at zero or negative. Investors are paying the Swiss for the privilege of lending them money!

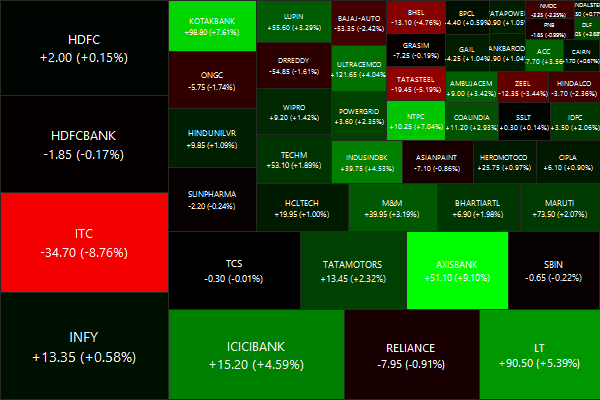
Nifty Heatmap

CNX NIFTY.2015-1-9.2015-1-16

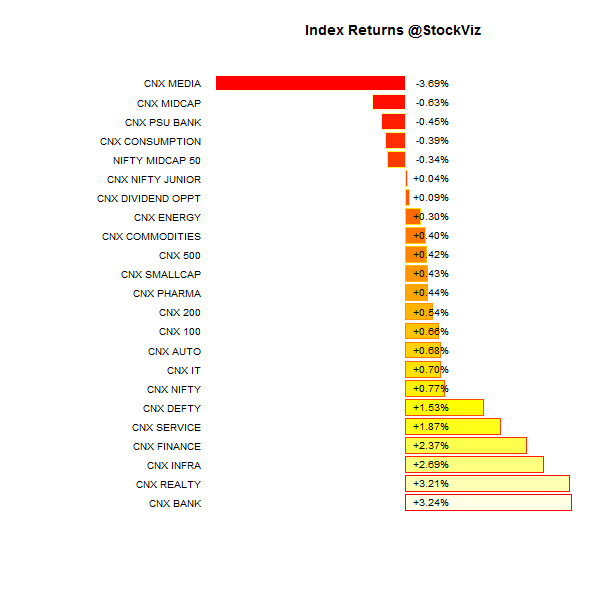
Index Returns

index performance.2015-1-9.2015-1-16

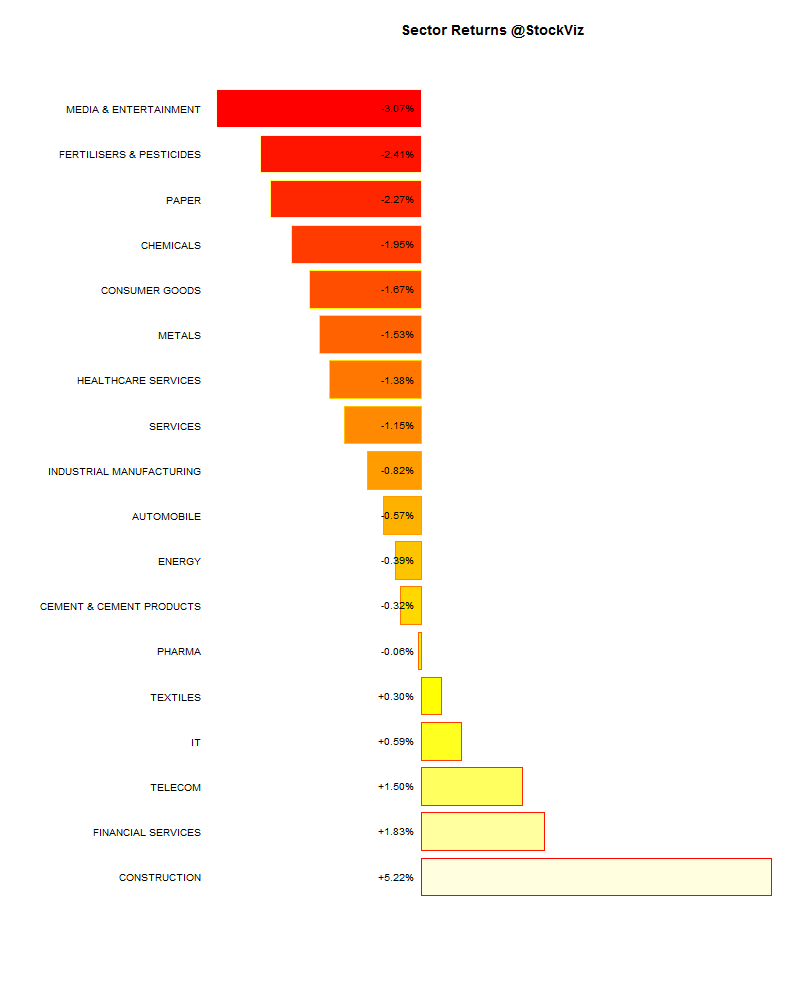
Sector Performance

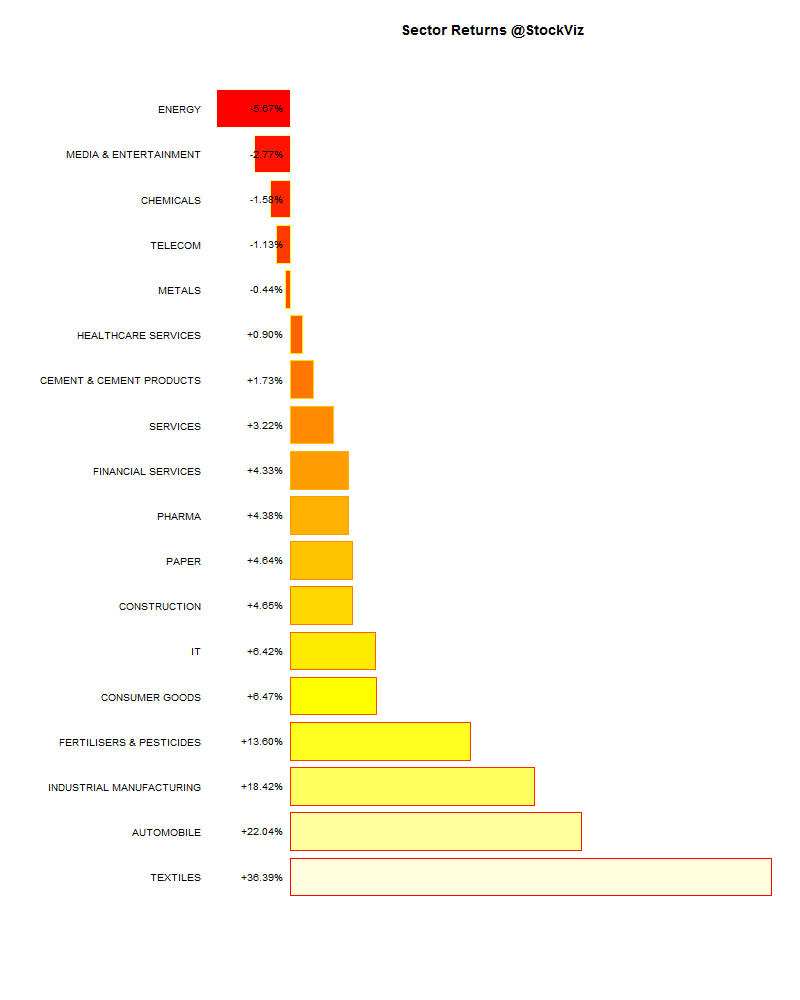
sector performance.2015-1-9.2015-1-16

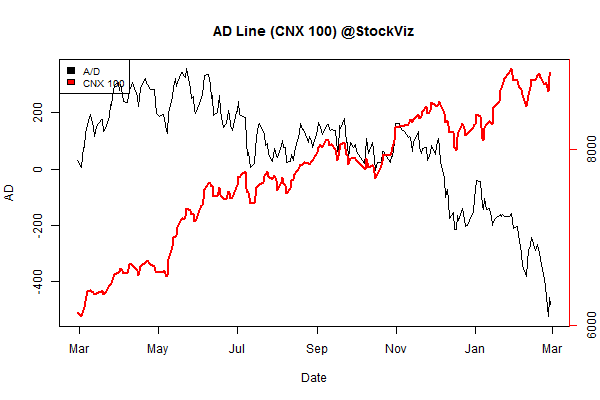
Advance Decline

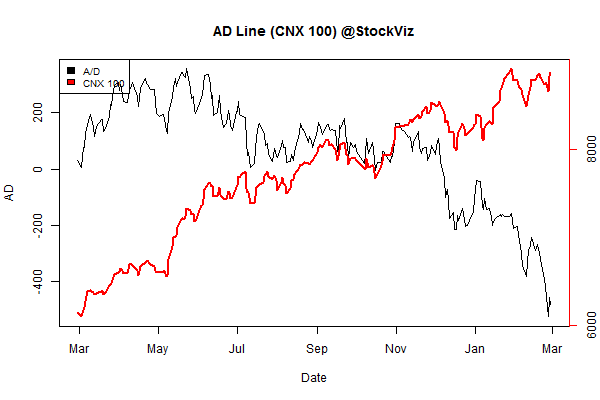
advance.decline.line2.2015-1-9.2015-1-16

Market Cap Decile Performance

Decile Mkt. Cap. Adv/Decl
1 (micro) +0.74% 70/65
2 -0.29% 74/61
3 +1.86% 73/62
4 +1.33% 68/67
5 +0.33% 68/67
6 +1.61% 73/62
7 +1.28% 66/69
8 +1.72% 70/65
9 +2.28% 71/64
10 (mega) +2.90% 68/67
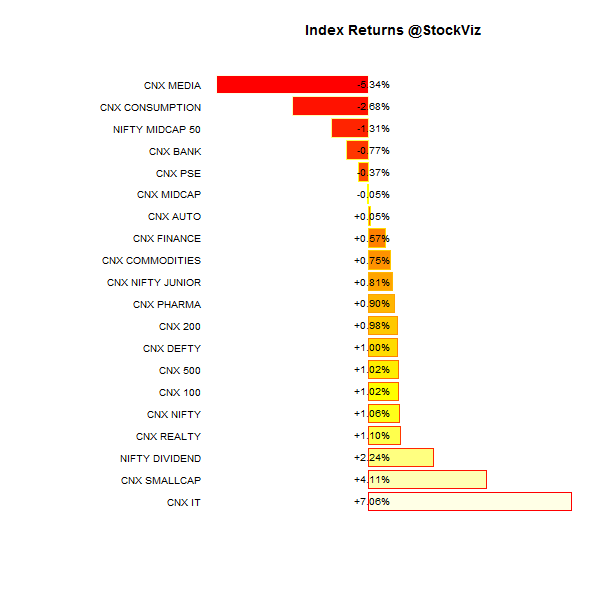
Large caps outperformed mid and small caps.

Top Winners and Losers

BOSCHLTD +10.24%
UPL +11.37%
ULTRACEMCO +12.48%
HINDALCO -10.61%
PETRONET -7.62%
SSLT -7.00%
Miners got pummeled. The end of a super-cycle brings many deaths…

ETF Performance

PSUBNKBEES +3.43%
JUNIORBEES +3.38%
BANKBEES +3.28%
GOLDBEES +3.09%
NIFTYBEES +2.99%
CPSEETF -0.04%
INFRABEES -0.60%
Go Rate-Cut Rajan!

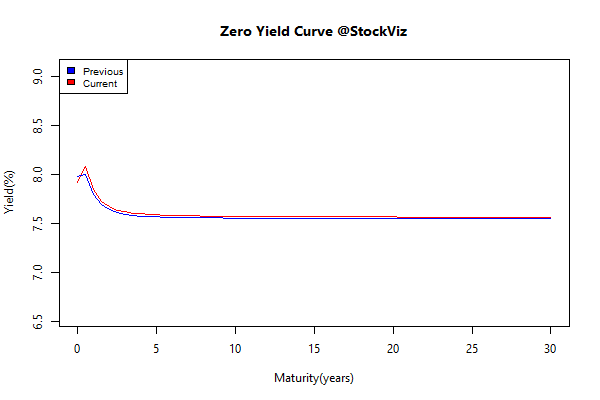
Yield Curve

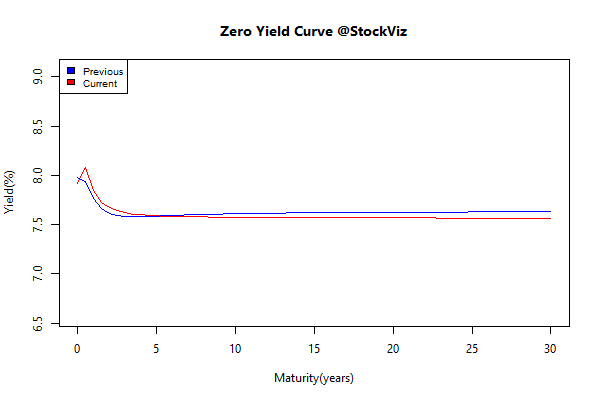
yield Curve.2015-1-9.2015-1-16

Bond Indices

Sub Index Change in YTM Total Return(%)
GSEC TB -0.10 +0.18%
GSEC SUB 1-3 -0.48 +0.49%
GSEC SUB 3-8 -0.32 +1.36%
GSEC SUB 8 -0.28 +2.57%
The long-end continues to rock investor returns…

Investment Theme Performance

Thought for the weekend

Concentration produces wealth. Diversification protects it.
Concentration produces innovation. Diversification produces mediocrity.
Make big bets, do fewer things, concentrate your resources.
Don’t hedge, commit.

Source: Making Big Bets

Correlation between Theme components

If you concentrate your portfolio, your mistakes will kill you;
If you diversify, the payoff from your successes will be diminished.
-Howard Marks

Investors can now look at the correlation (over one-year and one-month horizons) between stocks that make up an investment ‘Theme’ strategy. For example, here’s how the one-year correlation of the Financial Strength Value Theme looks like:

one year correlation

A lot of thick blue squares mean that positive correlations are high. Red squares mean negative correlations are high. Whites are the doldrums.

Happy Sankranti and Pongal!

Nifty Cash-Futures Basis

Fair value

Equity futures have a ‘fair-value’:

Futures Price = Cash Price [1+r (x/360)] – Dividends;
where x = days to expiration of the futures contract

Fair value is the theoretical assumption of where a futures contract should be priced given such things as the current index level, index dividends, days to expiration and interest rates. The actual futures price will not necessarily trade at the theoretical price, as short-term supply and demand will cause price to fluctuate around fair value. Price discrepancies above or below fair value should cause arbitrageurs to return the market closer to its fair value. – CME

Cash-futures Basis

You can see this in action when you plot the NIFTY index value with its futures:

nifty-cash-futures-basis

Initially, x/360 is large, so futures’ trade rich to cash. As expiry approaches, futures and cash prices converge. This is the natural order of things.

Interest Rate

You can go one step further and back out the interest rate baked into these prices:

nifty-cash-futures-interest-rate

r is usually within a tight band; roughly around where short-term rates are.

So if you ever wondered why futures are trading higher than cash, now you know!