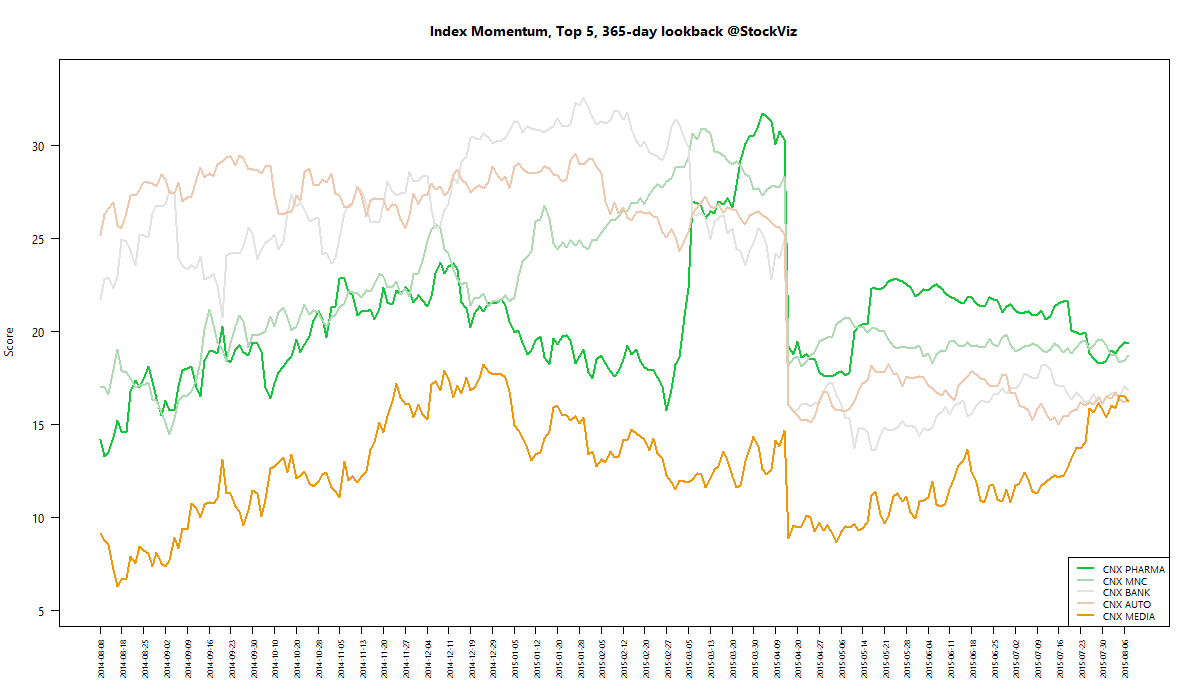
MOMENTUM
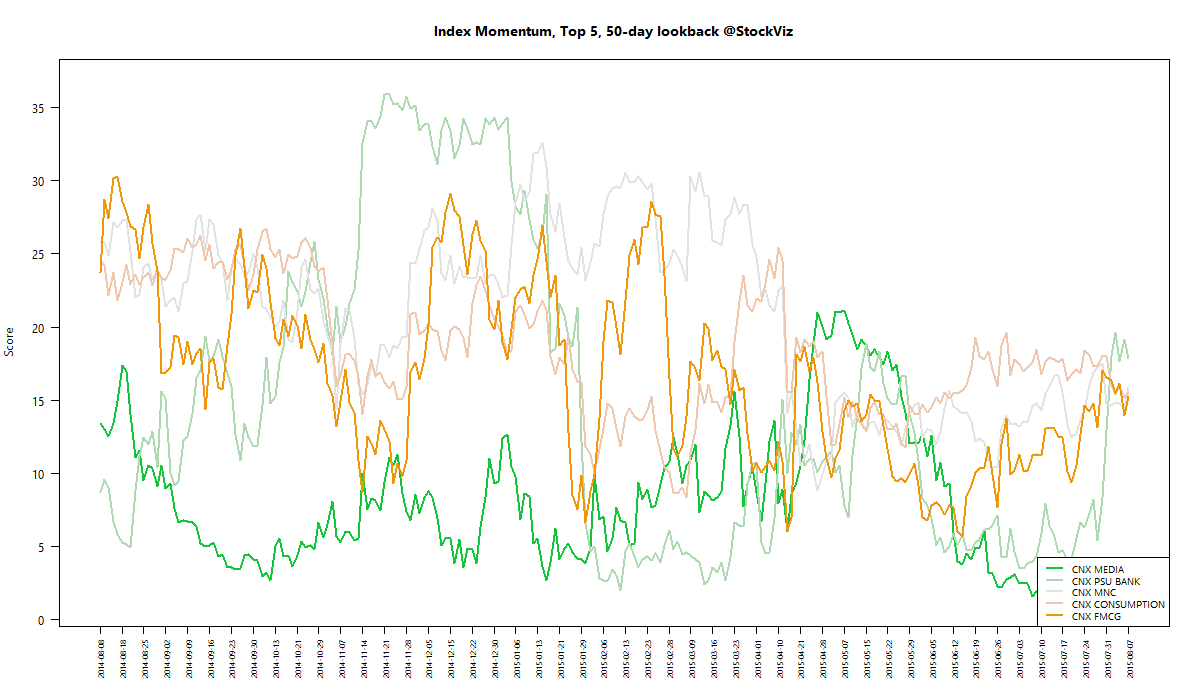
We run our proprietary momentum scoring algorithm on indices just like we do on stocks. You can use the momentum scores of sub-indices to get a sense for which sectors have the wind on their backs and those that are facing headwinds.
Traders can pick their longs in sectors with high short-term momentum and their shorts in sectors with low momentum. Investors can use the longer lookback scores to position themselves using our re-factored index Themes.
You can see how the momentum algorithm has performed on individual stocks here.
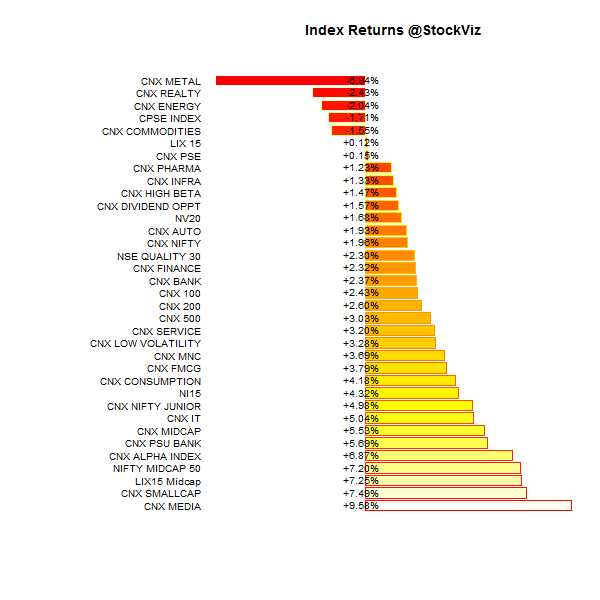
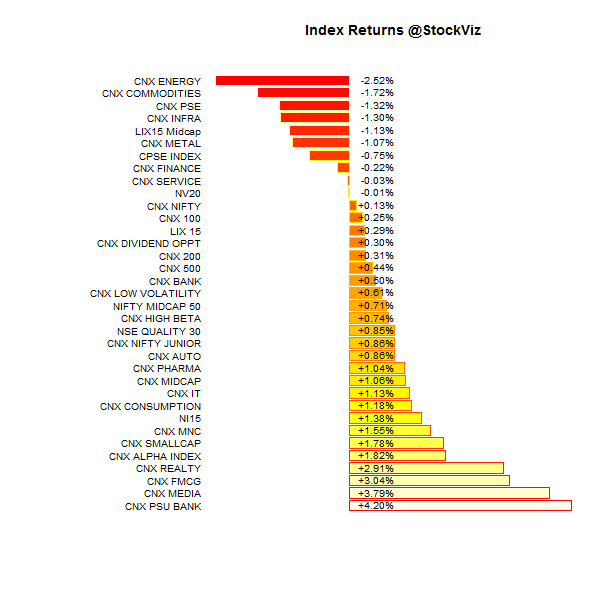
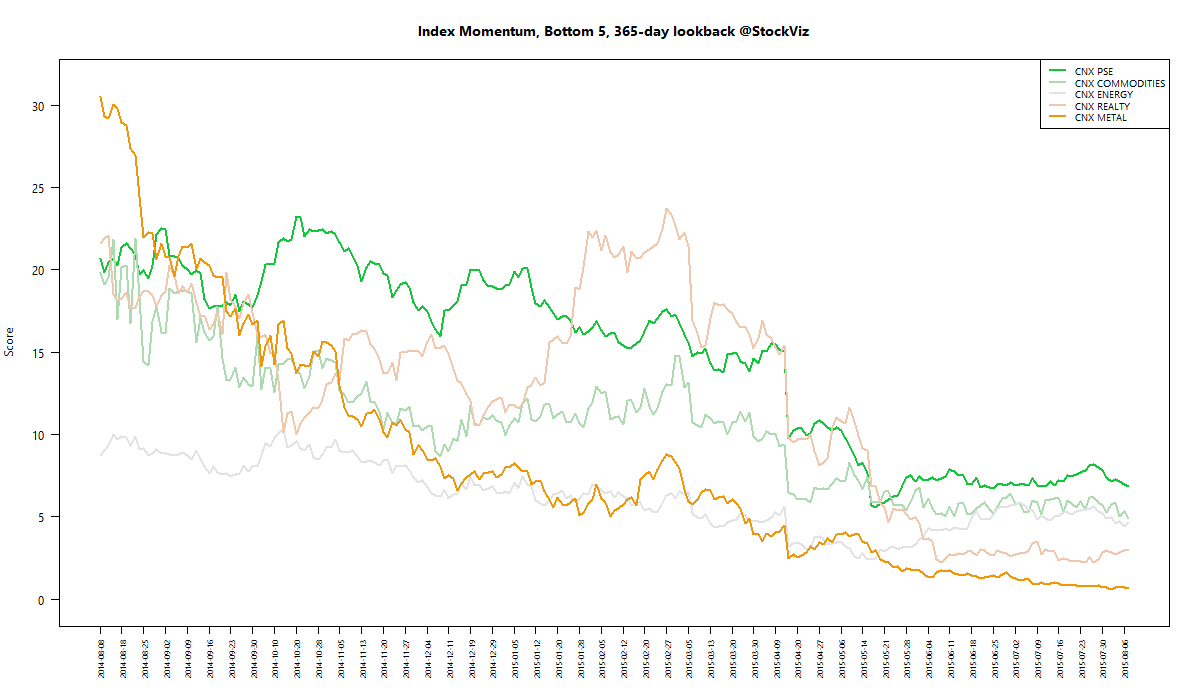
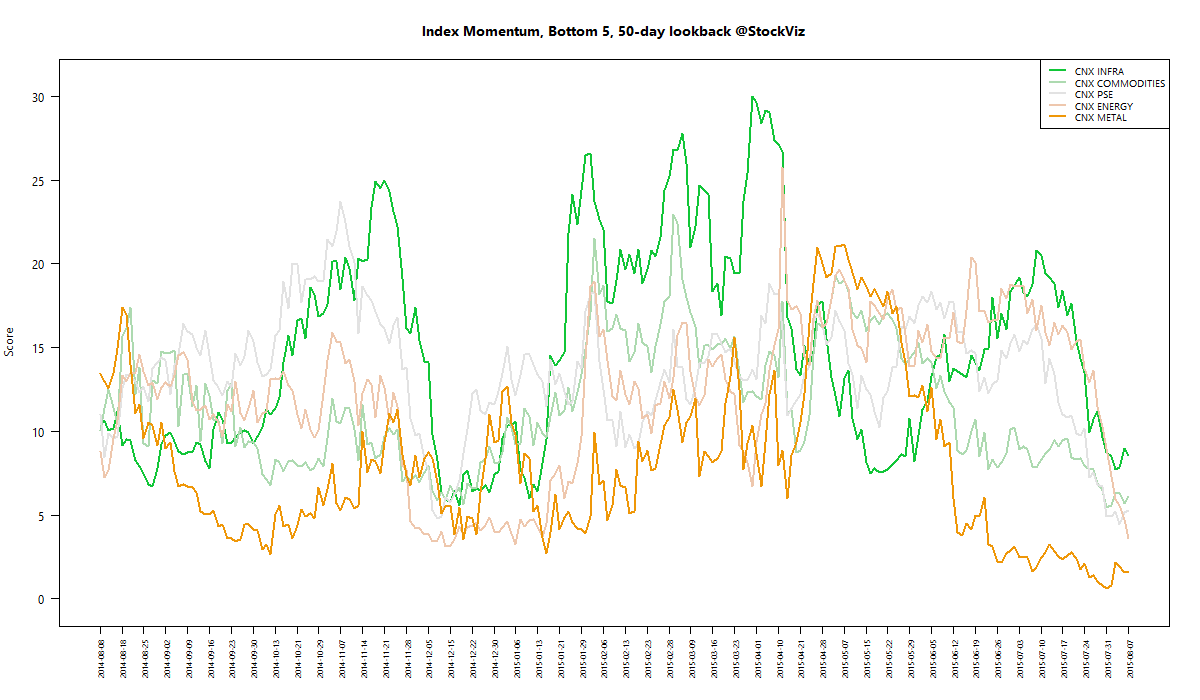
Here are the best and the worst sub-indices:
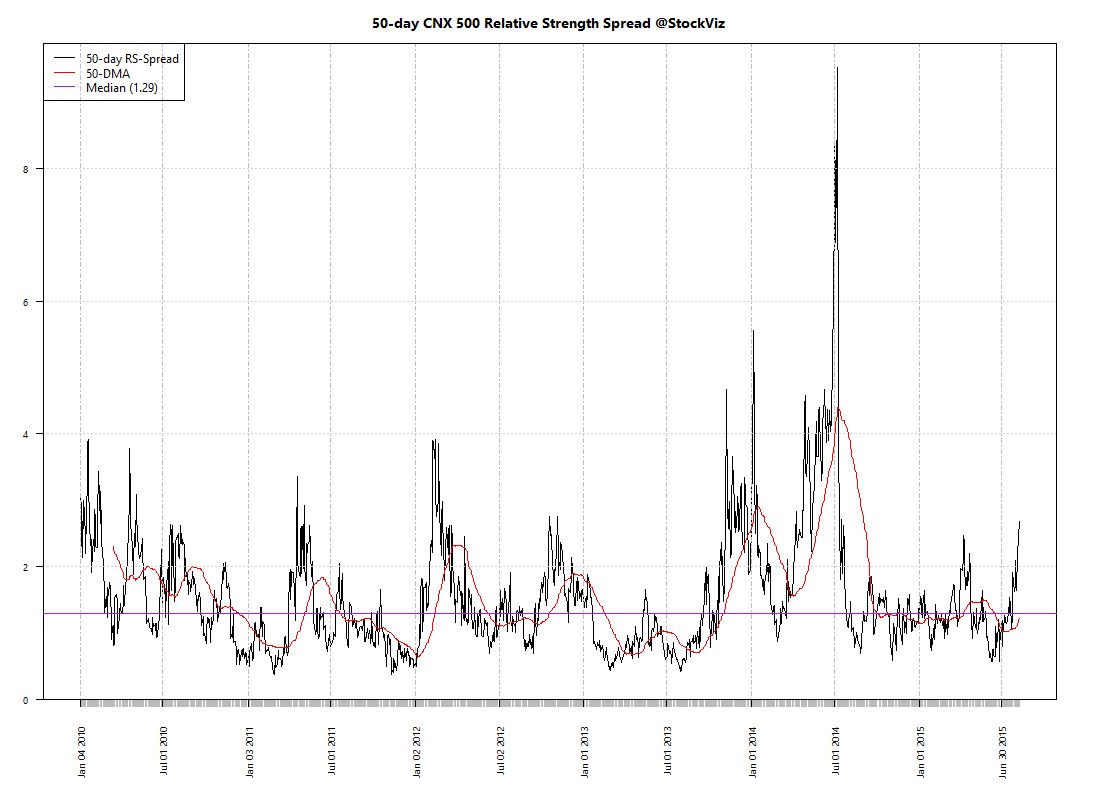
Relative Strength Spread
Refactored Index Performance
50-day performance, from June 01, 2015 through August 07, 2015:
Trend Model Summary
| Index | Signal | % From Peak | Day of Peak |
|---|---|---|---|
| CNX AUTO | LONG |
3.26
|
2015-Jan-27
|
| CNX BANK | LONG |
8.08
|
2015-Jan-27
|
| CNX COMMODITIES | SHORT |
28.46
|
2008-Jan-04
|
| CNX CONSUMPTION | LONG |
0.52
|
2015-Aug-05
|
| CNX ENERGY | LONG |
27.88
|
2008-Jan-14
|
| CNX FMCG | LONG |
6.25
|
2015-Feb-25
|
| CNX INFRA | SHORT |
47.01
|
2008-Jan-09
|
| CNX IT | SHORT |
87.86
|
2000-Feb-21
|
| CNX MEDIA | LONG |
15.34
|
2008-Jan-04
|
| CNX METAL | LONG |
61.19
|
2008-Jan-04
|
| CNX MNC | LONG |
0.00
|
2015-Aug-07
|
| CNX NIFTY | LONG |
4.80
|
2015-Mar-03
|
| CNX PHARMA | LONG |
8.60
|
2015-Apr-08
|
| CNX PSE | SHORT |
25.11
|
2008-Jan-04
|
| CNX PSU BANK | LONG |
33.42
|
2010-Nov-05
|
| CNX REALTY | LONG |
90.27
|
2008-Jan-14
|
| CNX SERVICE | SHORT |
6.02
|
2015-Mar-03
|
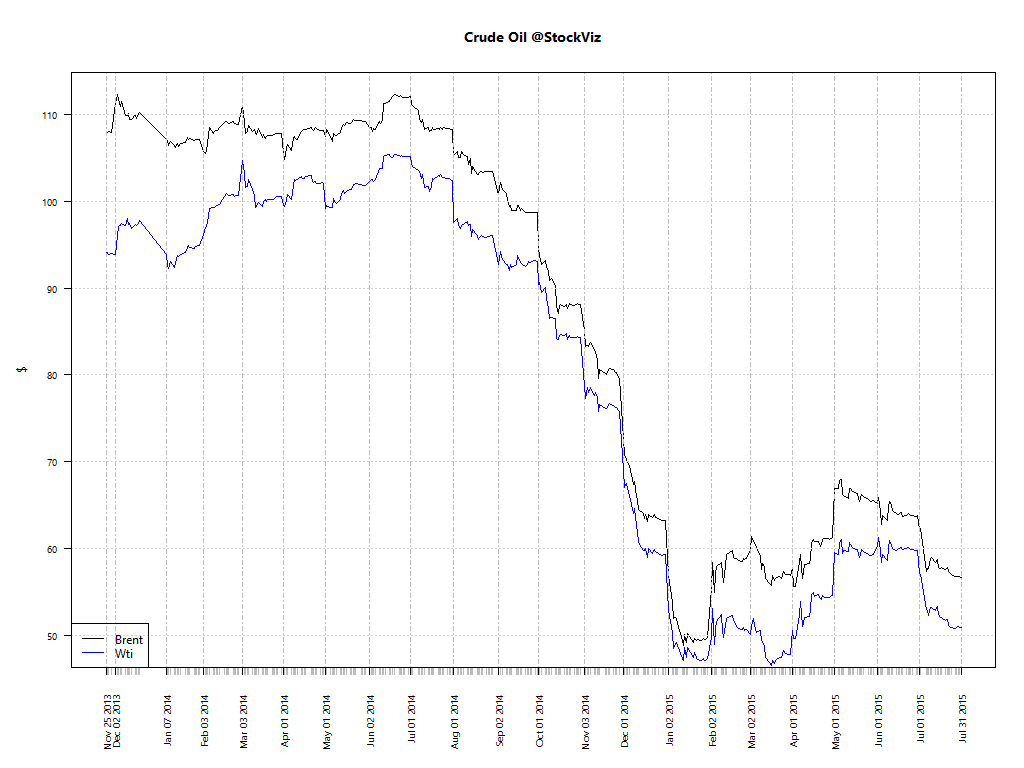
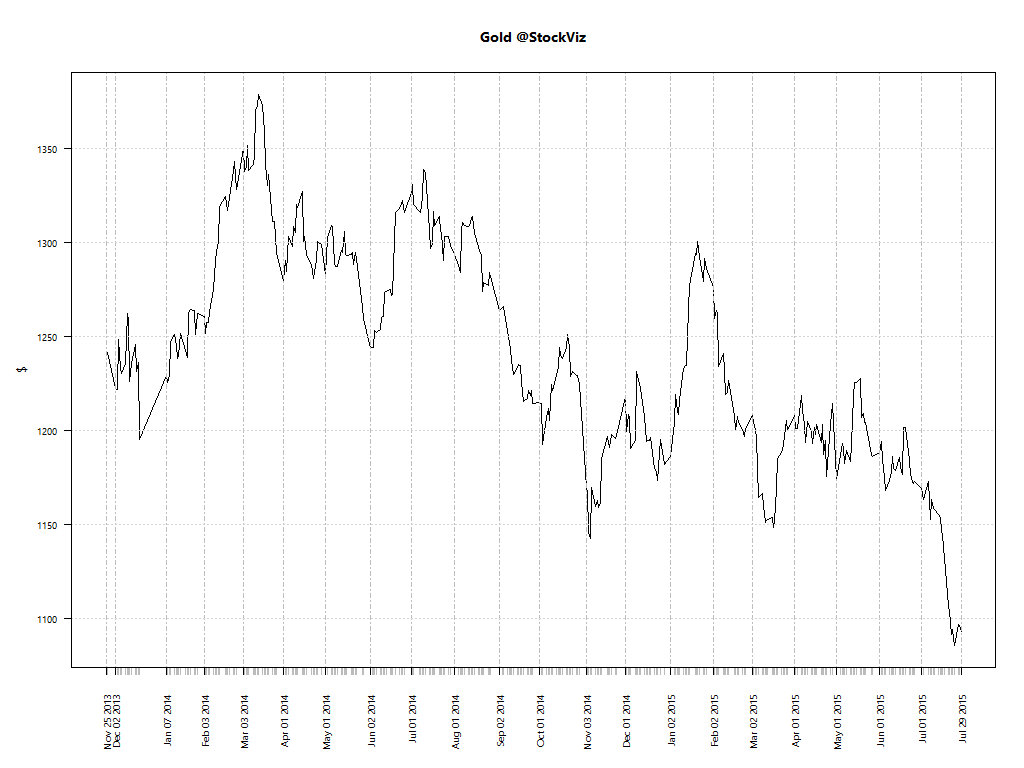
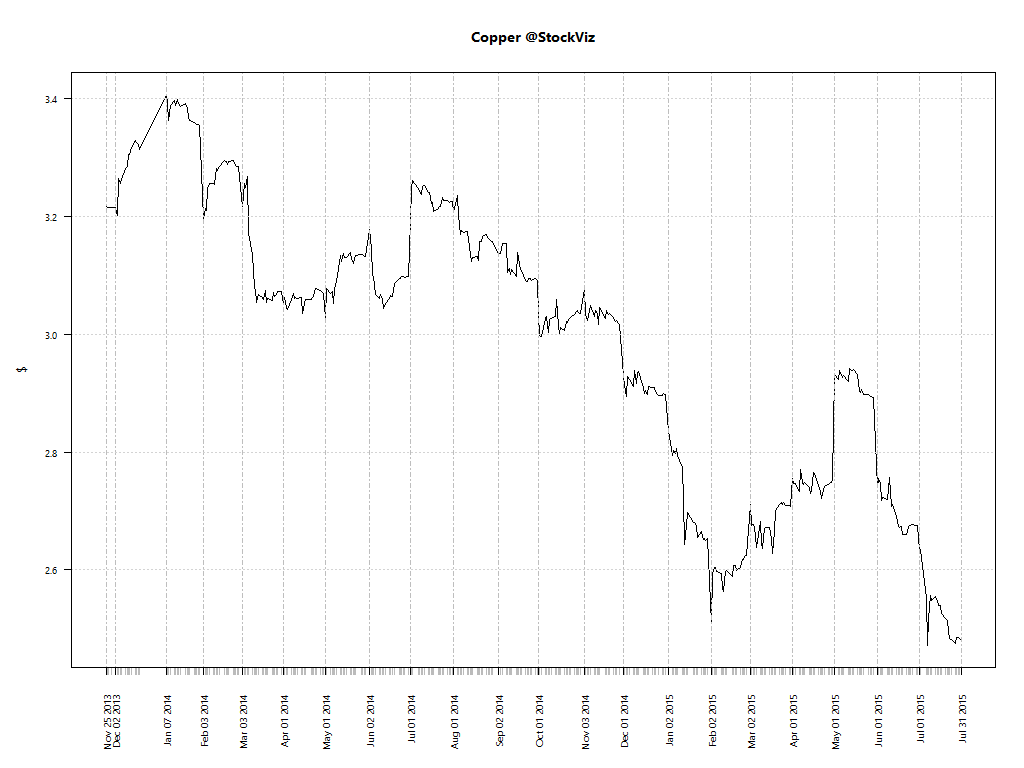
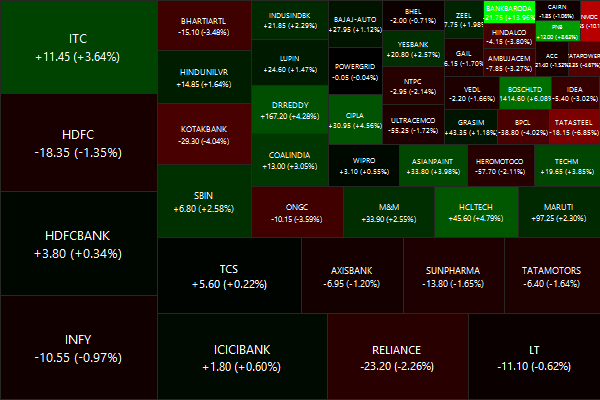
A total nightmare for commodity, energy and infrastructure investors. It continues to be a consumption driven market…