MOMENTUM
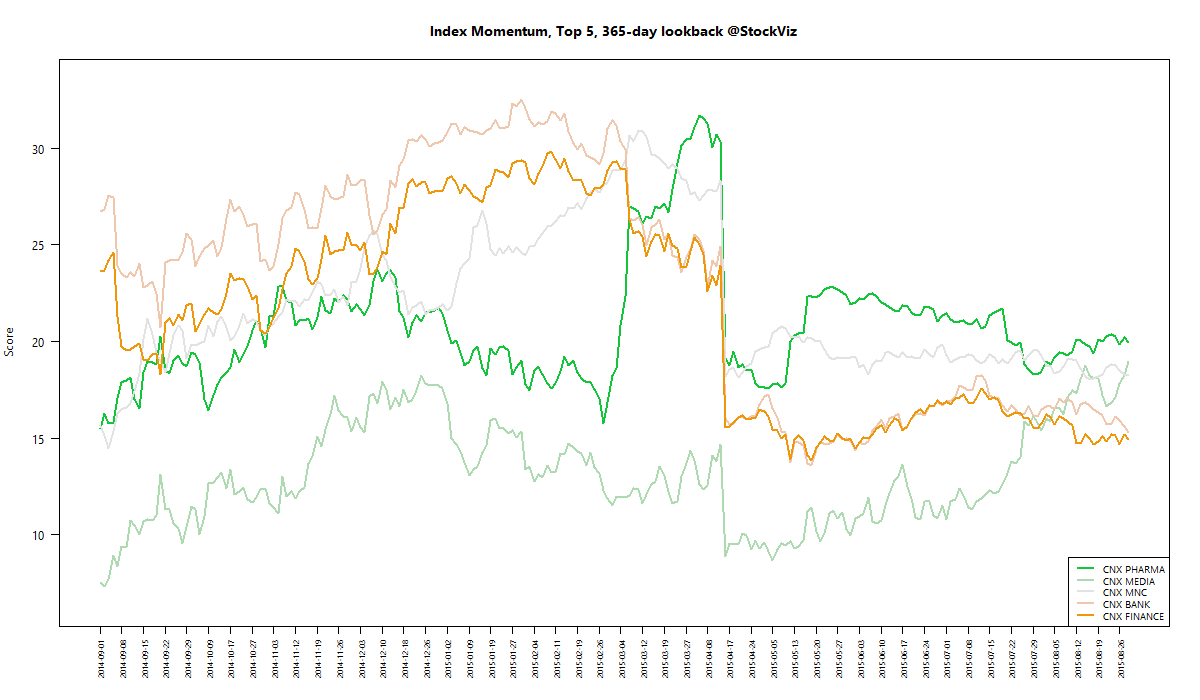
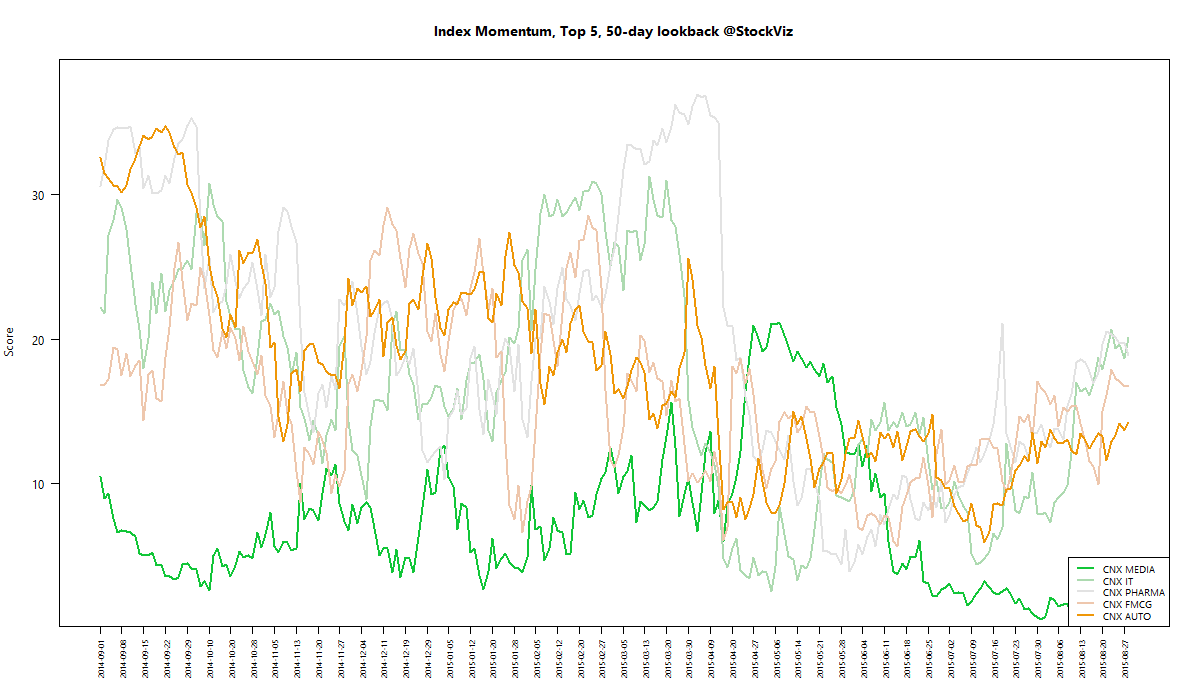
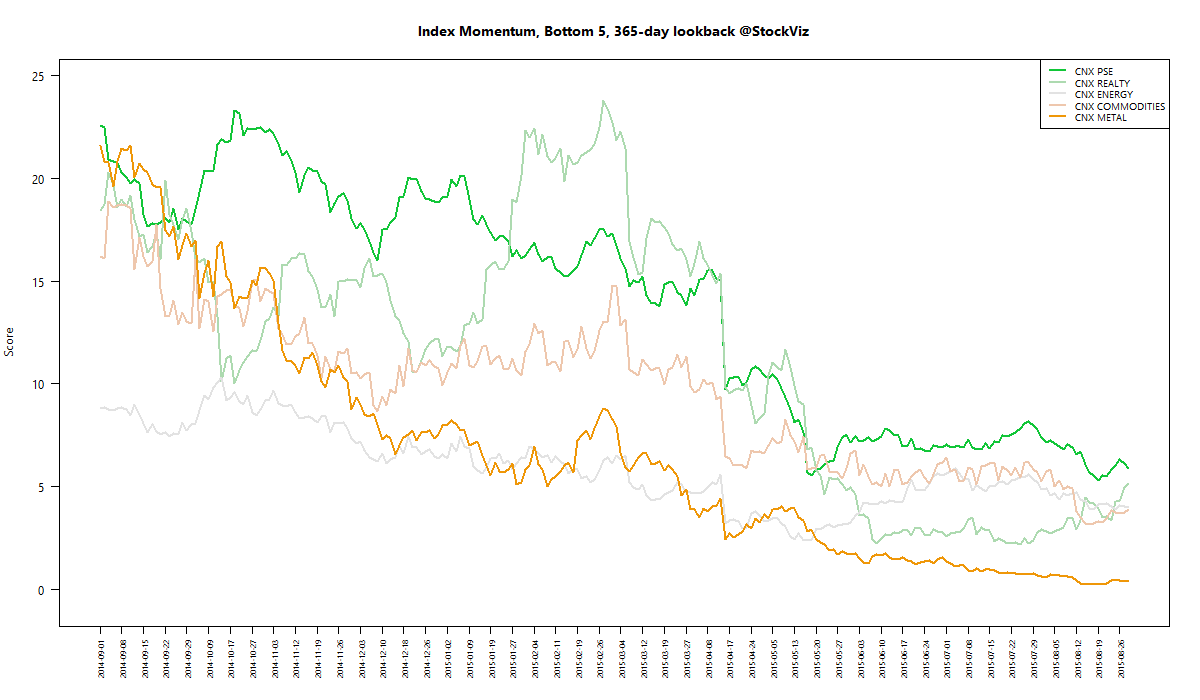
We run our proprietary momentum scoring algorithm on indices just like we do on stocks. You can use the momentum scores of sub-indices to get a sense for which sectors have the wind on their backs and those that are facing headwinds.
Traders can pick their longs in sectors with high short-term momentum and their shorts in sectors with low momentum. Investors can use the longer lookback scores to position themselves using our re-factored index Themes.
You can see how the momentum algorithm has performed on individual stocks here.
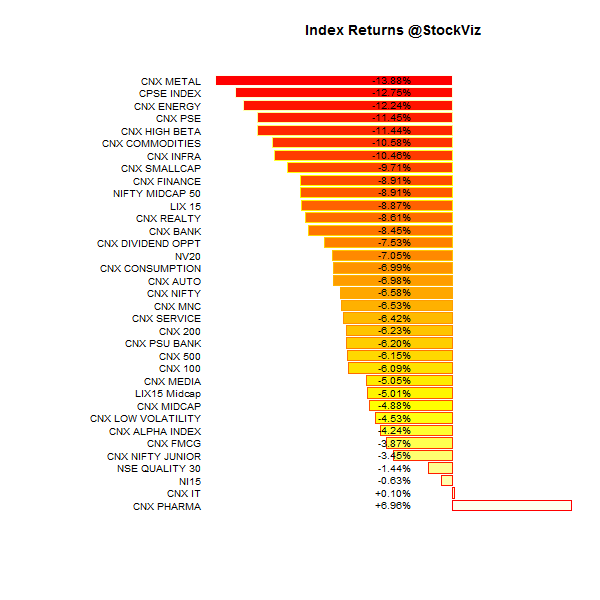
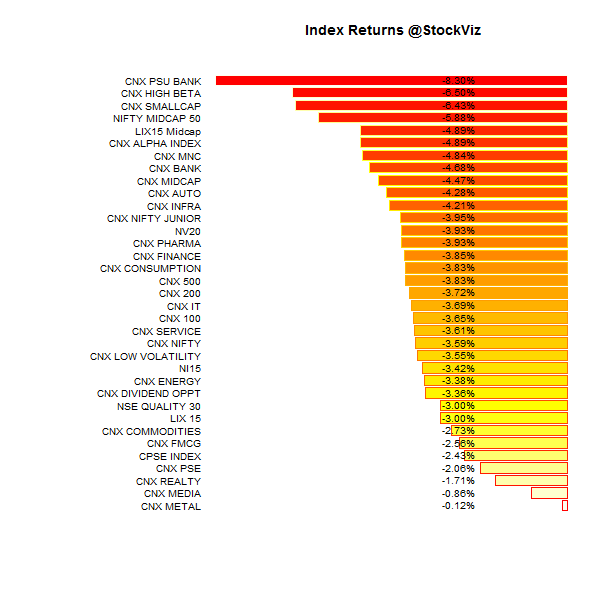
Here are the best and the worst sub-indices:

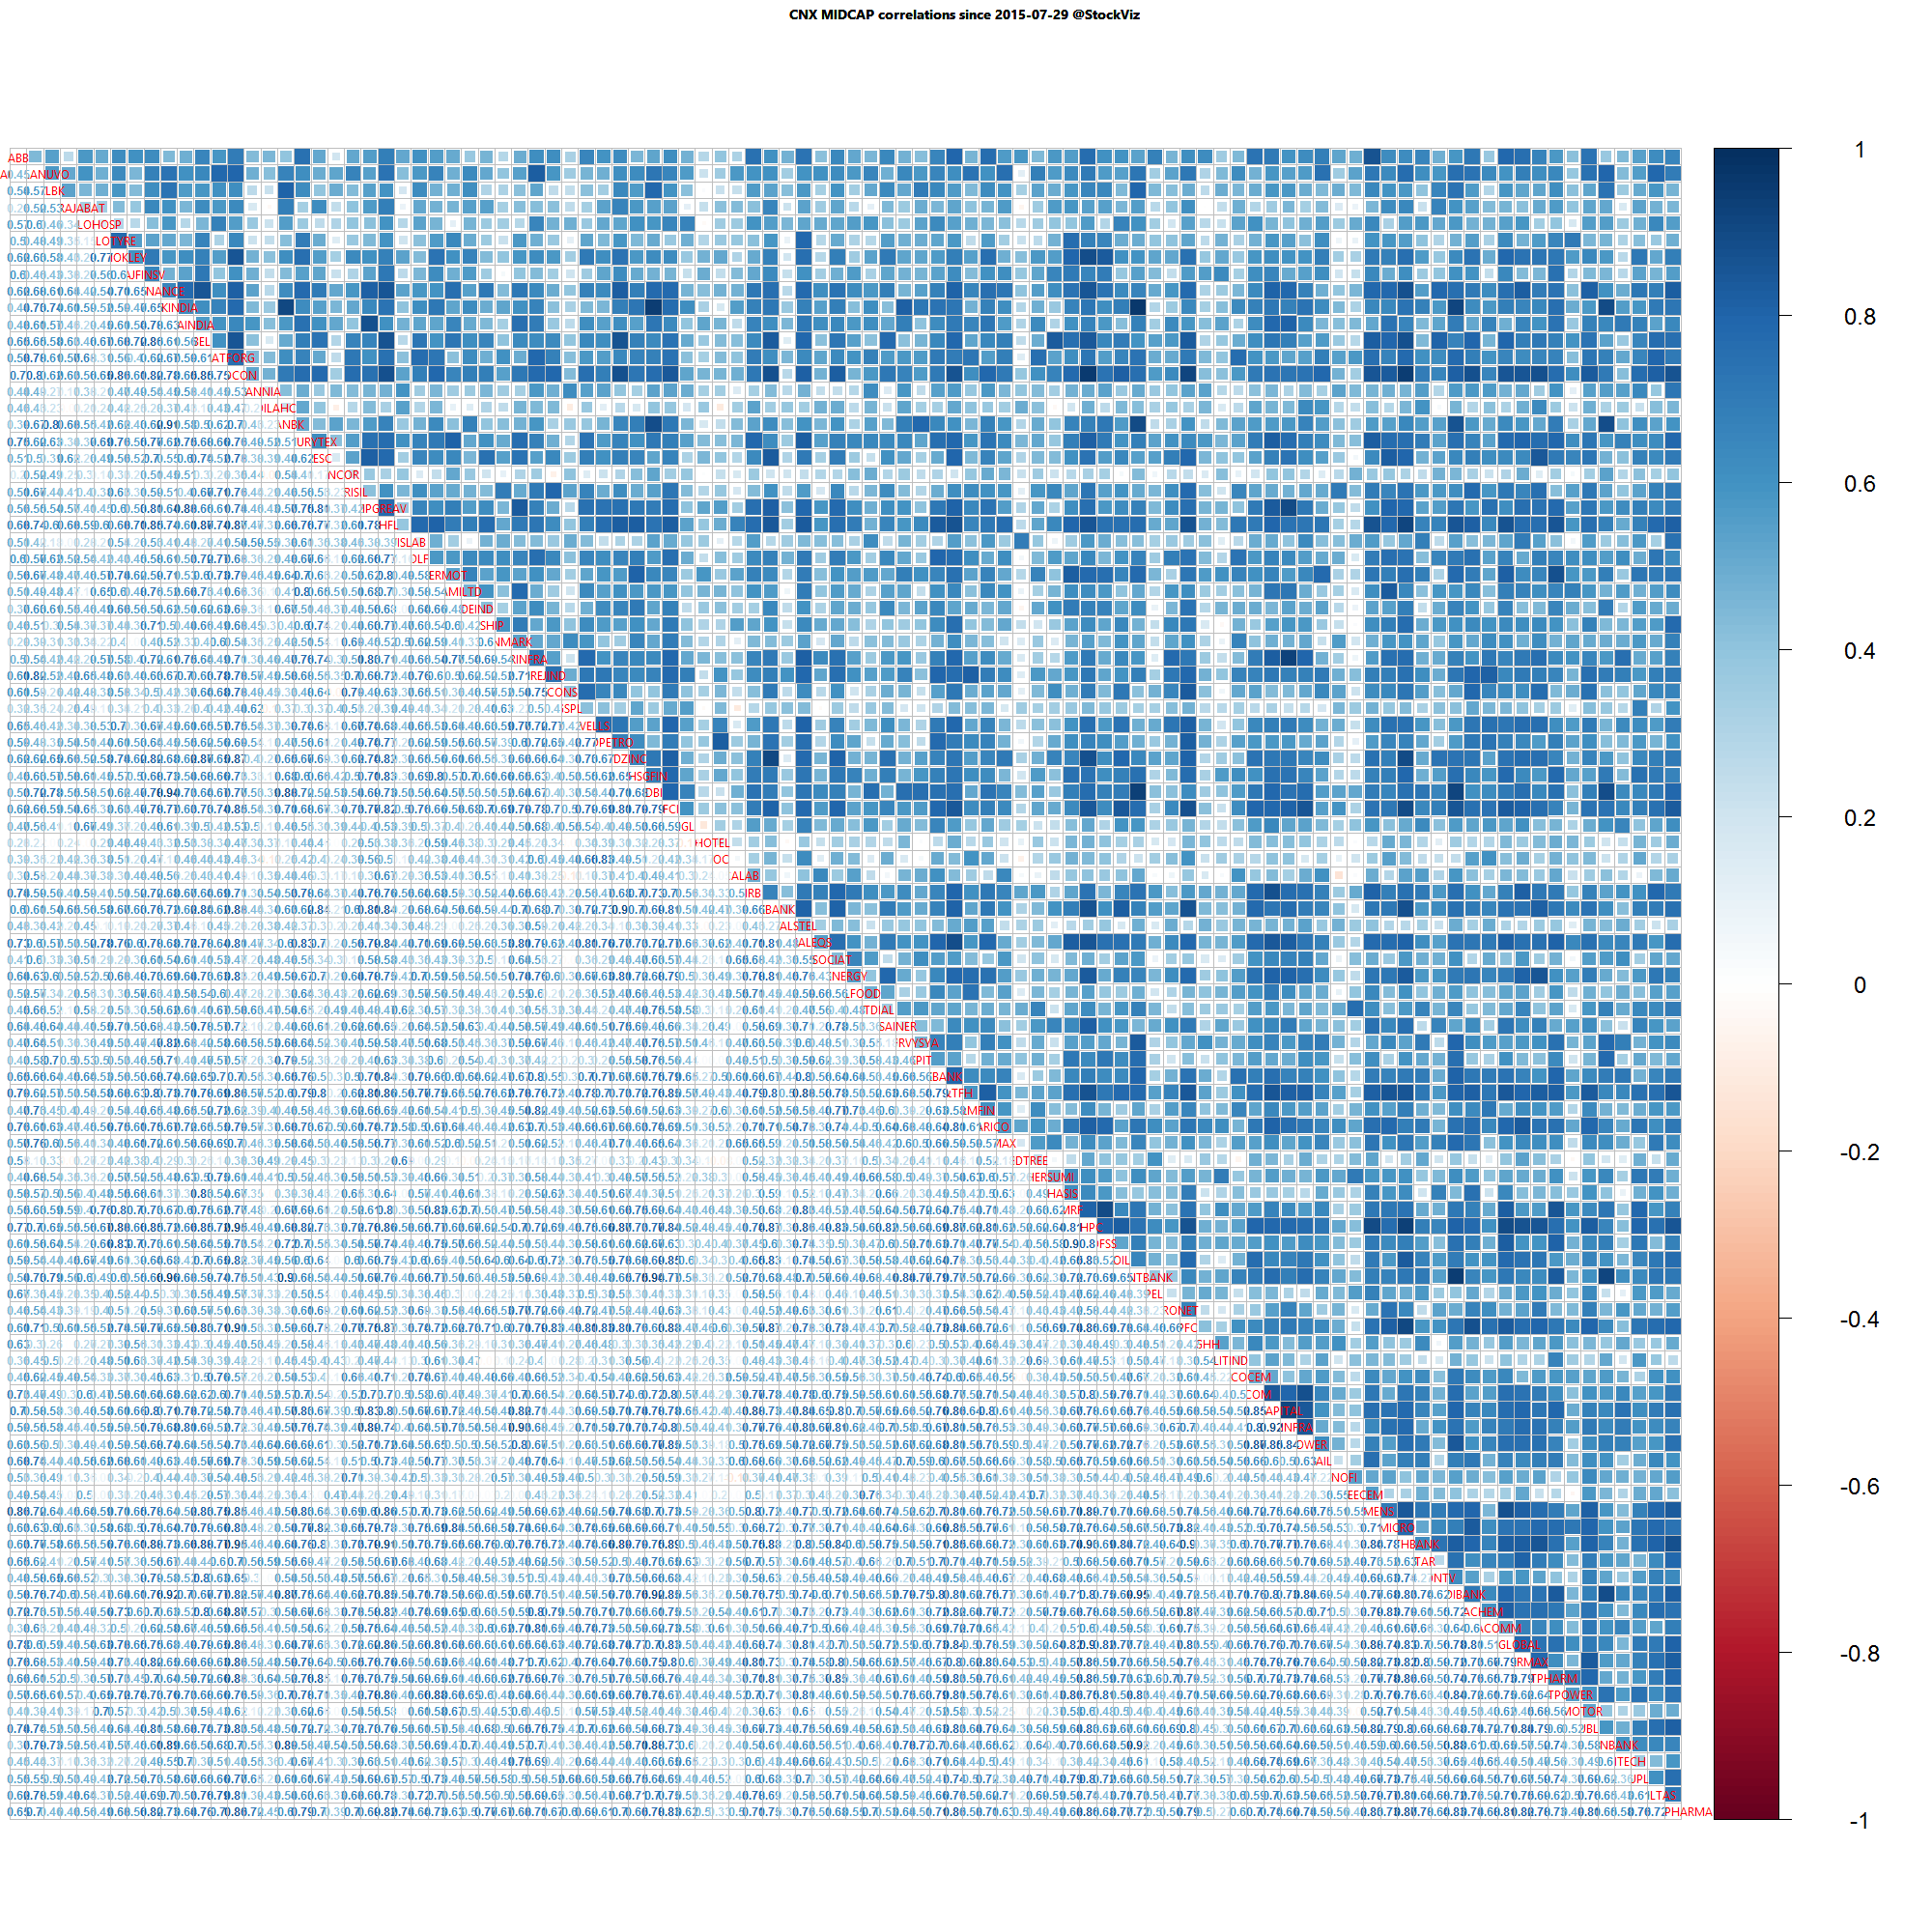
Relative Strength Spread

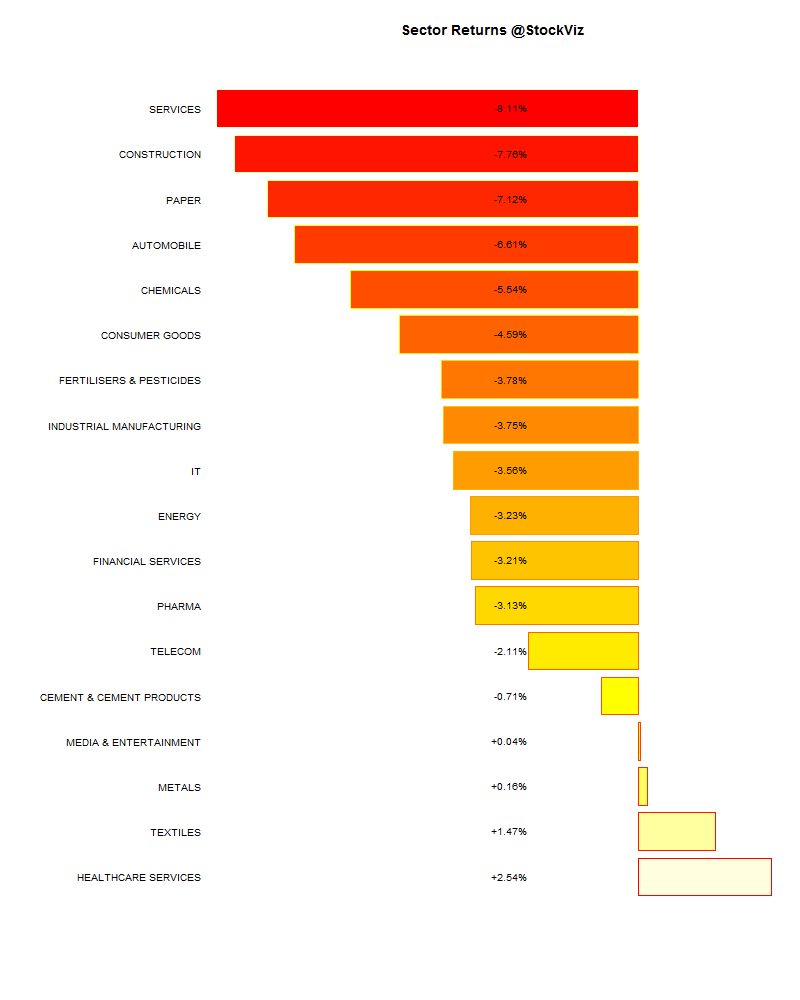
Refactored Index Performance
50-day performance, from June 22, 2015 through August 28, 2015:
Trend Model Summary
| Index |
Signal |
% From Peak |
Day of Peak |
| CNX AUTO |
LONG |
11.83
|
2015-Jan-27
|
| CNX BANK |
LONG |
16.26
|
2015-Jan-27
|
| CNX COMMODITIES |
LONG |
36.29
|
2008-Jan-04
|
| CNX CONSUMPTION |
LONG |
7.46
|
2015-Aug-05
|
| CNX ENERGY |
LONG |
35.67
|
2008-Jan-14
|
| CNX FMCG |
SHORT |
9.51
|
2015-Feb-25
|
| CNX INFRA |
LONG |
52.21
|
2008-Jan-09
|
| CNX IT |
LONG |
87.87
|
2000-Feb-21
|
| CNX MEDIA |
LONG |
20.76
|
2008-Jan-04
|
| CNX METAL |
LONG |
66.87
|
2008-Jan-04
|
| CNX MNC |
LONG |
8.07
|
2015-Aug-10
|
| CNX NIFTY |
LONG |
11.05
|
2015-Mar-03
|
| CNX PHARMA |
SHORT |
6.44
|
2015-Apr-08
|
| CNX PSE |
LONG |
33.30
|
2008-Jan-04
|
| CNX PSU BANK |
LONG |
40.41
|
2010-Nov-05
|
| CNX REALTY |
LONG |
91.29
|
2008-Jan-14
|
| CNX SERVICE |
LONG |
11.61
|
2015-Mar-03
|
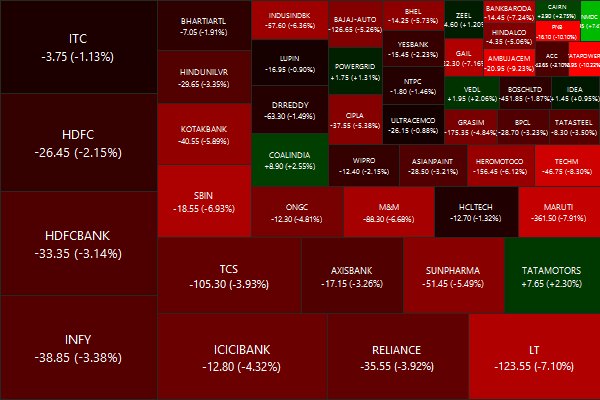
A week that saw momentum come crashing down. Worst part: CNX REALTY is more than 91% down from its peak in Jan’08…