Category: Investing Insight

Investing insight to make you a better investor.

Leaders and Laggards

Lagged correlations

Excess winter snow-fall in the Himalayas lead to floods in Bangladesh during spring. If we know that that there was excess snow-fall in the Himalayas this season, we can be better prepared to handle the floods four-months from now. This is the idea behind studying lagged correlations.

If we took a pair of sector indices and lagged their returns, can we find an index that “leads” an other and profit from it?

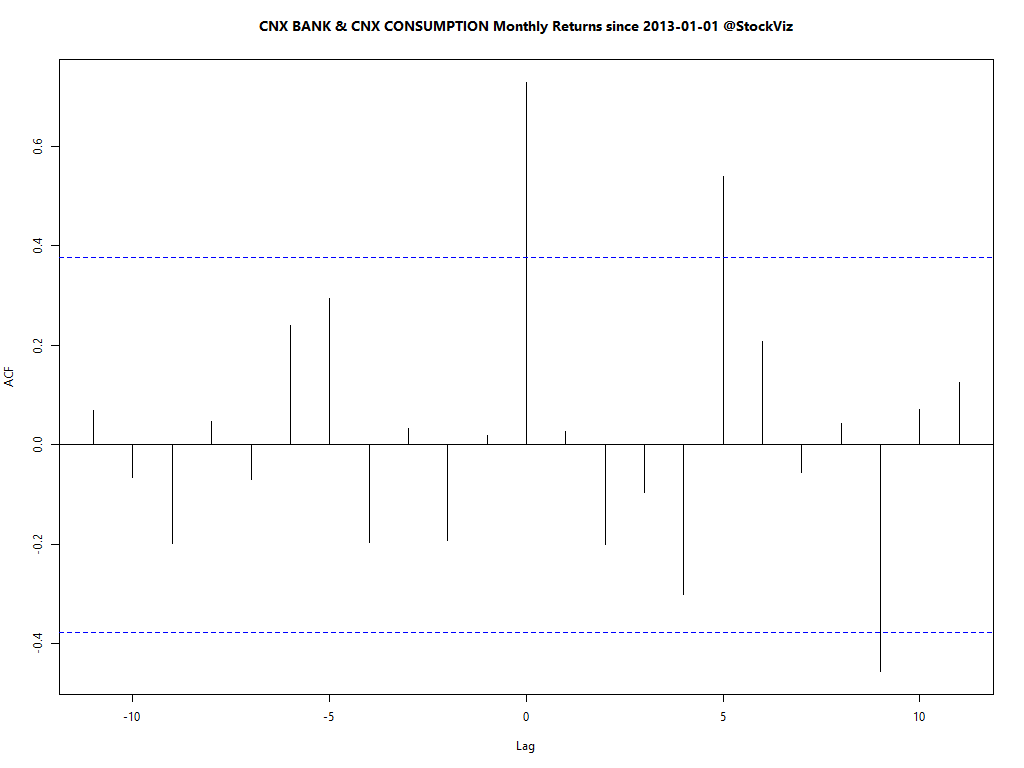
CNX BANK.CNX CONSUMPTION.monthly.lag

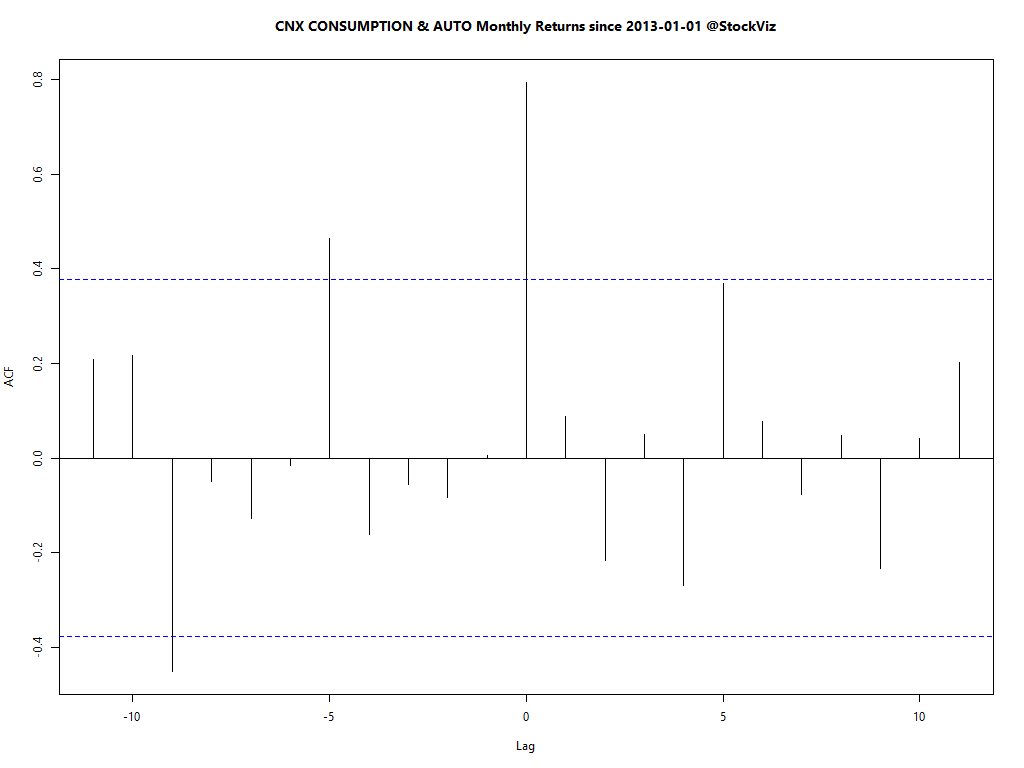
The chart above is called the cross-correlation plot. It shows that there are two lags, 5 and 9, where CNX BANK lags CONSUMPTION. A scatter plot shows how monthly-returns are correlated to each other across different lags and confirms the relationship:

CNX BANK.CNX CONSUMPTION.monthly.scatter

Finding

We found a number of index pairs that lead/follow one another. In addition to the CNX BANK and CNX CONSUMPTION indices above, CNX INFRA and CNX CONSUMPTION, CNX IT and CNX FINANCE, CNX CONSUMPTION and AUTO display this dynamic.

CNX INFRA.CNX CONSUMPTION.monthly.lag

CNX IT.CNX FINANCE.monthly.lag

CNX CONSUMPTION.AUTO.monthly.lag

Data mining warning

We cannot draw any conclusion from this “finding.” We mined 20 indices over 5 years to dig these nuggets out. The result is spurious. From a statistical point of view, there is no index that consistently leads or lags another.

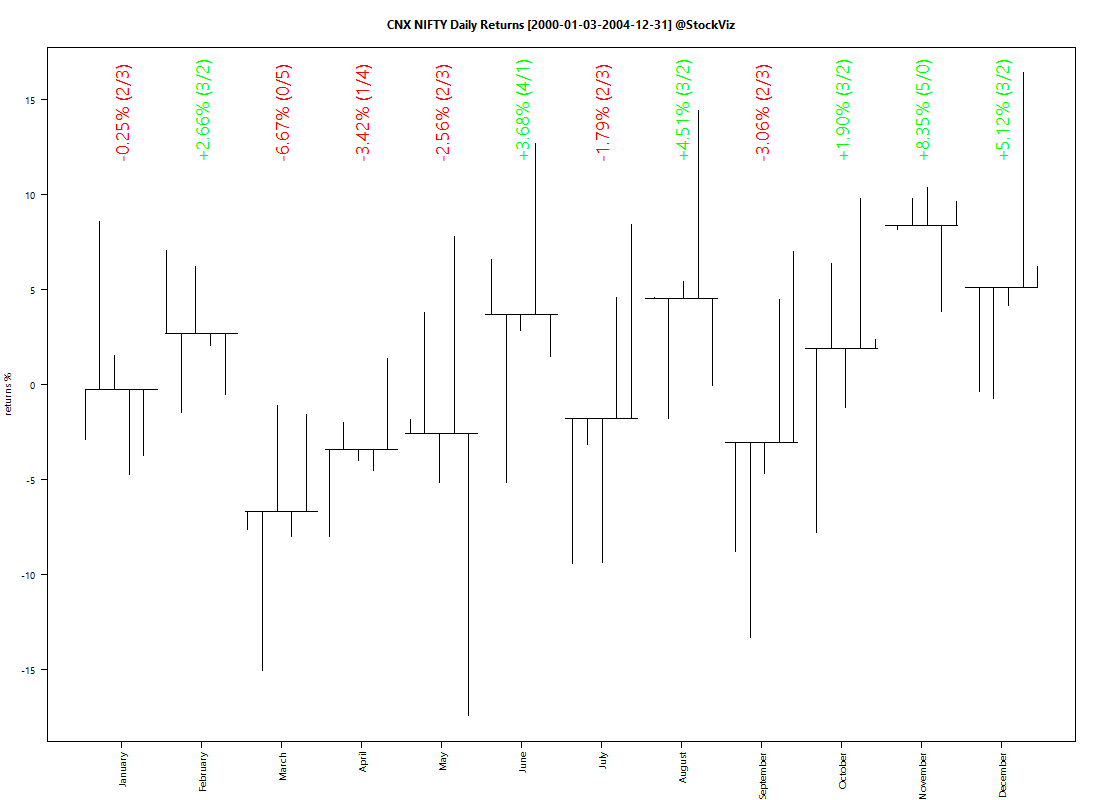
Related: Should you care about monthly returns of the Nifty?

The MNC Fund Gravy Train

What are MNC Funds?

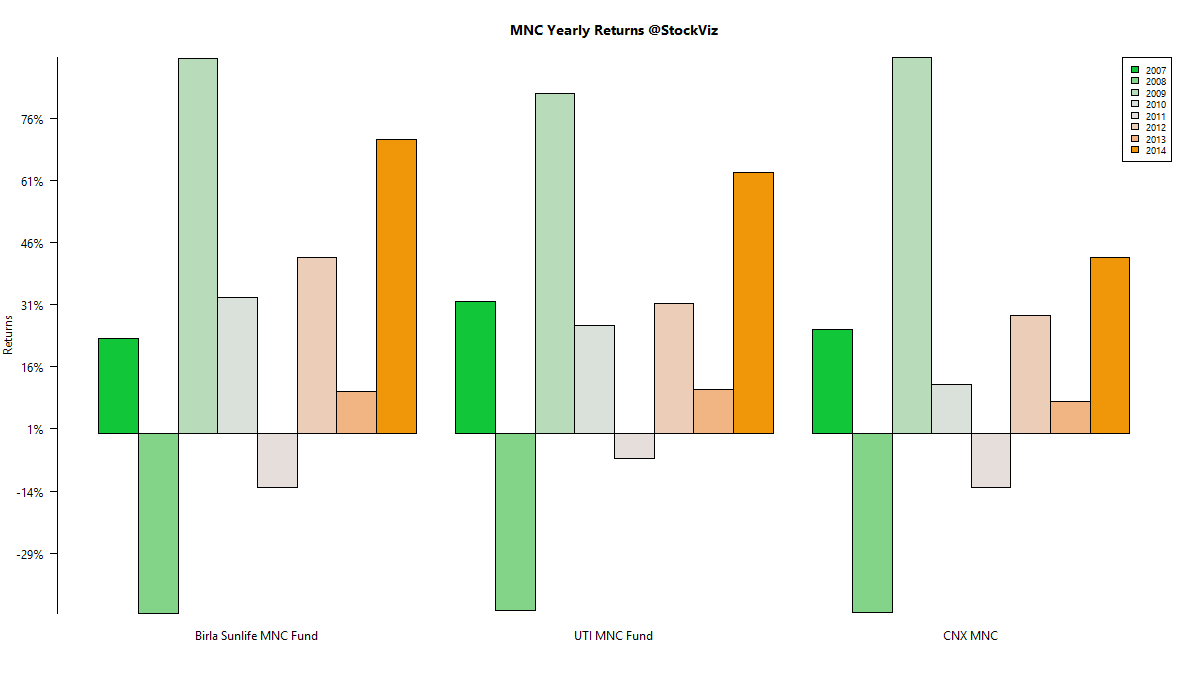
MNC funds invest in the Indian listed shares of foreign firms, like Bosch, Britannia and Colgate Palmolive. The funds are bench-marked against the CNX MNC Index.

The MNC index has out-performed pretty much every other market-cap index. We had discussed this previously and had pointed out that the UTI MNC Fund is decent place to get exposure to this asset class.

UTI vs Birla Sun Life

Thankfully, there are only two funds that track this asset class – one is the UTI MNC Fund and the other is the Birla Sun Life MNC Fund. Here’s how their growth schemes compare:

Birla Sun Life MNC fund vs. UTI MNC fund


Between 2006-07-03 and 2015-03-19, BSL MNC Fundhas returned a cumulative 478.61% with an IRR of 22.31% vs. UTI MNC Fund’s cumulative return of 427.17% and an IRR of 21.02%. (http://svz.bz/1Exk126)

The difference in performance between the two funds is de minimis when you consider that the period of comparison is almost eight years. The main thing to focus on here is that an IRR of ~22% is extremely hard to achieve in any asset class over that stretch of time.

MNC.funds.2015-3-20

Active Management

SYMBOL Birla Sunlife MNC Fund UTI MNC Fund CNX MNC
INGVYSYABK 8.97 3.01
ICRA 8.67
HONAUT 8.53 3.48
BAYERCROP 8.33
BOSCHLTD 5.99 7.19 9.22
GILLETTE 5.89 2.71
GLAXO 5.48 1.44 2.59
PFIZER 5.15 1.38
MARUTI 3.62 7.16 18.09
STERLINH 3.61
CRISIL 3.01 2.92
HINDUNILVR 2.74 4.21 24.37
CUMMINSIND 2.73 4.36 4.38
WABCOINDIA 2.47 0.32
ACC 1.96
BATAINDIA 1.65
HITACHIHOM 1.64
FAGBEARING 1.47
KANSAINER 1.45
COLPAL 1.39 1.33 5.02
PGHH 1.35 1.92
OFSS 1.15 2.43 2.62
SMLISUZU 1.15 0.12
AMBUJACEM 1.11 3.64 7.25
NESTLEIND 0.94 1.38
ALSTOMT&D 0.72 1.76
BLUEDART 0.71 0.58
SIEMENS 0.7 3.04 4.66
FMGOETZE 0.69
ITC 0.66
AIL 0.59 0.17
DISAQ 0.57
AKZOINDIA 0.53 1.6
FULFORD 0.52
ABB 0.49 2.51
SANOFI 0.46 1.41
ITDCEM 0.46 2.31
CASTROLIND 0.45 2.97 2.59
RANBAXY 0.36 0.58
SCHNEIDER 0.26
MPHASIS 0.07 2.33 1.2
EICHERMOT 6.28
BRITANNIA 4.17 4.84
MCDOWELL-N 2.53
SKFINDIA 2.47
MAHINDCIE 2.13
SSLT 1.95 7.96
INGERRAND 1.49
MONSANTO 1.13
TIMKEN 1.07
CLNINDIA 0.97
GSKCONS 0.9 2.69
AUTOAXLES 0.38
WHIRLPOOL 0.21
Both funds are actively managed. There is no “index-hugging” going on here. However, between the two, the Birla Sunlife fund significantly differs from the CNX MNC index.

Portfolio trajectories

Both have allowed their winners to run and have different positions that have worked out well for them. Here’s how the Birla Sunlife Fund looks like:

And this is how the UTI Fund looks like:

The View

You will do well to have either fund in your portfolio. But given the narrow focus of these funds, these should complement your portfolio rather than dominate it. If you have any questions, feel free to get in touch!

Funds that (also) invest in foreign markets

Diversification vs. Returns vs. Currency hedging

Some Indian funds, under the guise of diversification, invest in foreign equities. However, the benefit of diversification comes from investing across asset classes. Does investing in the same asset class, i.e., equities, really give the investor uncorrelated returns? Or are funds using international equities as a rupee-short in disguise?

World Equity Correlation

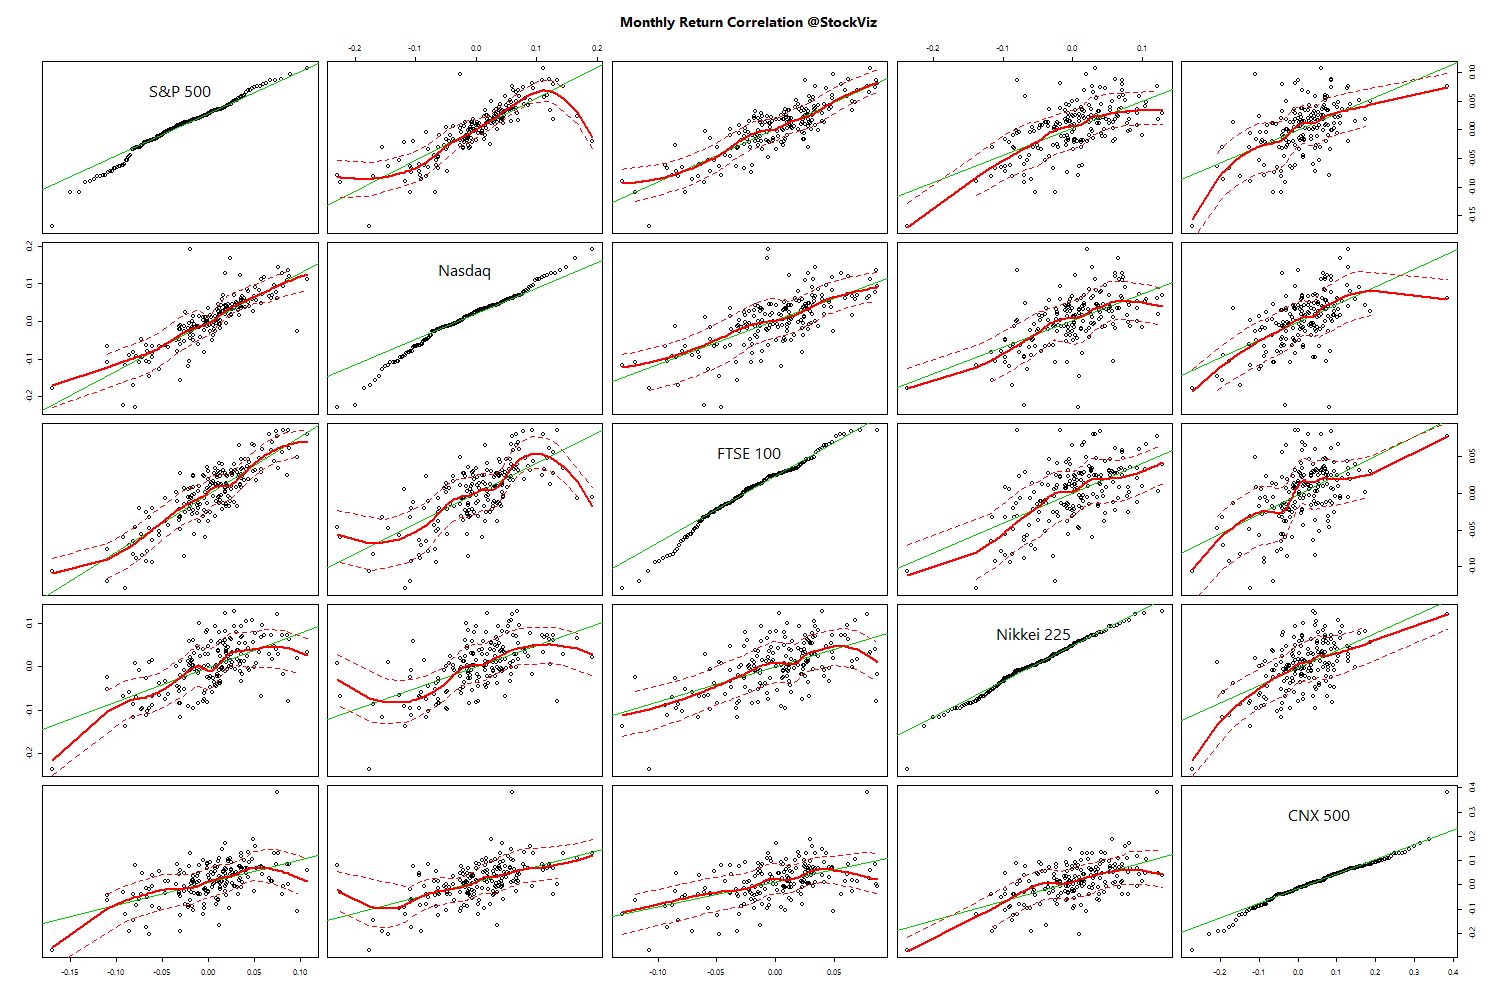
When you run correlations between the monthly returns of the S&P 500, Nasdaq, FTSE 100, Nikkei and CNX 500, here’s what you get:

S&P 500 Nasdaq FTSE 100 Nikkei 225 CNX 500
S&P 500 1.0000000 0.8387130 0.8537901 0.6144493 0.5226191
Nasdaq 0.8387130 1.0000000 0.6913427 0.5909979 0.5499836
FTSE 100 0.8537901 0.6913427 1.0000000 0.5717508 0.5216565
Nikkei 225 0.6144493 0.5909979 0.5717508 1.0000000 0.5633231
CNX 500 0.5226191 0.5499836 0.5216565 0.5633231 1.0000000

world-correlation

A zero or negative correlation would validate the diversification claim. But that is not the case. Indian equities are loosely correlated with international stock markets.

World equity Returns

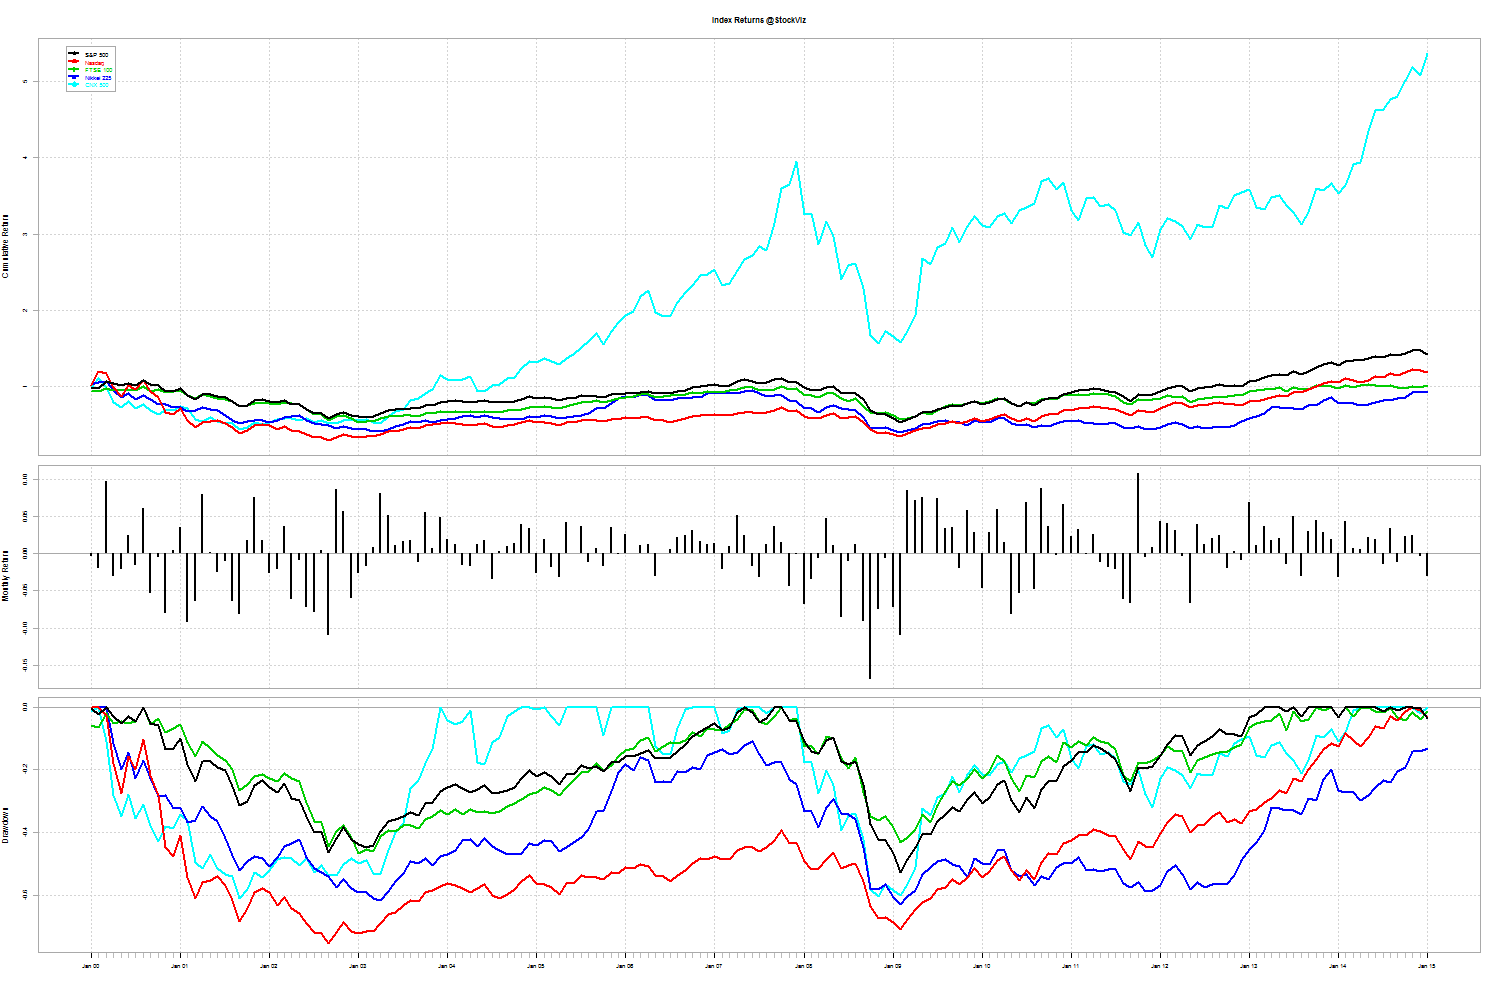
When it comes to returns, Indian equities have outperformed all the main indices.
world equity returns

Currency hedge

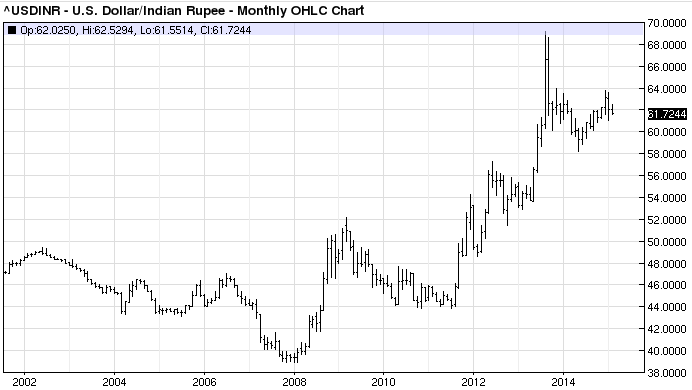
The 50% depreciation in the rupee since 2000, however, make a strong case for adding short-INR/long-USD assets.
USDINR

Competency

Although Rupee depreciation makes a case for holding dollar assets, why do it in a convoluted way by buying individual stocks? The competency of an Indian asset manager in picking stocks in a foreign market is questionable.

For example, the PPFAS fund holds about 20% of its assets in foreign equities. This, at a time when most developed markets have given up on stock-picking and have turned to indexing instead. Can a manager, sitting in India, select stocks in a foreign market that outperform that market?

The problem with a mixed-in portfolio like PPFAS is that it is very difficult to break performance down to its components. Between 2014-01-01 and 2015-02-25, PPFAS Long Term Value Fund has returned a cumulative 44.20% with an IRR of 37.45% vs. BSE MID CAP’s cumulative return of 58.84% and an IRR of 49.50%. (http://svz.bz/1DZzX1L)

Conclusion

Exposure to US Dollar assets makes sense given the historical depreciation of the Indian rupee against the US dollar. However, we are not convinced that buying a fund that tries to pick stocks in foreign markets is the way to go. Investors would be better of being net short the rupee, or buying the S&P 500 ETF separately.
Mad Trading: Mutual Fund Edition

Churn and Burn

When retail investors trade stocks, the market impact of trading decisions are de minimis. However, when a fund trades its portfolio, it has a noticeable market impact. According to a study quoted here in the Economist article, when academics compared the returns of the funds with their estimated trading costs, the funds with the highest costs had the lowest returns.

For contrast, lets compare the DWS Tax Saving Fund with Templeton India Growth Fund.

DWS Tax Saving Fund

First, investors would have been better off buying a CNX Midcap index fund. Between 2006-06-01 and 2015-02-19, DWS TAX SAVING FUND has returned a cumulative 143.52% with an IRR of 10.74% vs. CNX Midcap’s cumulative return of 209.71% and an IRR of 13.83%. (http://svz.bz/1EHGTxu)

Second, the fund looks like a fun trading vehicle for the manager rather than something that is meant to build wealth over the long term. Here’s how the manager has churned his portfolio:

Not only should you stay away from this fund, but you should use it in informational videos on how not to churn your portfolio.

Templeton India Growth Fund

First, even though returns are not the absolute best that it could have been, between 2006-06-01 and 2015-02-19, Templeton India Growth Fund has returned a cumulative 267.72% with an IRR of 16.09%.(http://svz.bz/1EHIljm)

Second, the portfolio doesn’t look like a mad scramble like the one above. Markedly fewer holdings for longer:

When you compare the two funds with each other, you can see who is doing a better job (http://svz.bz/1EHJCa2):

DWS TAX SAVING FUND vs. Templeton India Growth Fund

Conclusion

Beware of funds that churn their portfolios frequently. It might be a reflection of shoddy research, poor conviction or immaturity that you end up paying for.