Today’s pick is [stockquote]RAYMOND[/stockquote]. The stock has made a 12% since the Rs. 335 levels of last October.
The up-trend since January this year has seen resistance around the 420 levels a few times. The stock has seen many corrections in the last one year, and is trading above the near-term support of 340.
Oscillators RSI and CMO are at currently at 53 and -4. At this level of RSI, the stock has to decide on which way to go. CMO doesn’t suggest an imminent move either.
The MACD and signal lines are closing in. The histogram levels are on a decline suggesting a possibility of an up-move.
The GMMA chart for the stock is not suggesting a directional move, one way or the other. The short-term lines are very close to each other and the long-term lines are entangled.
Raymond’s average correlation of 0.57 with the Niftybees is positive and strong. At this level, the stock will not replicate the Niftybees. [stockquote]NIFTYBEES[/stockquote]
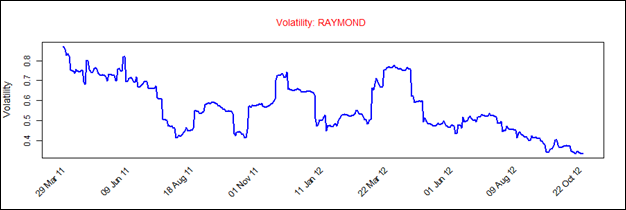
Raymond has a historical volatility in the range of 0.4 to 0.8. The scrip’s volatility is currently on a decline because of the consolidation phase the stock is undergoing.
Looking at these technicals, it appears that the stock is presently in the consolidation territory. A short-term hold is suggested. For the long-term outlook of the scrip, watch the long-term GMMA lines to surface a trend.


