Today’s pick is [stockquote]ASIANPAINT[/stockquote]. The stock has made a 24% since the 3130 levels of October 2011.
The up-trend since January this year has seen resistance around the 4000 levels twice already; this will act as a near-term resistance level. The longer-term chart shows a support around 2500.
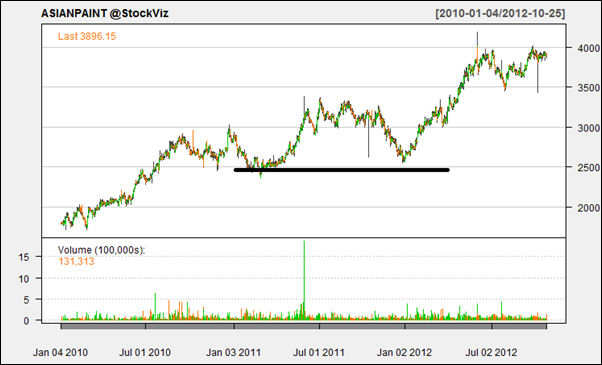
The stock is currently exhibiting a long-term flag formation. A decisive breakout above the 4000 levels can initiate the next leg of up-trend.
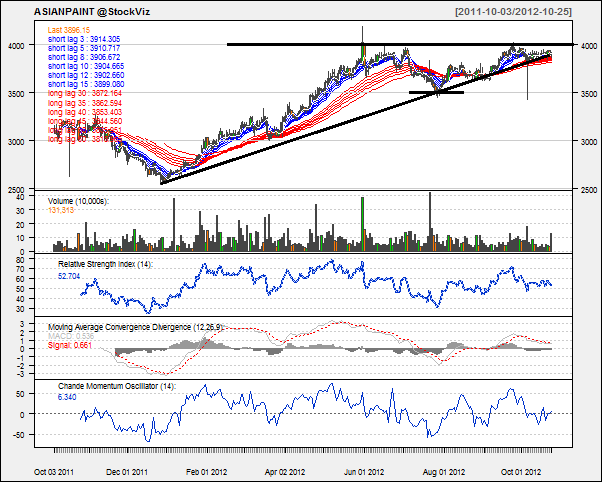
Oscillators RSI and CMO are at currently at 52 and 6. At this mid-level RSI, the stock has still got around 20 points to reach either oversold or overbought levels. The current mid-range CMO is also unable to suggest any imminent move.
MACD line and signal line are also getting in a twist. The static histogram levels are adding onto the trendless-ness of the scrip.
The GMMA chart although seems to direct a good news for the long-term. The short-term lines are very close to each other and not directing anything, but the expanding long-term lines are giving out a good cue for the scrip. A continuity of the same behavior will decide upon the fate of the stock for the coming months.
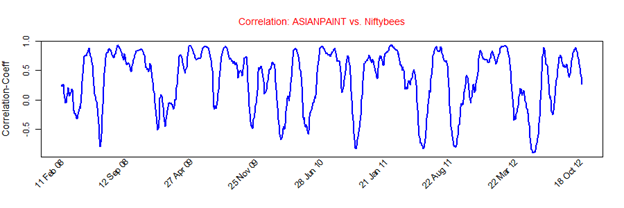
ASIANPAINT’s average correlation of 0.35 with the Niftybees is positive but not strong. At this level the movements of the stock will not be able to replicate the same magnitude as Niftybees. [stockquote]NIFTYBEES[/stockquote]
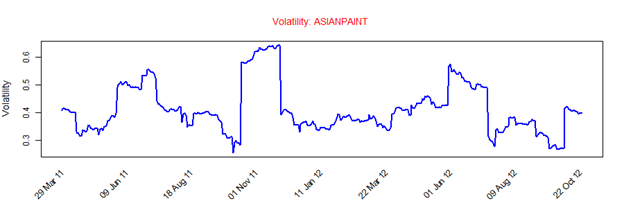
ASIANPAINT has a historical volatility in the range of 0.2 to 0.7. The scrip’s volatility is currently in the middle of this range.
Looking at these technicals, it appears that the stock is presently in the consolidation territory. A short-term hold is suggested. For the long-term outlook of the scrip, a breakout of the flag in either direction would be a very strong signal.
