Tag: momentum

Relative Strength Spread

Introduction

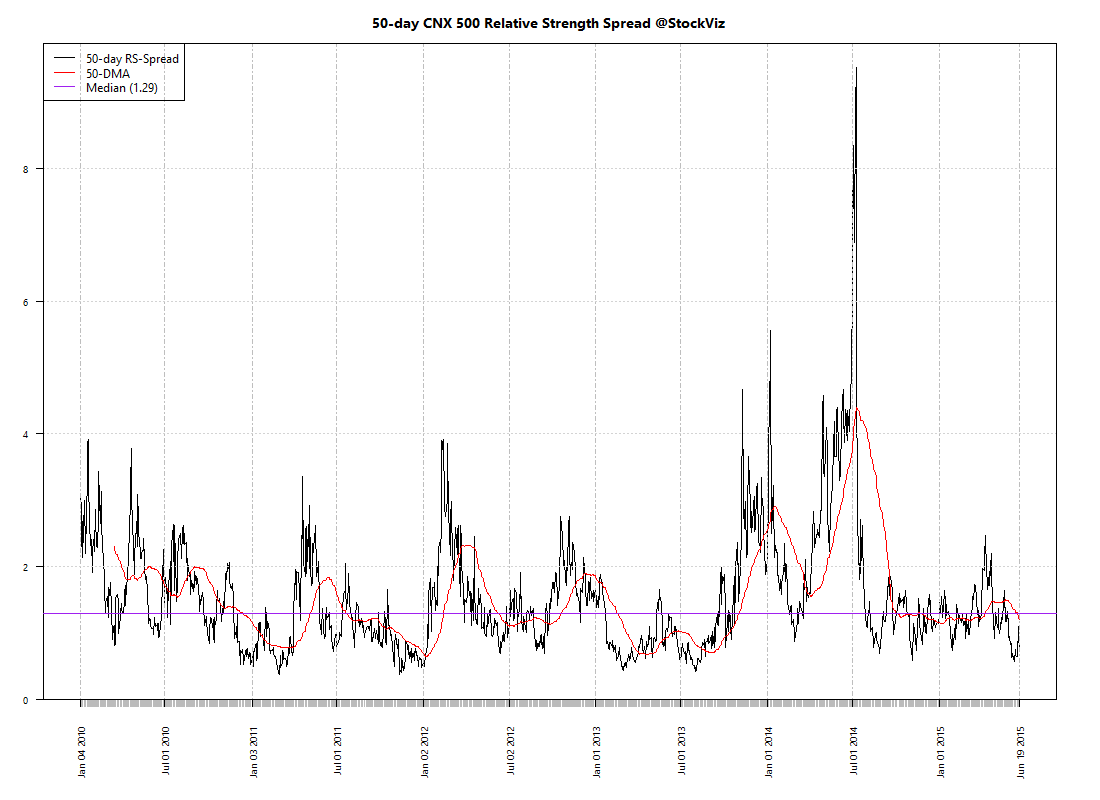
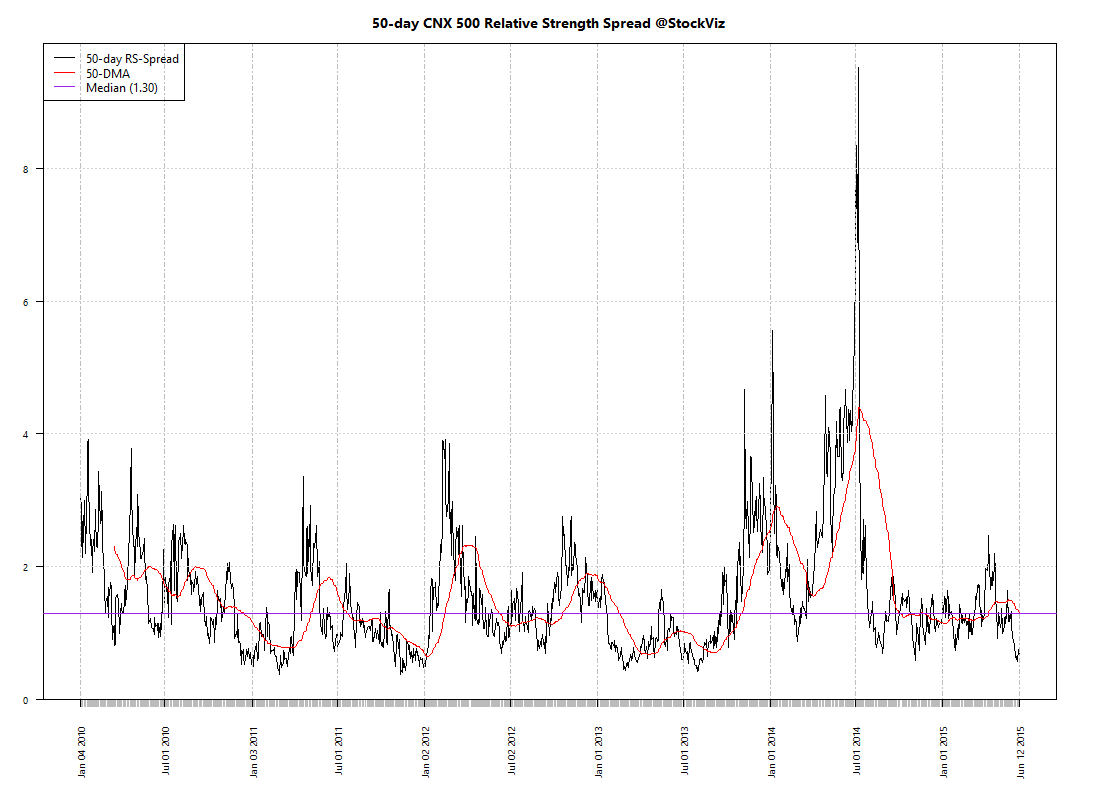
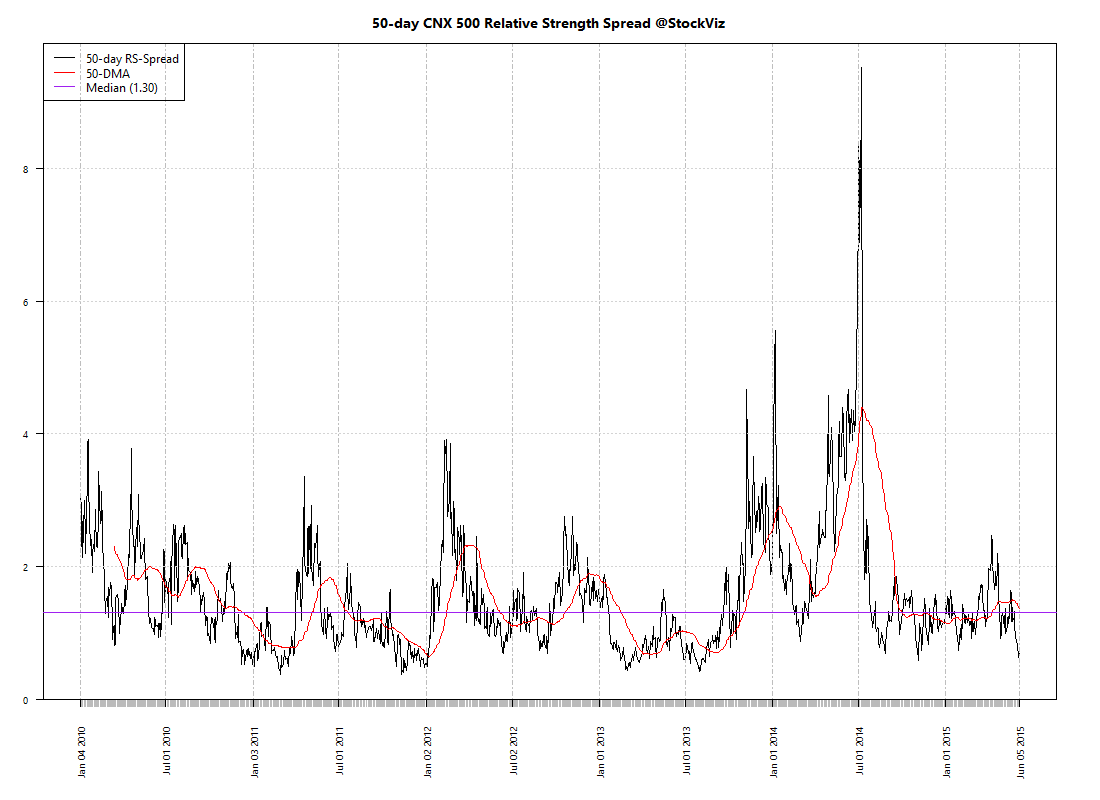
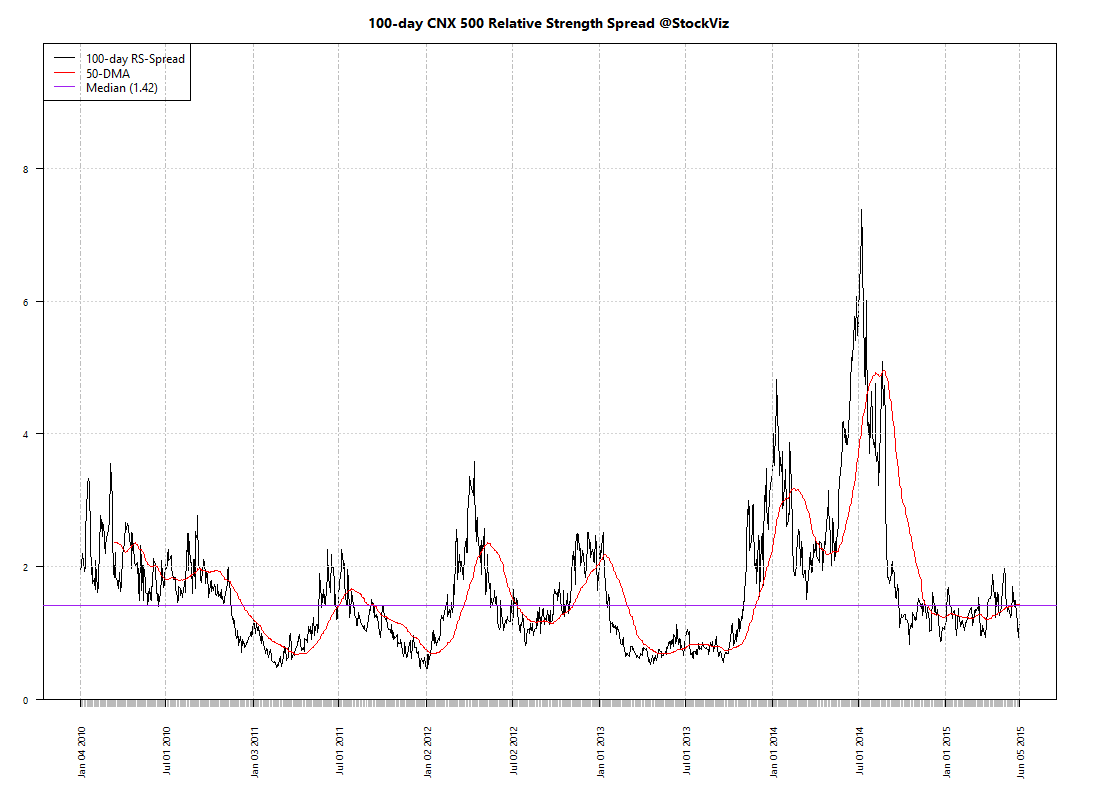
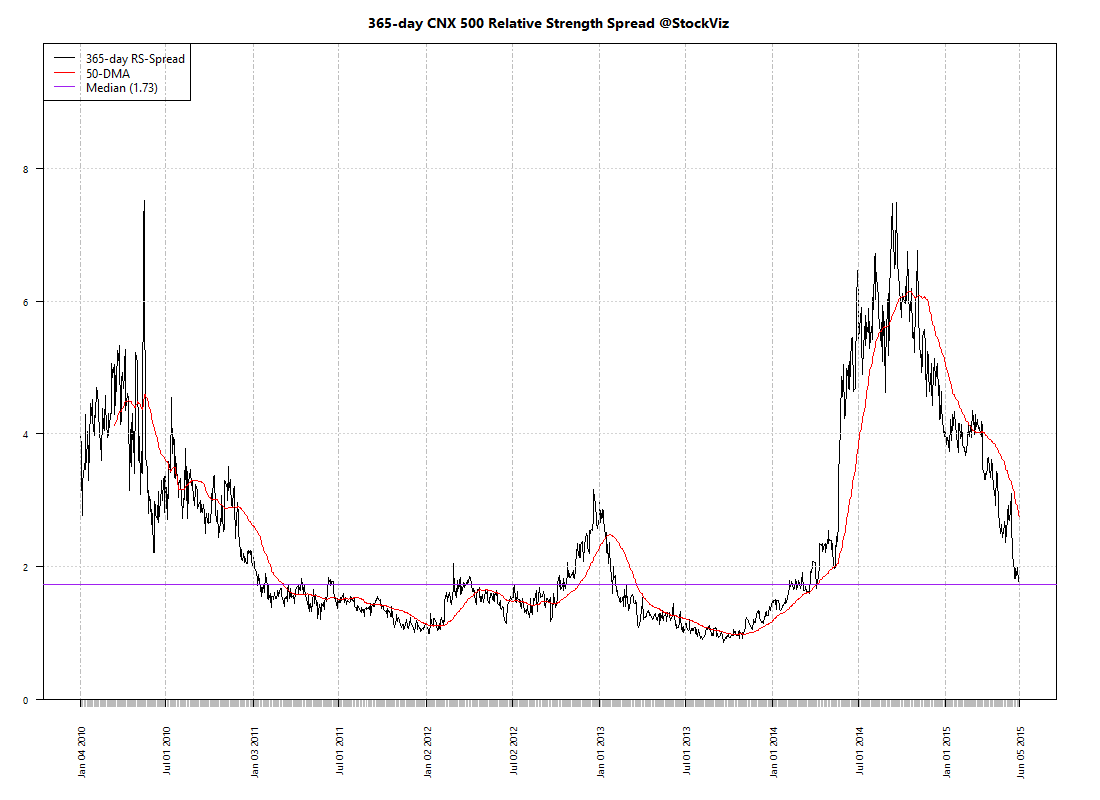
The Relative Strength Spread takes all the stocks in the CNX 500 index, sorts them by their relative performance vs. the index and takes the ratio between the median relative performance of the top decile and the bottom decile. When you plot the spread, a rising chart indicates that relative strength leaders are performing better than relative strength laggards.

Relative Strength Spread Charts

CNX 500.relative-spread-index.50

CNX 500.relative-spread-index.100

CNX 500.relative-spread-index.365

High Relative Strength Spread environments provide the largest momentum profits – winning trades easily eclipse losing trades.

The 365-day RS-Spread chart clearly demarcates the “Modi-Mania.” The Modi-Mania was manna from heaven for trend-following strategies. However, the post-Modi-Mania phase has seem most momentum algorithms struggle.

A silver-lining is that the 50-day chart shows that we are probably due for a momentum comeback. But it is not uncommon to have prolonged periods of the “doldrums” where momentum is just “average.” It maybe tempting to give up on trend-following strategies during these periods. But just like how we cannot predict momentum crashes, we cannot predict momentum comebacks. So it is important to maintain allocation to momentum strategies.

Conclusion

The Relative Strength Spread index can be useful in explaining momentum profits. However, it is not much of a predictor of future momentum returns. It could also be used to explain the “skill vs. luck” question of returns – just like how a rising tide lifts all boats, a high RS-Spread environment will lift all portfolio returns.

Going forward, we will update the 50-day Relative Strength Spread chart on our weekly Index Update posts.

Index Update 06.06.2015

MOMENTUM

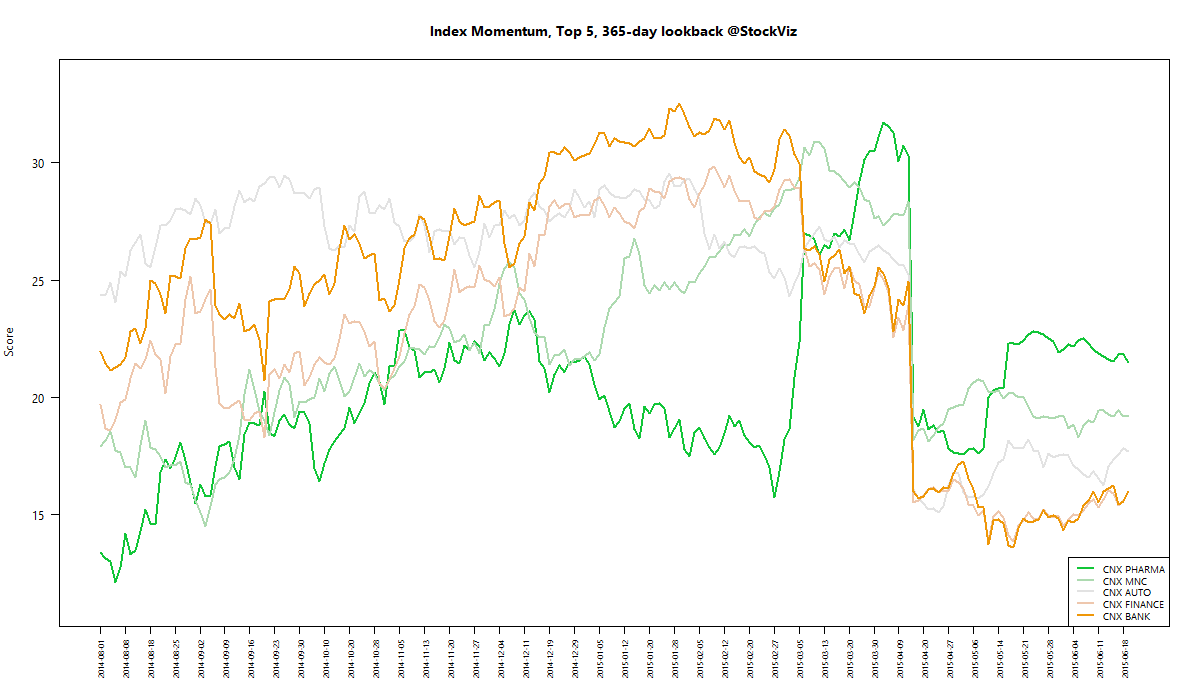
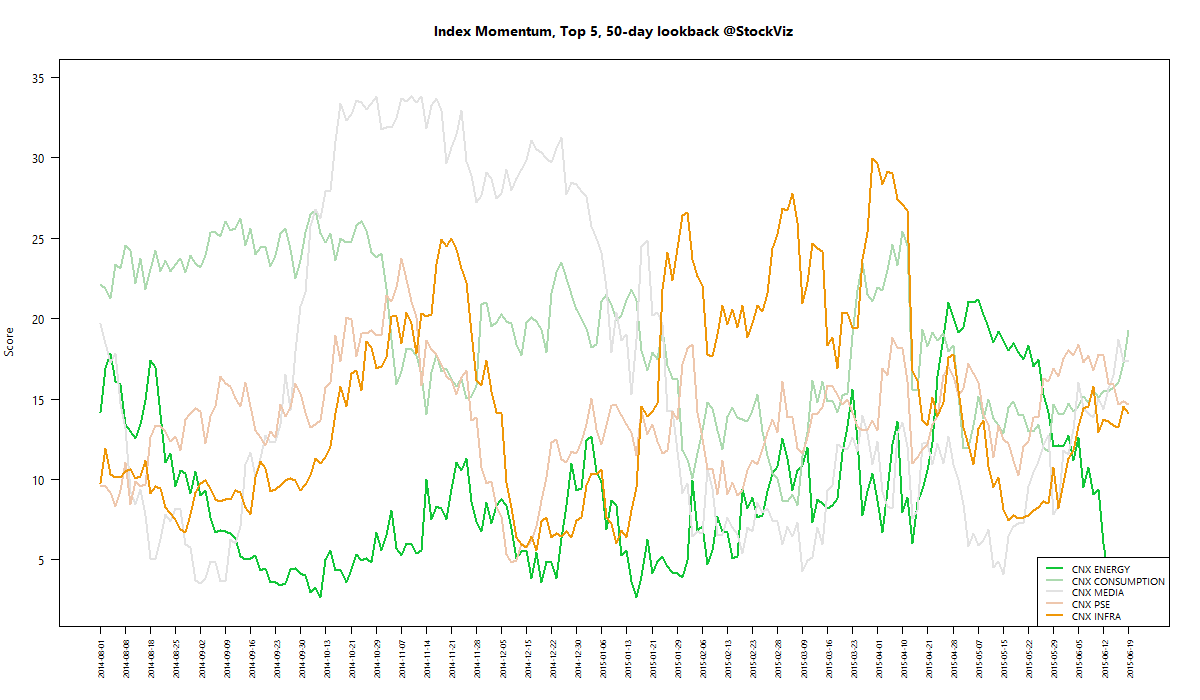
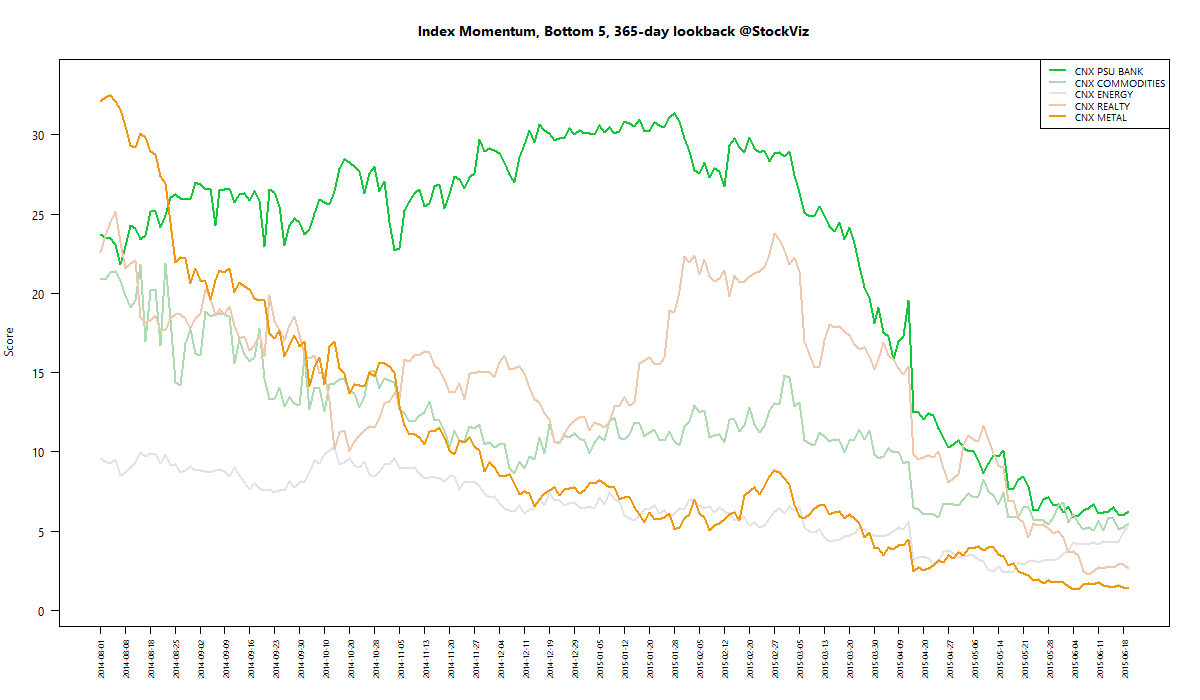
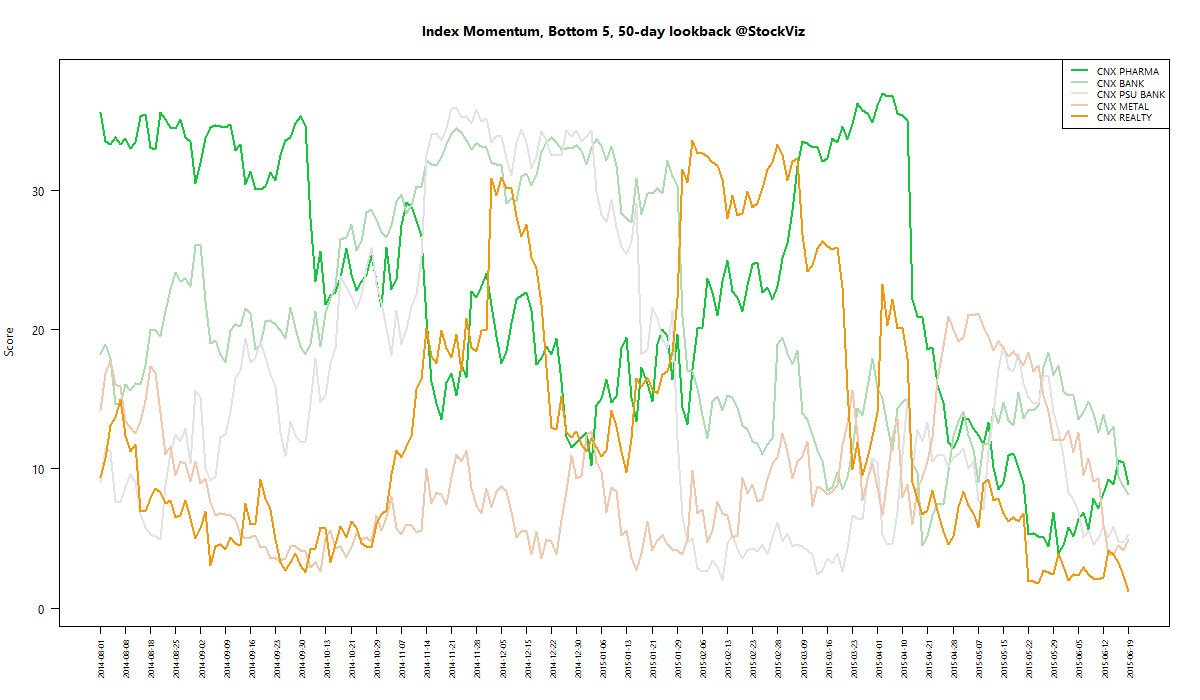
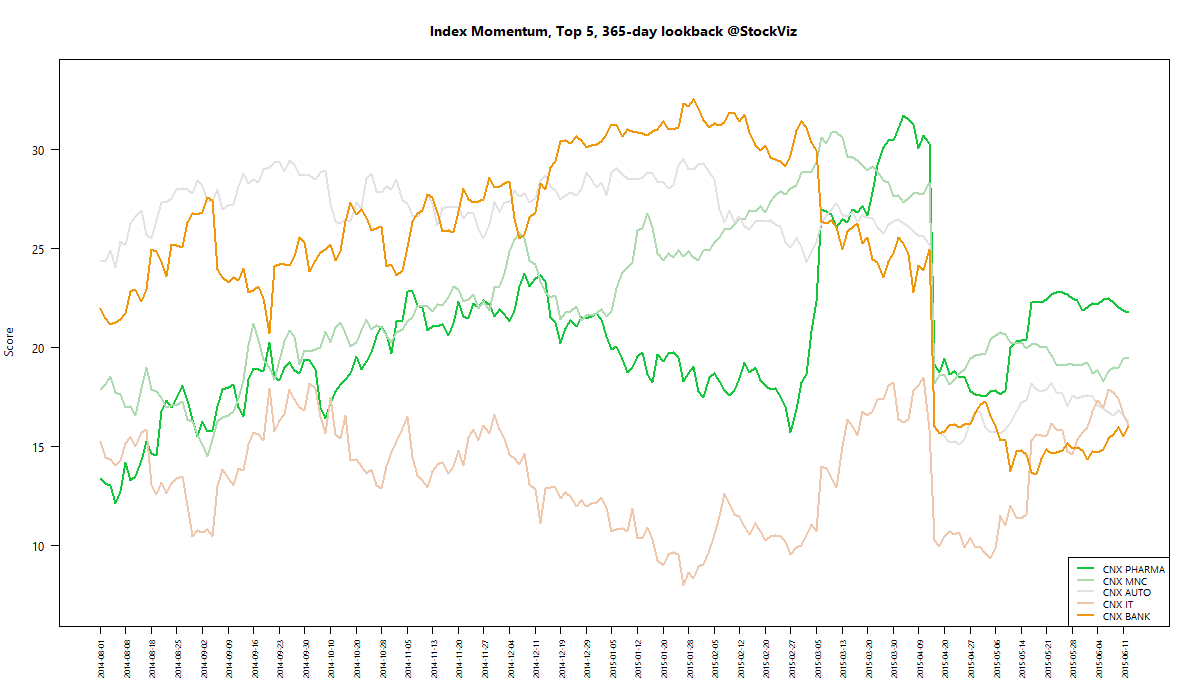
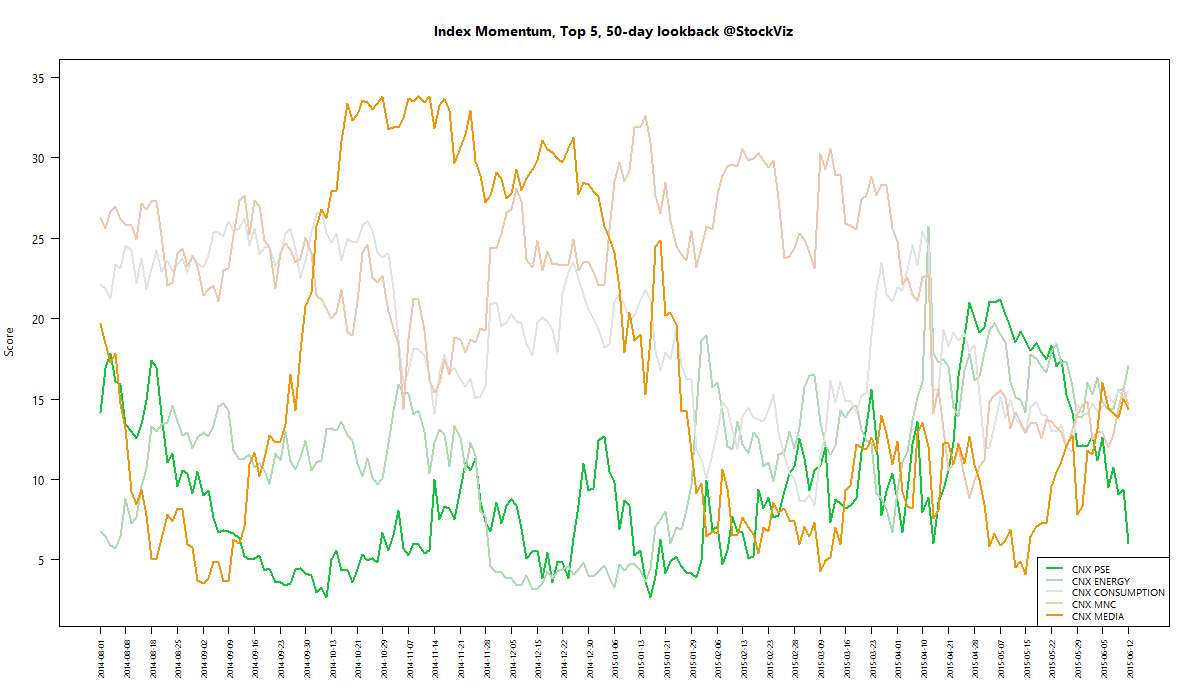
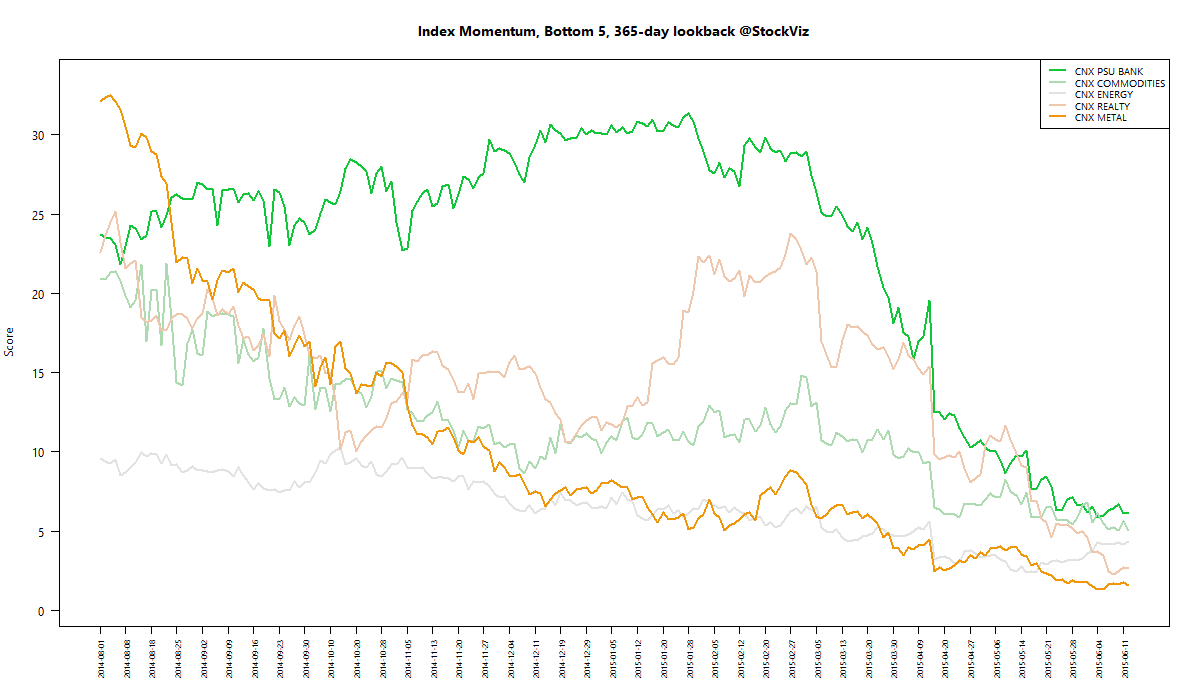
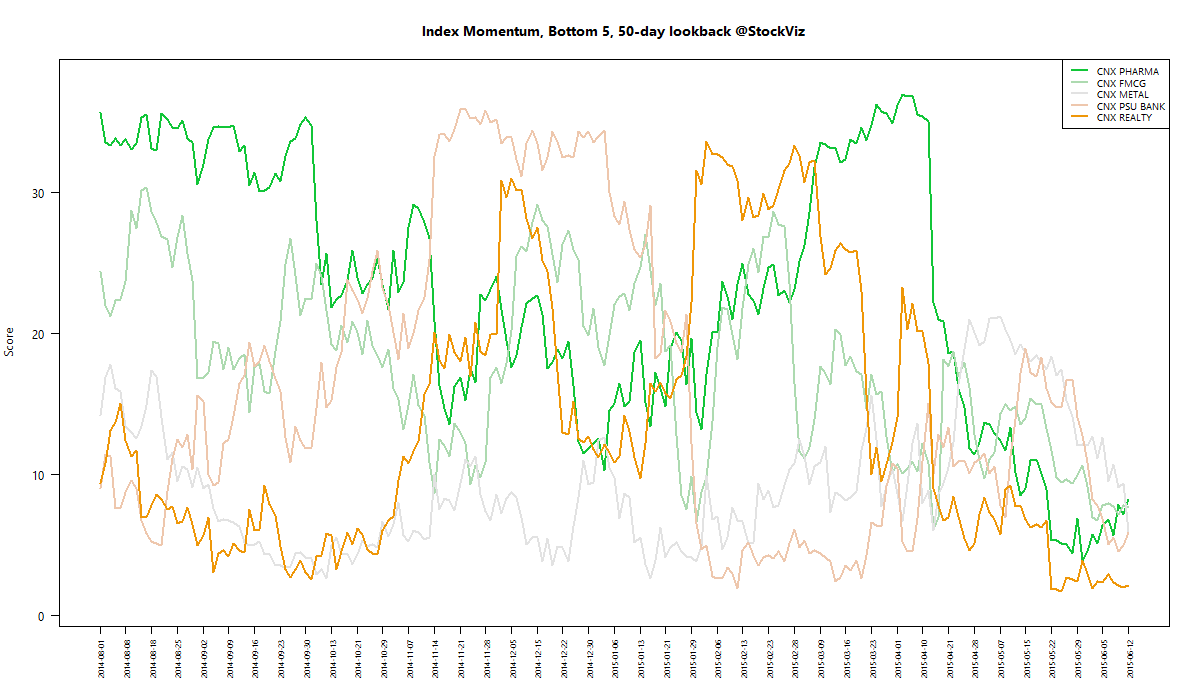
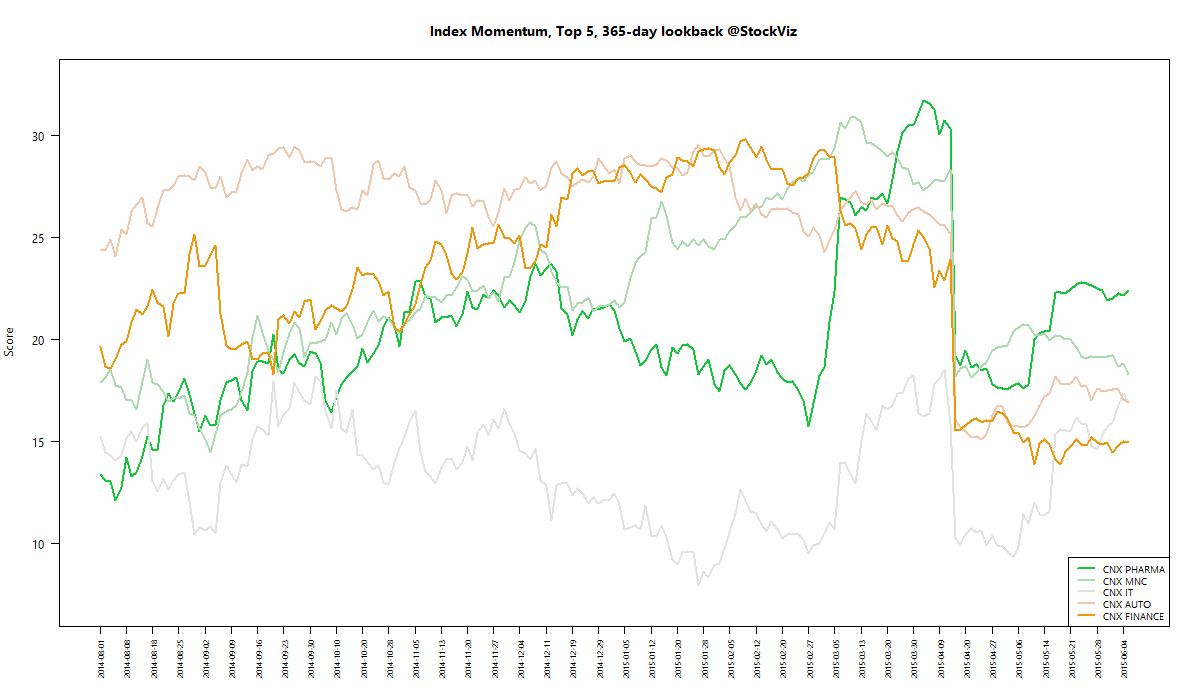
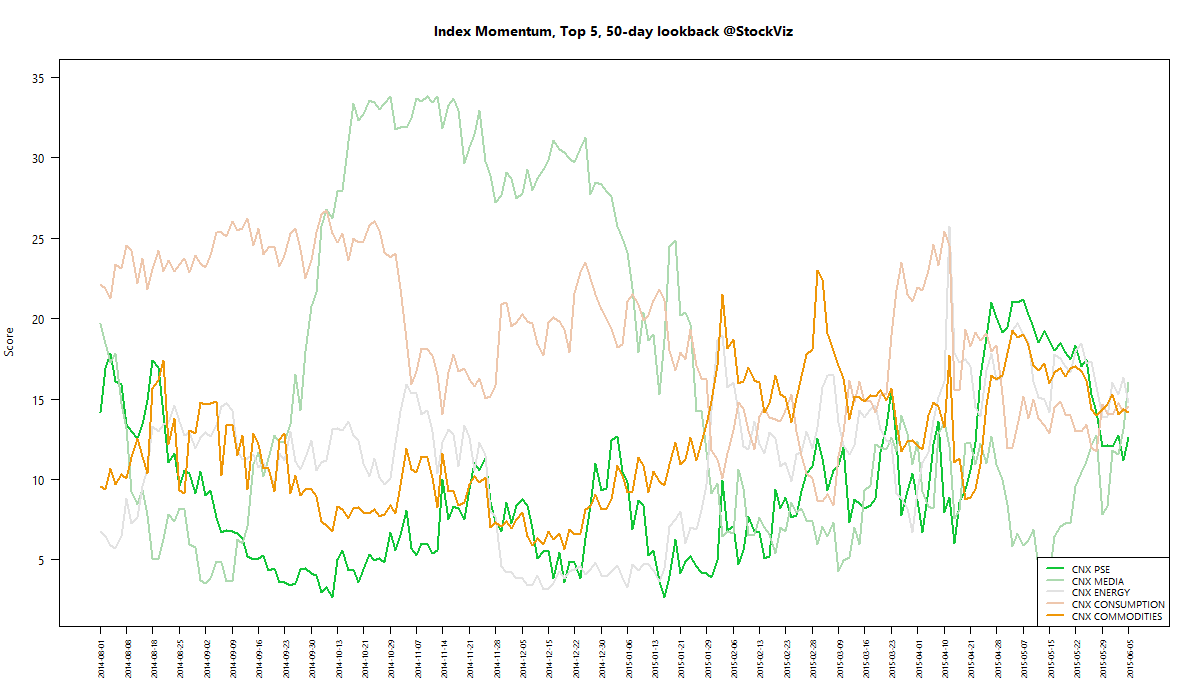
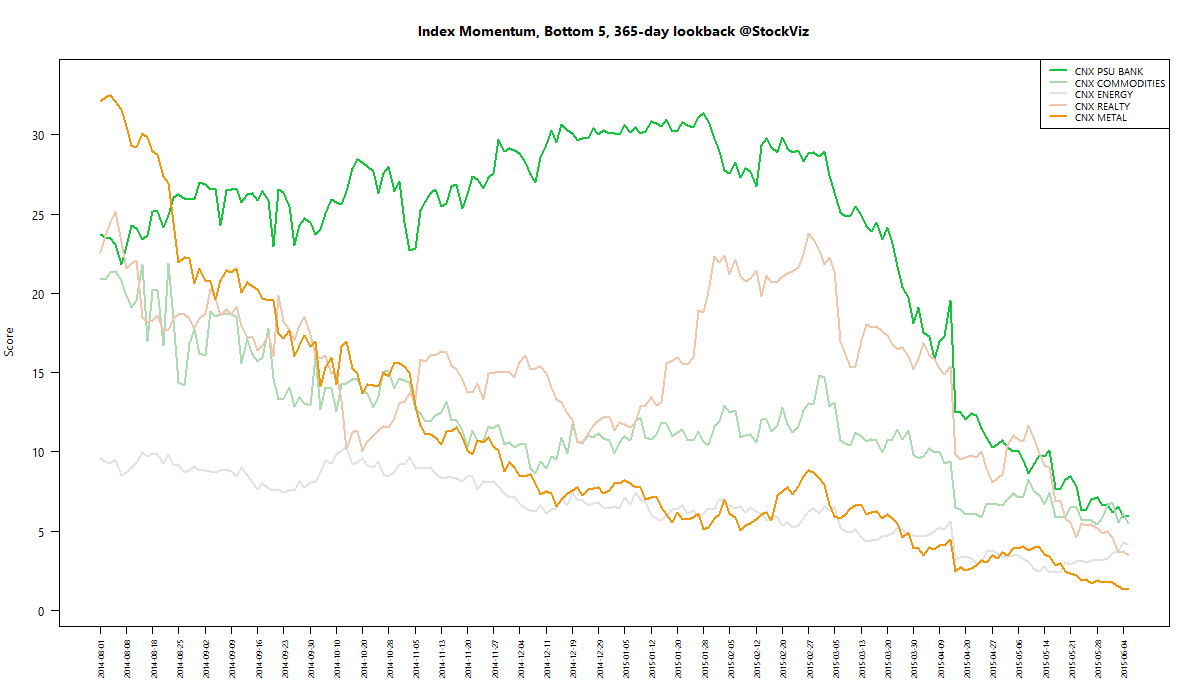
We run our proprietary momentum scoring algorithm on indices just like we do on stocks. You can use the momentum scores of sub-indices to get a sense for which sectors have the wind on their backs and those that are facing headwinds.

Traders can pick their longs in sectors with high short-term momentum and their shorts in sectors with low momentum. Investors can use the longer lookback scores to position themselves using our re-factored index Themes.

You can see how the momentum algorithm has performed on individual stocks here.

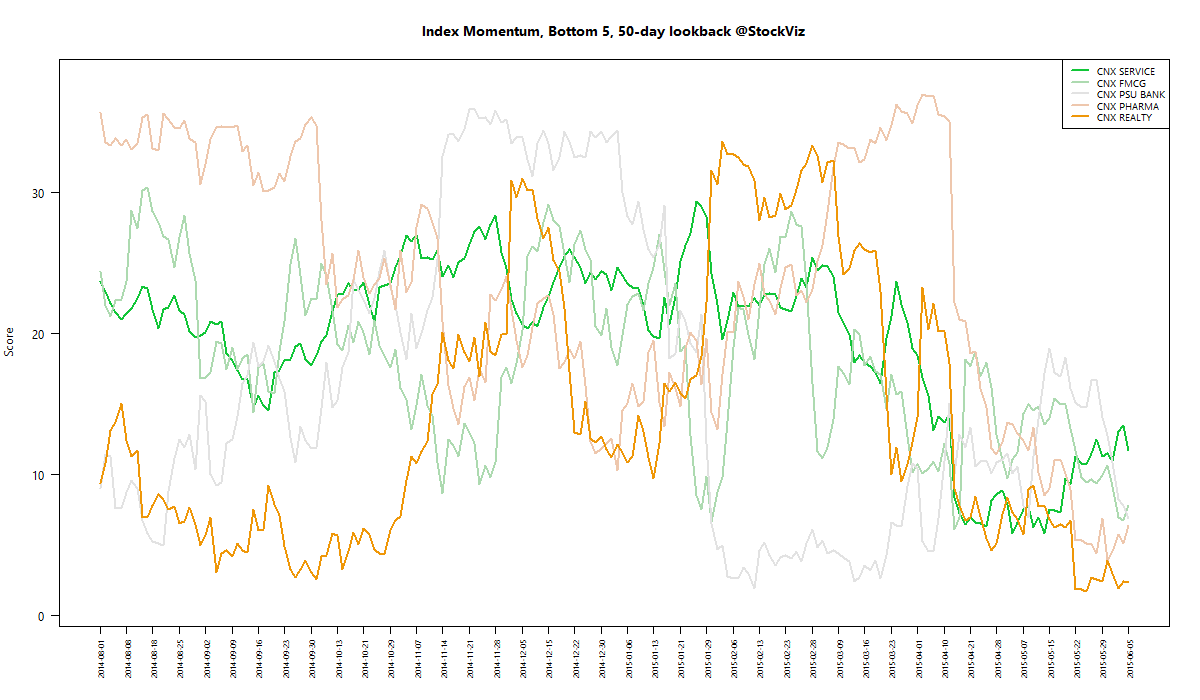
Here are the best and the worst sub-indices:

index momentum best 365 2015-06-05 png

index momentum best 50 2015-06-05 png

index momentum worst 365 2015-06-05 png

index momentum worst 50 2015-06-05 png

Refactored Index Performance

50-day performance, from March 24, 2015 through June 05, 2015:

Trend Model Summary

Index Signal % From Peak Day of Peak
CNX AUTO SHORT
11.07
2015-Jan-27
CNX BANK SHORT
14.62
2015-Jan-27
CNX ENERGY SHORT
29.22
2008-Jan-14
CNX FMCG SHORT
13.62
2015-Feb-25
CNX INFRA SHORT
49.05
2008-Jan-09
CNX IT SHORT
88.18
2000-Feb-21
CNX MEDIA SHORT
27.38
2008-Jan-04
CNX METAL SHORT
57.85
2008-Jan-04
CNX MNC SHORT
6.54
2015-Mar-12
CNX NIFTY SHORT
9.80
2015-Mar-03
CNX PHARMA SHORT
15.29
2015-Apr-08
CNX PSE SHORT
25.24
2008-Jan-04
CNX REALTY SHORT
90.30
2008-Jan-14
Banks and pharma down more than 15% from its April peak, Nifty 10% and MNC 7%…

Index Update 30.05.2015

MOMENTUM

We run our proprietary momentum scoring algorithm on indices just like we do on stocks. You can use the momentum scores of sub-indices to get a sense for which sectors have the wind on their backs and those that are facing headwinds.

Traders can pick their longs in sectors with high short-term momentum and their shorts in sectors with low momentum. Investors can use the longer lookback scores to position themselves using our re-factored index Themes.

You can see how the momentum algorithm has performed on individual stocks here.

Here are the best and the worst sub-indices:

index momentum best 365 2015-05-29 png

index momentum best 50 2015-05-29 png

index momentum worst 365 2015-05-29 png

index momentum worst 50 2015-05-29 png

Index Update 23.05.2015

MOMENTUM

We run our proprietary momentum scoring algorithm on indices just like we do on stocks. You can use the momentum scores of sub-indices to get a sense for which sectors have the wind on their backs and those that are facing headwinds.

Traders can pick their longs in sectors with high short-term momentum and their shorts in sectors with low momentum. Investors can use the longer lookback scores to position themselves using our re-factored index Themes.

You can see how the momentum algorithm has performed on individual stocks here.

Here are the best and the worst sub-indices:

index momentum best 365 2015-05-22 png

index momentum best 50 2015-05-22 png

index momentum worst 365 2015-05-22 png

index momentum worst 50 2015-05-22 png

Refactored Index Performance

50-day performance, from March 10, 2015 through May 22, 2015:

Trend Model Summary

Index Signal % From Peak Day of Peak
CNX AUTO SHORT
5.69
2015-Jan-27
CNX BANK SHORT
10.32
2015-Jan-27
CNX ENERGY SHORT
29.07
2008-Jan-14
CNX FMCG SHORT
9.54
2015-Feb-25
CNX INFRA SHORT
49.37
2008-Jan-09
CNX IT SHORT
87.72
2000-Feb-21
CNX MEDIA SHORT
29.01
2008-Jan-04
CNX METAL SHORT
56.14
2008-Jan-04
CNX MNC SHORT
3.97
2015-Mar-12
CNX NIFTY SHORT
5.97
2015-Mar-03
CNX PHARMA SHORT
8.25
2015-Apr-08
CNX PSE SHORT
26.16
2008-Jan-04
CNX REALTY SHORT
89.23
2008-Jan-14
Pharma and banks seem to be perking up.
And boy-oh-boy! MNCs have more or less covered their draw-down.

Practical Momentum – Conclusion

Recap

We began the exploration of a practical way to execute momentum using derivatives. We found that:

  1. A lookback period of one year works best (Part I)
  2. Because of survivorship bias, long-short underperforms long-only (Part II)
  3. Hedging with single-name put options doesn’t work(Part III)
  4. Larger long-only portfolios have smaller drawdowns and better performance than smaller long-only portfolios (Part III)

Conclusion

The way things stand, Momentum is best executed using a broad basket of stocks. There is no mechanical way to maintain a momentum driven derivative portfolio. You can explore long-only equity momentum here.