Tag: weekly

Weekly Recap: Electric Shocks

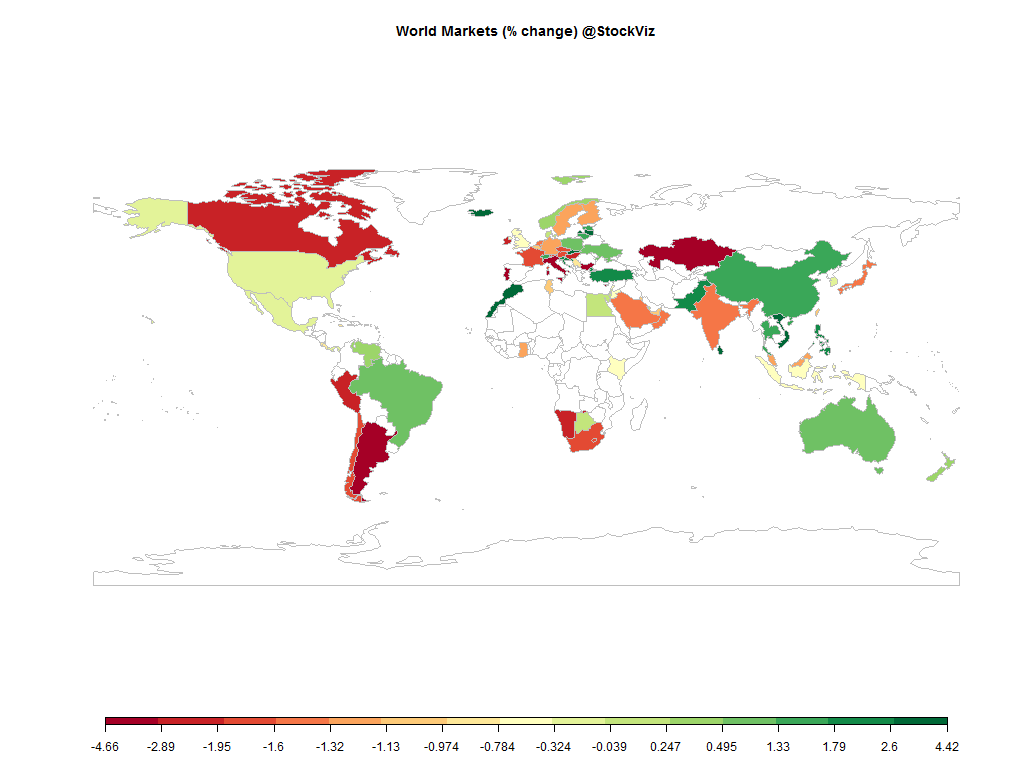
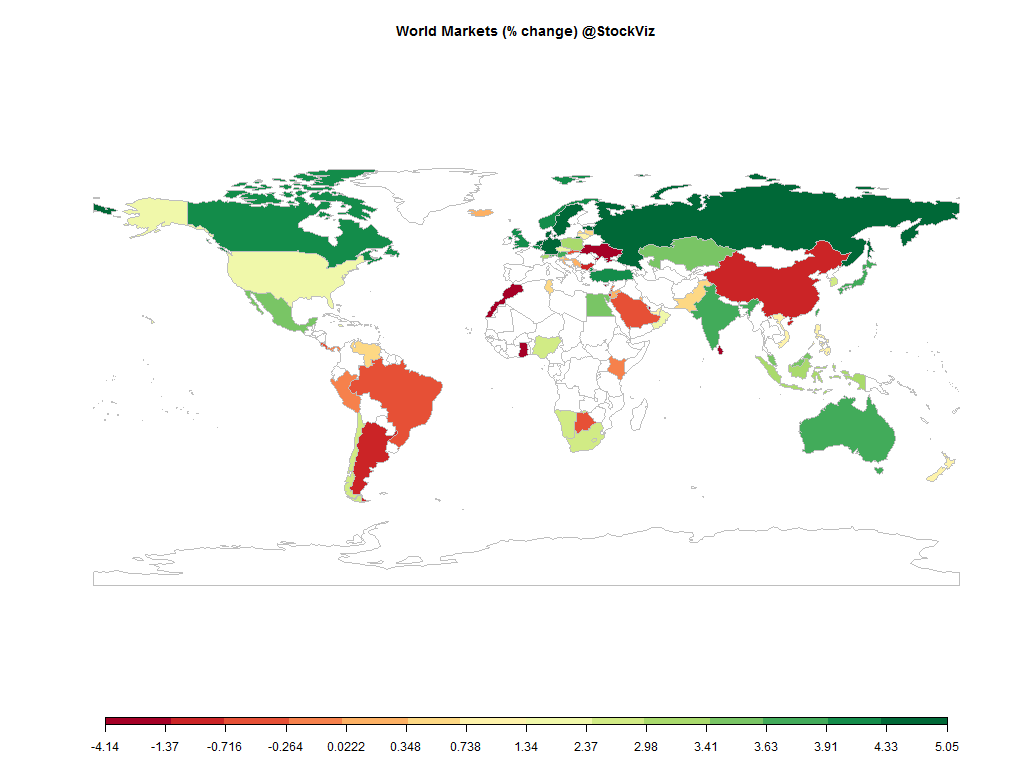
world.2015-01-16.2015-01-23

Equities

Major
DAX(DEU) +4.74%
CAC(FRA) +5.96%
UKX(GBR) +4.31%
NKY(JPN) +3.84%
SPX(USA) +2.19%
MINTs
JCI(IDN) +3.41%
INMEX(MEX) +3.45%
NGSEINDX(NGA) +2.68%
XU030(TUR) +3.92%
BRICS
IBOV(BRA) -0.62%
SHCOMP(CHN) -0.73%
NIFTY(IND) +3.78%
INDEXCF(RUS) +5.05%
TOP40(ZAF) +2.81%

Commodities

Energy
Ethanol +7.34%
RBOB Gasoline +0.77%
Brent Crude Oil -1.73%
WTI Crude Oil -5.25%
Natural Gas -4.87%
Heating Oil -1.34%
Metals
Gold 100oz +1.57%
Platinum -0.02%
Copper -3.79%
Palladium +2.81%
Silver 5000oz +3.95%

Currencies

USDEUR:+3.13% USDJPY:+0.27%

MINTs
USDIDR(IDN) -1.04%
USDMXN(MEX) +0.28%
USDNGN(NGA) +3.07%
USDTRY(TUR) +0.75%
BRICS
USDBRL(BRA) -1.46%
USDCNY(CHN) +0.34%
USDINR(IND) -0.71%
USDRUB(RUS) -1.89%
USDZAR(ZAF) -1.42%
Agricultural
Lean Hogs -6.85%
Orange Juice +0.44%
Sugar #11 -0.78%
Wheat -1.12%
White Sugar -1.18%
Cattle -2.87%
Corn +0.19%
Cotton -3.43%
Lumber -0.03%
Coffee (Arabica) -5.09%
Feeder Cattle -0.29%
Soybean Meal +1.41%
Cocoa -4.63%
Coffee (Robusta) -2.63%
Soybeans -1.82%

Credit Indices

Index Change
Markit CDX EM -0.18%
Markit CDX NA HY +0.60%
Markit CDX NA IG -2.83%
Markit iTraxx Asia ex-Japan IG -3.93%
Markit iTraxx Australia -1.34%
Markit iTraxx Europe -3.79%
Markit iTraxx Europe Crossover -22.27%
Markit iTraxx Japan -1.84%
Markit iTraxx SovX Western Europe -1.29%
Markit LCDX (Loan CDS) +0.08%
Markit MCDX (Municipal CDS) +0.30%
Markets rallied and the Euro tumbled on ECB’s 60bn QE program.

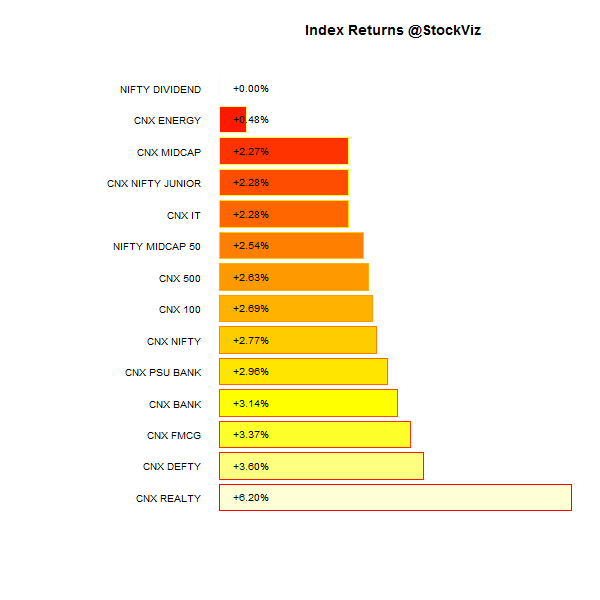
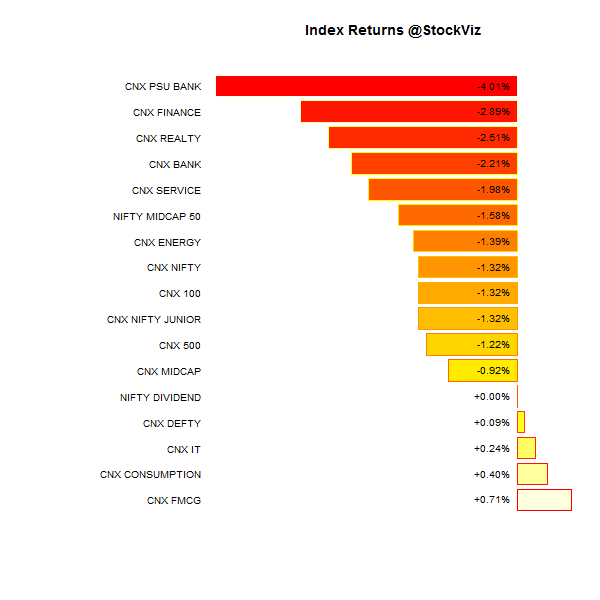
Index Returns
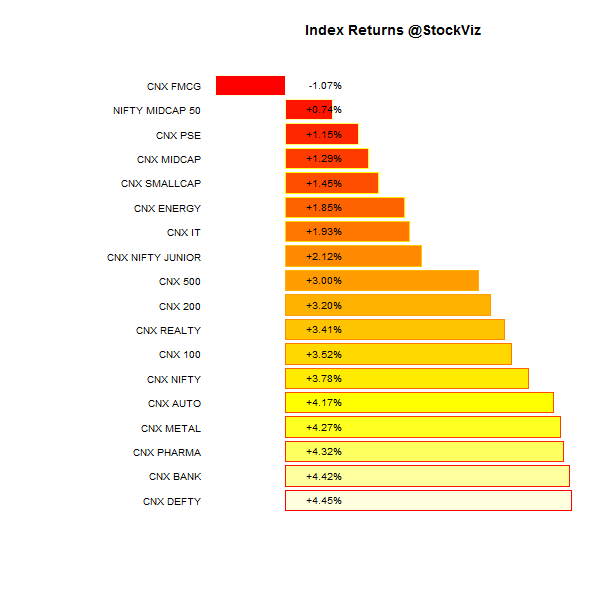
index performance.2015-01-16.2015-01-23

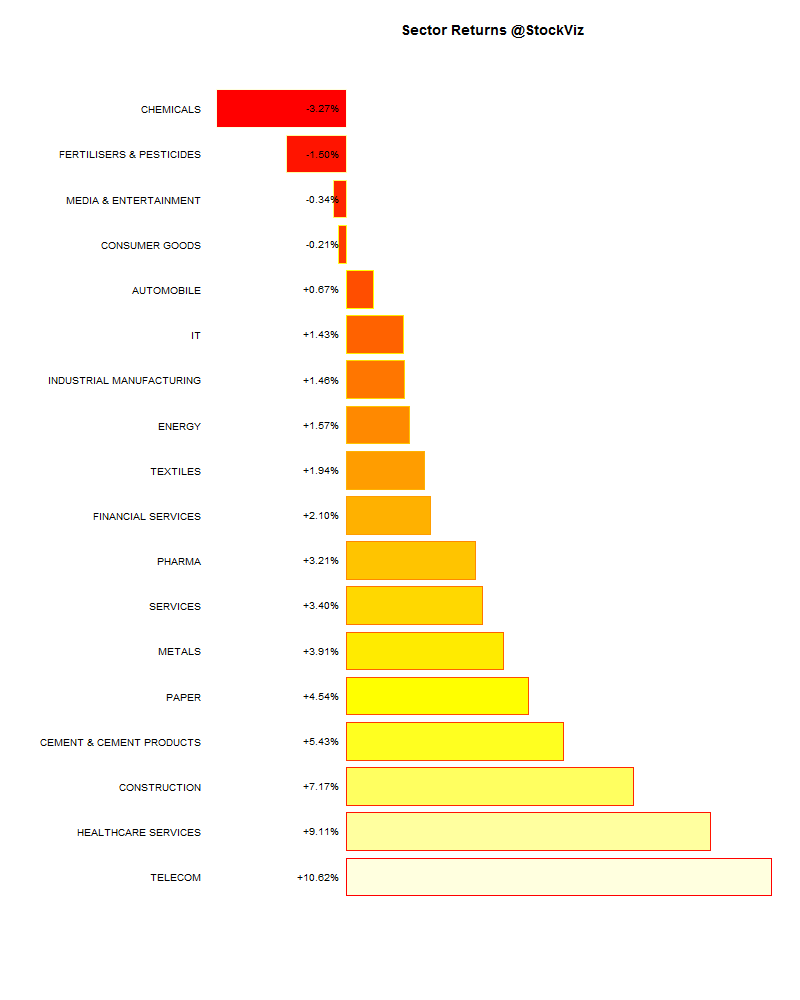
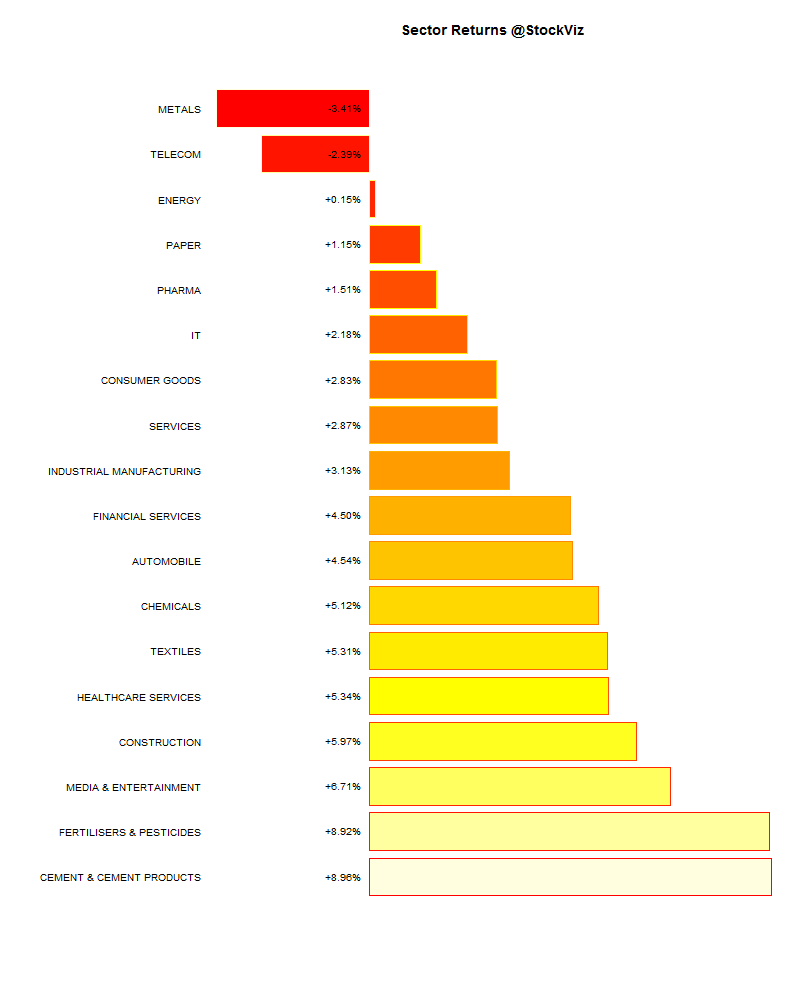
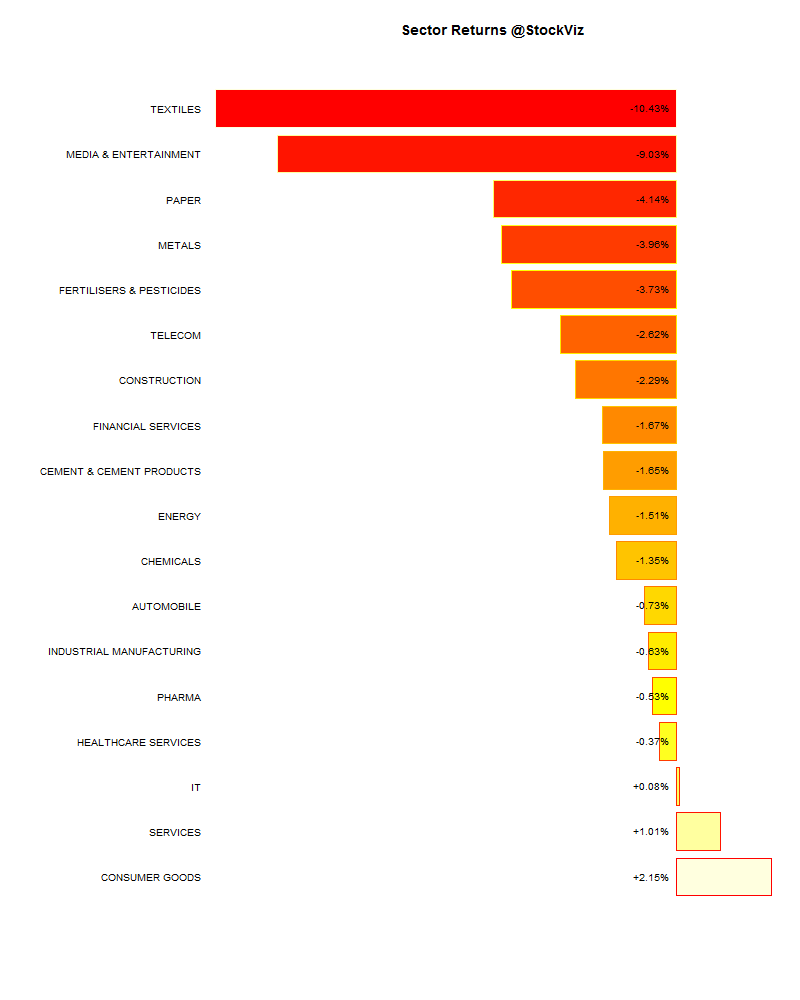
Sector Performance

sector performance.2015-01-16.2015-01-23

Advance Decline

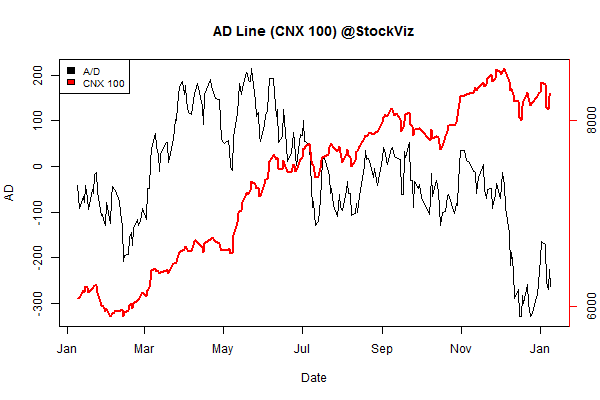
advance.decline.line2.2015-01-16.2015-01-23

Market Cap Decile Performance

Decile Mkt. Cap. Adv/Decl
1 (micro) -0.90% 68/68
2 +0.87% 71/63
3 +2.38% 74/61
4 +0.11% 75/61
5 +1.42% 70/65
6 +1.20% 71/64
7 +3.52% 74/62
8 +1.50% 72/63
9 +2.00% 73/62
10 (mega) +2.91% 62/74
A broad-based rally driven by Eurozone EQ, falling oil, rate cuts, budget… Oh my!

Top Winners and Losers

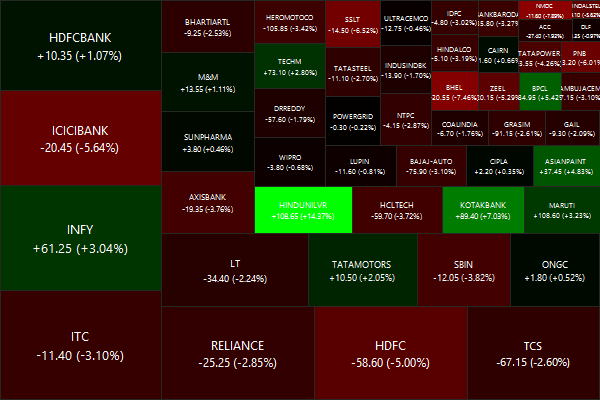
TATAMOTORS +11.93%
BHARTIARTL +12.03%
ADANIENT +12.70%
M&MFIN -18.22%
SRTRANSFIN -5.98%
PETRONET -4.61%
The Adani stable was on fire this week…

ETF Performance

INFRABEES +6.67%
BANKBEES +4.46%
NIFTYBEES +3.59%
GOLDBEES +1.78%
JUNIORBEES +1.77%
CPSEETF +0.64%
PSUBNKBEES +0.27%
No asset left behind…

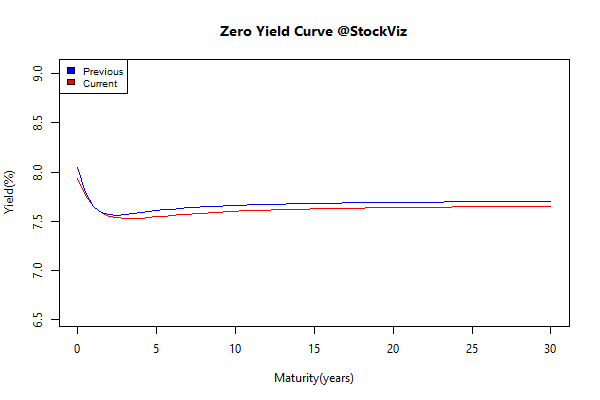
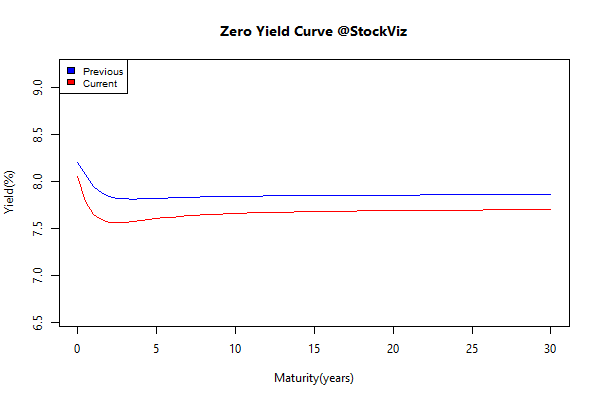
Yield Curve

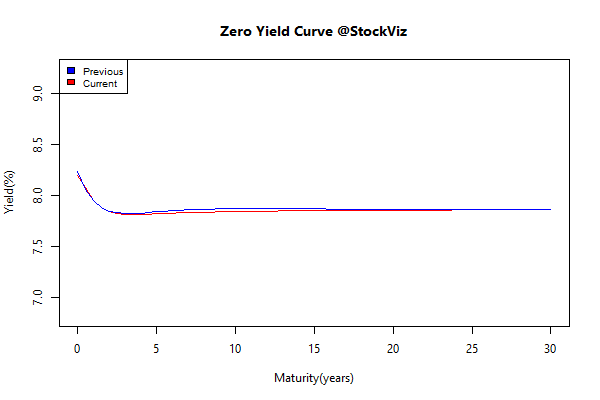
yield Curve.2015-01-16.2015-01-23

Bond Indices

Sub Index Change in YTM Total Return(%)
GSEC TB -0.11 +0.18%
GSEC SUB 1-3 +0.06 +0.21%
GSEC SUB 3-8 +0.08 -0.05%
GSEC SUB 8 +0.04 -0.11%
Weird that the long end of the curve ended the week in the red.

Investment Theme Performance

Large-cap dominance drove CNX 100 Tactical this week. Momentum was not far behind…

Thought for the weekend

Research:

Study participants from a range of ages generally did not enjoy spending even brief periods of time alone in a room with nothing to do but think, ponder or daydream. The participants, by and large, enjoyed much more doing external activities such as listening to music or using a smartphone. Some even preferred to give themselves mild electric shocks than to think.

Source: Most people are just not comfortable in their own heads

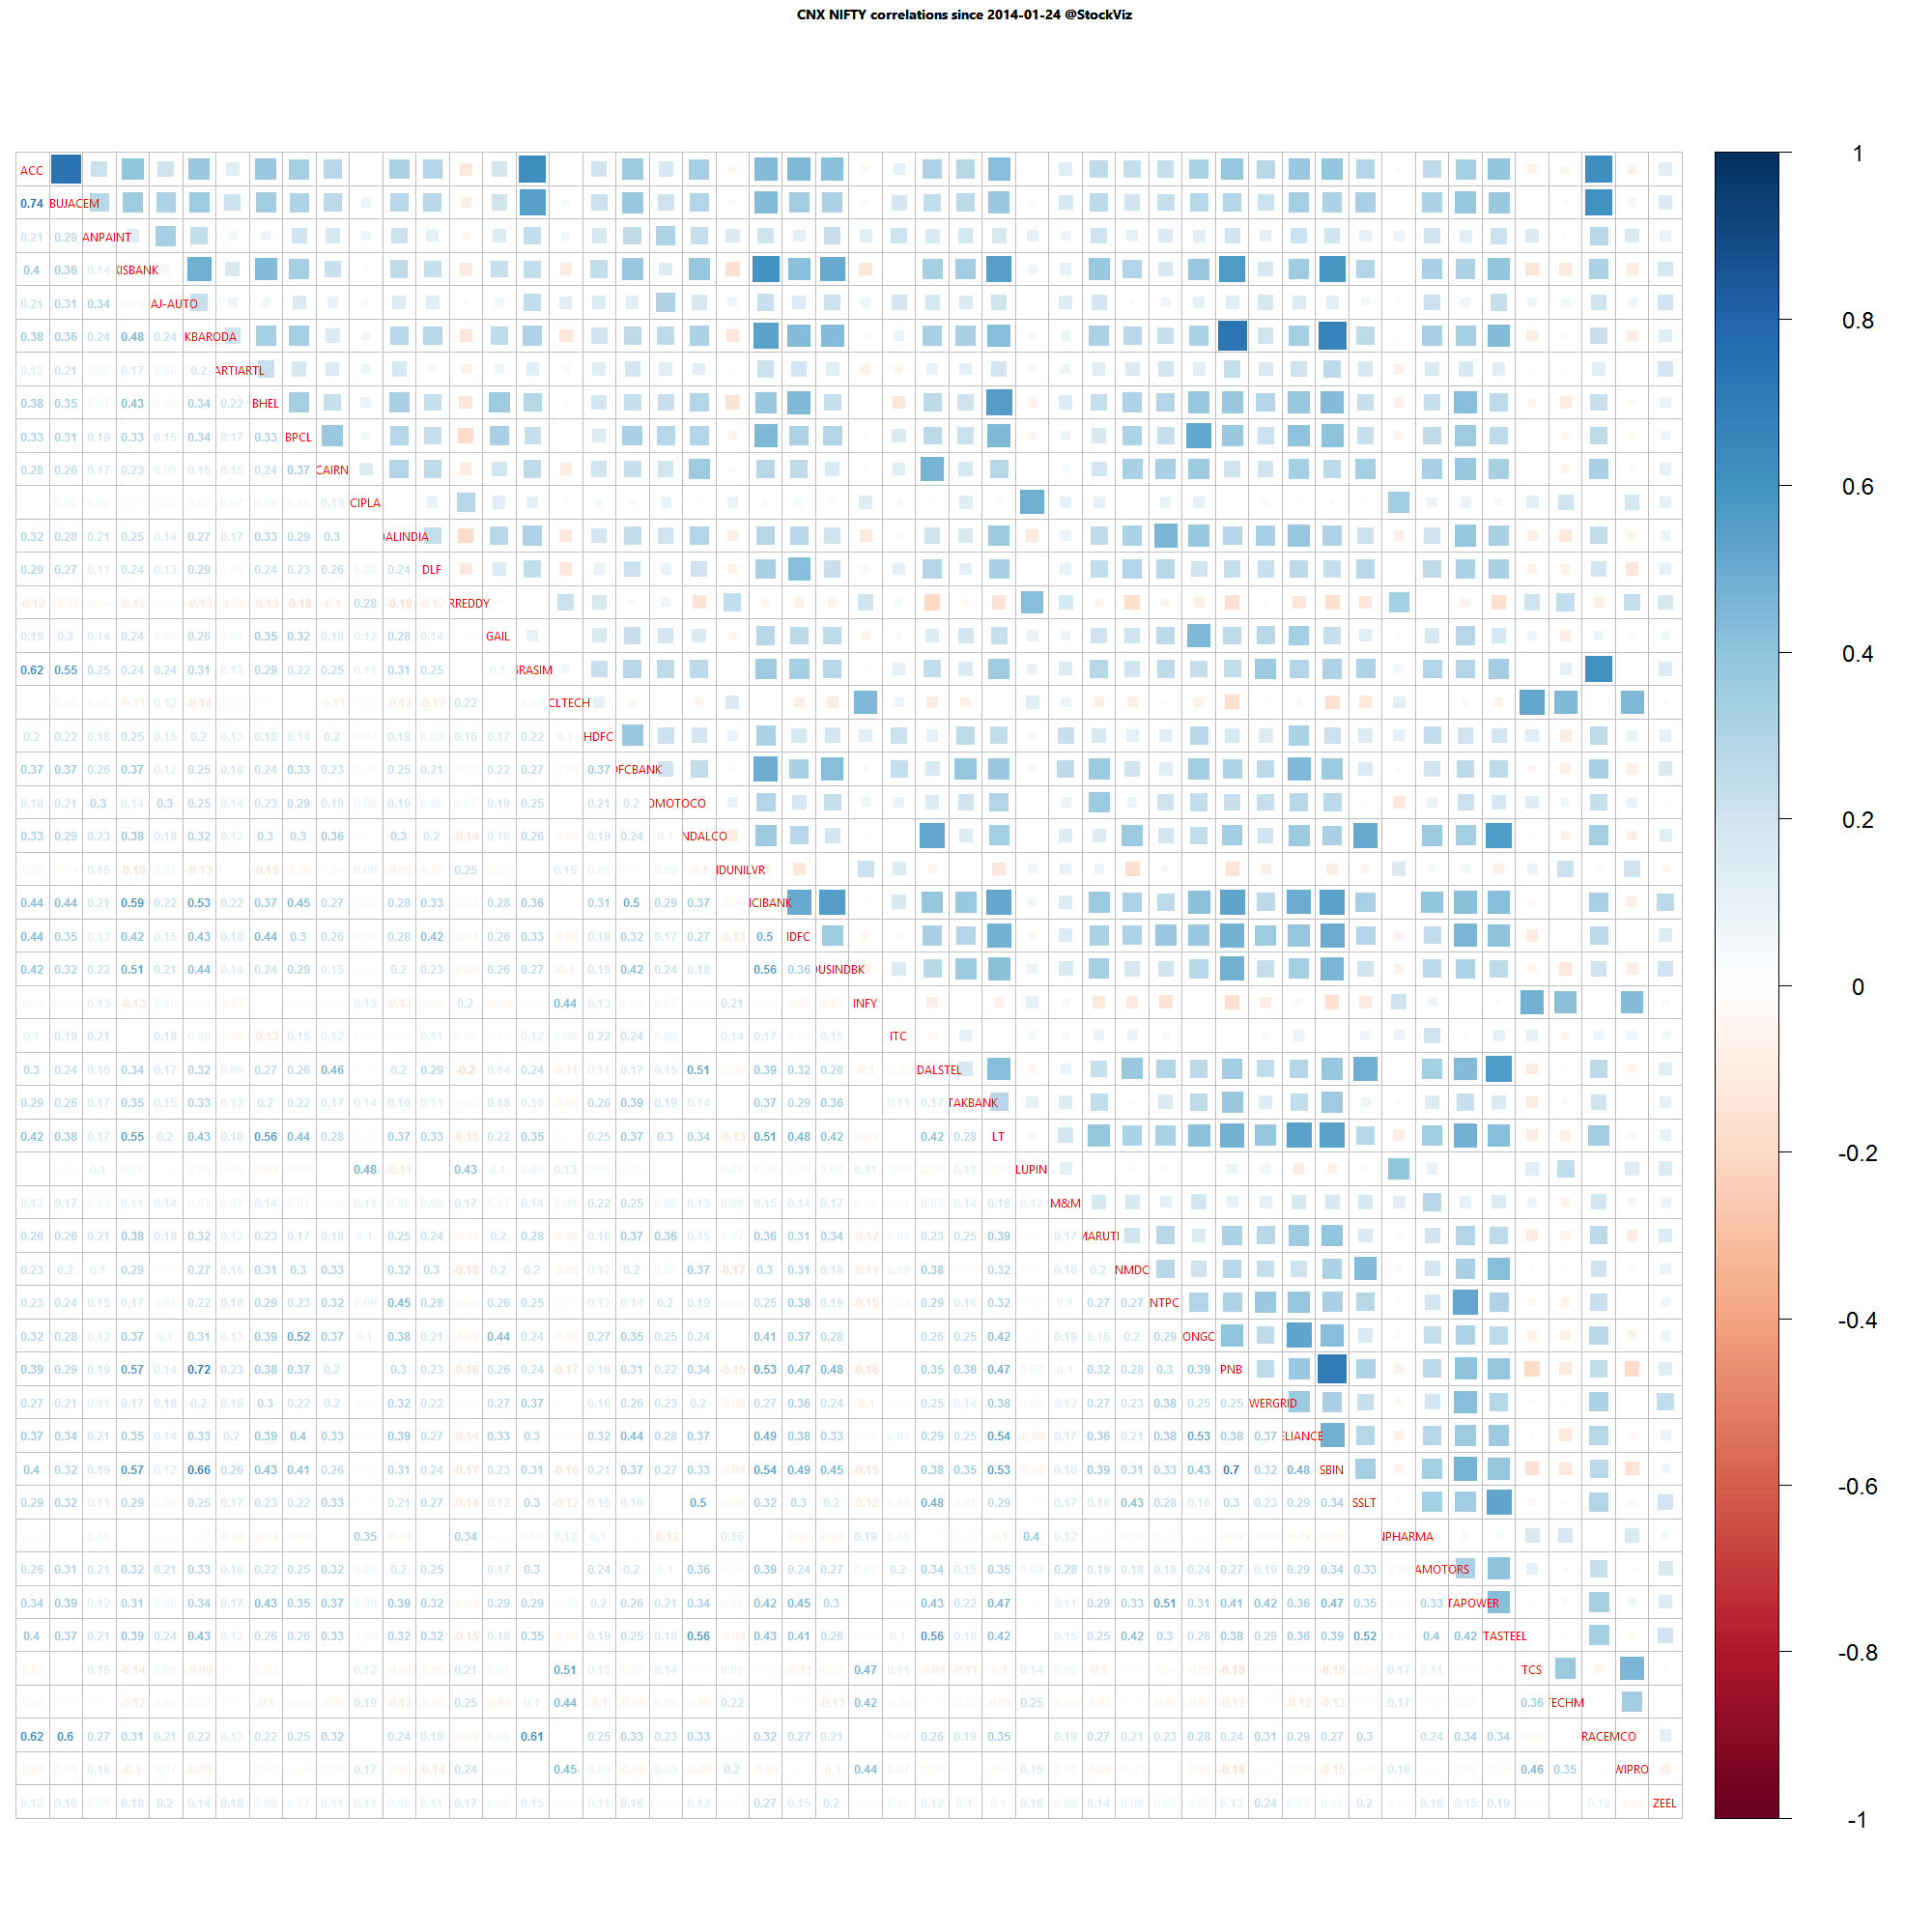
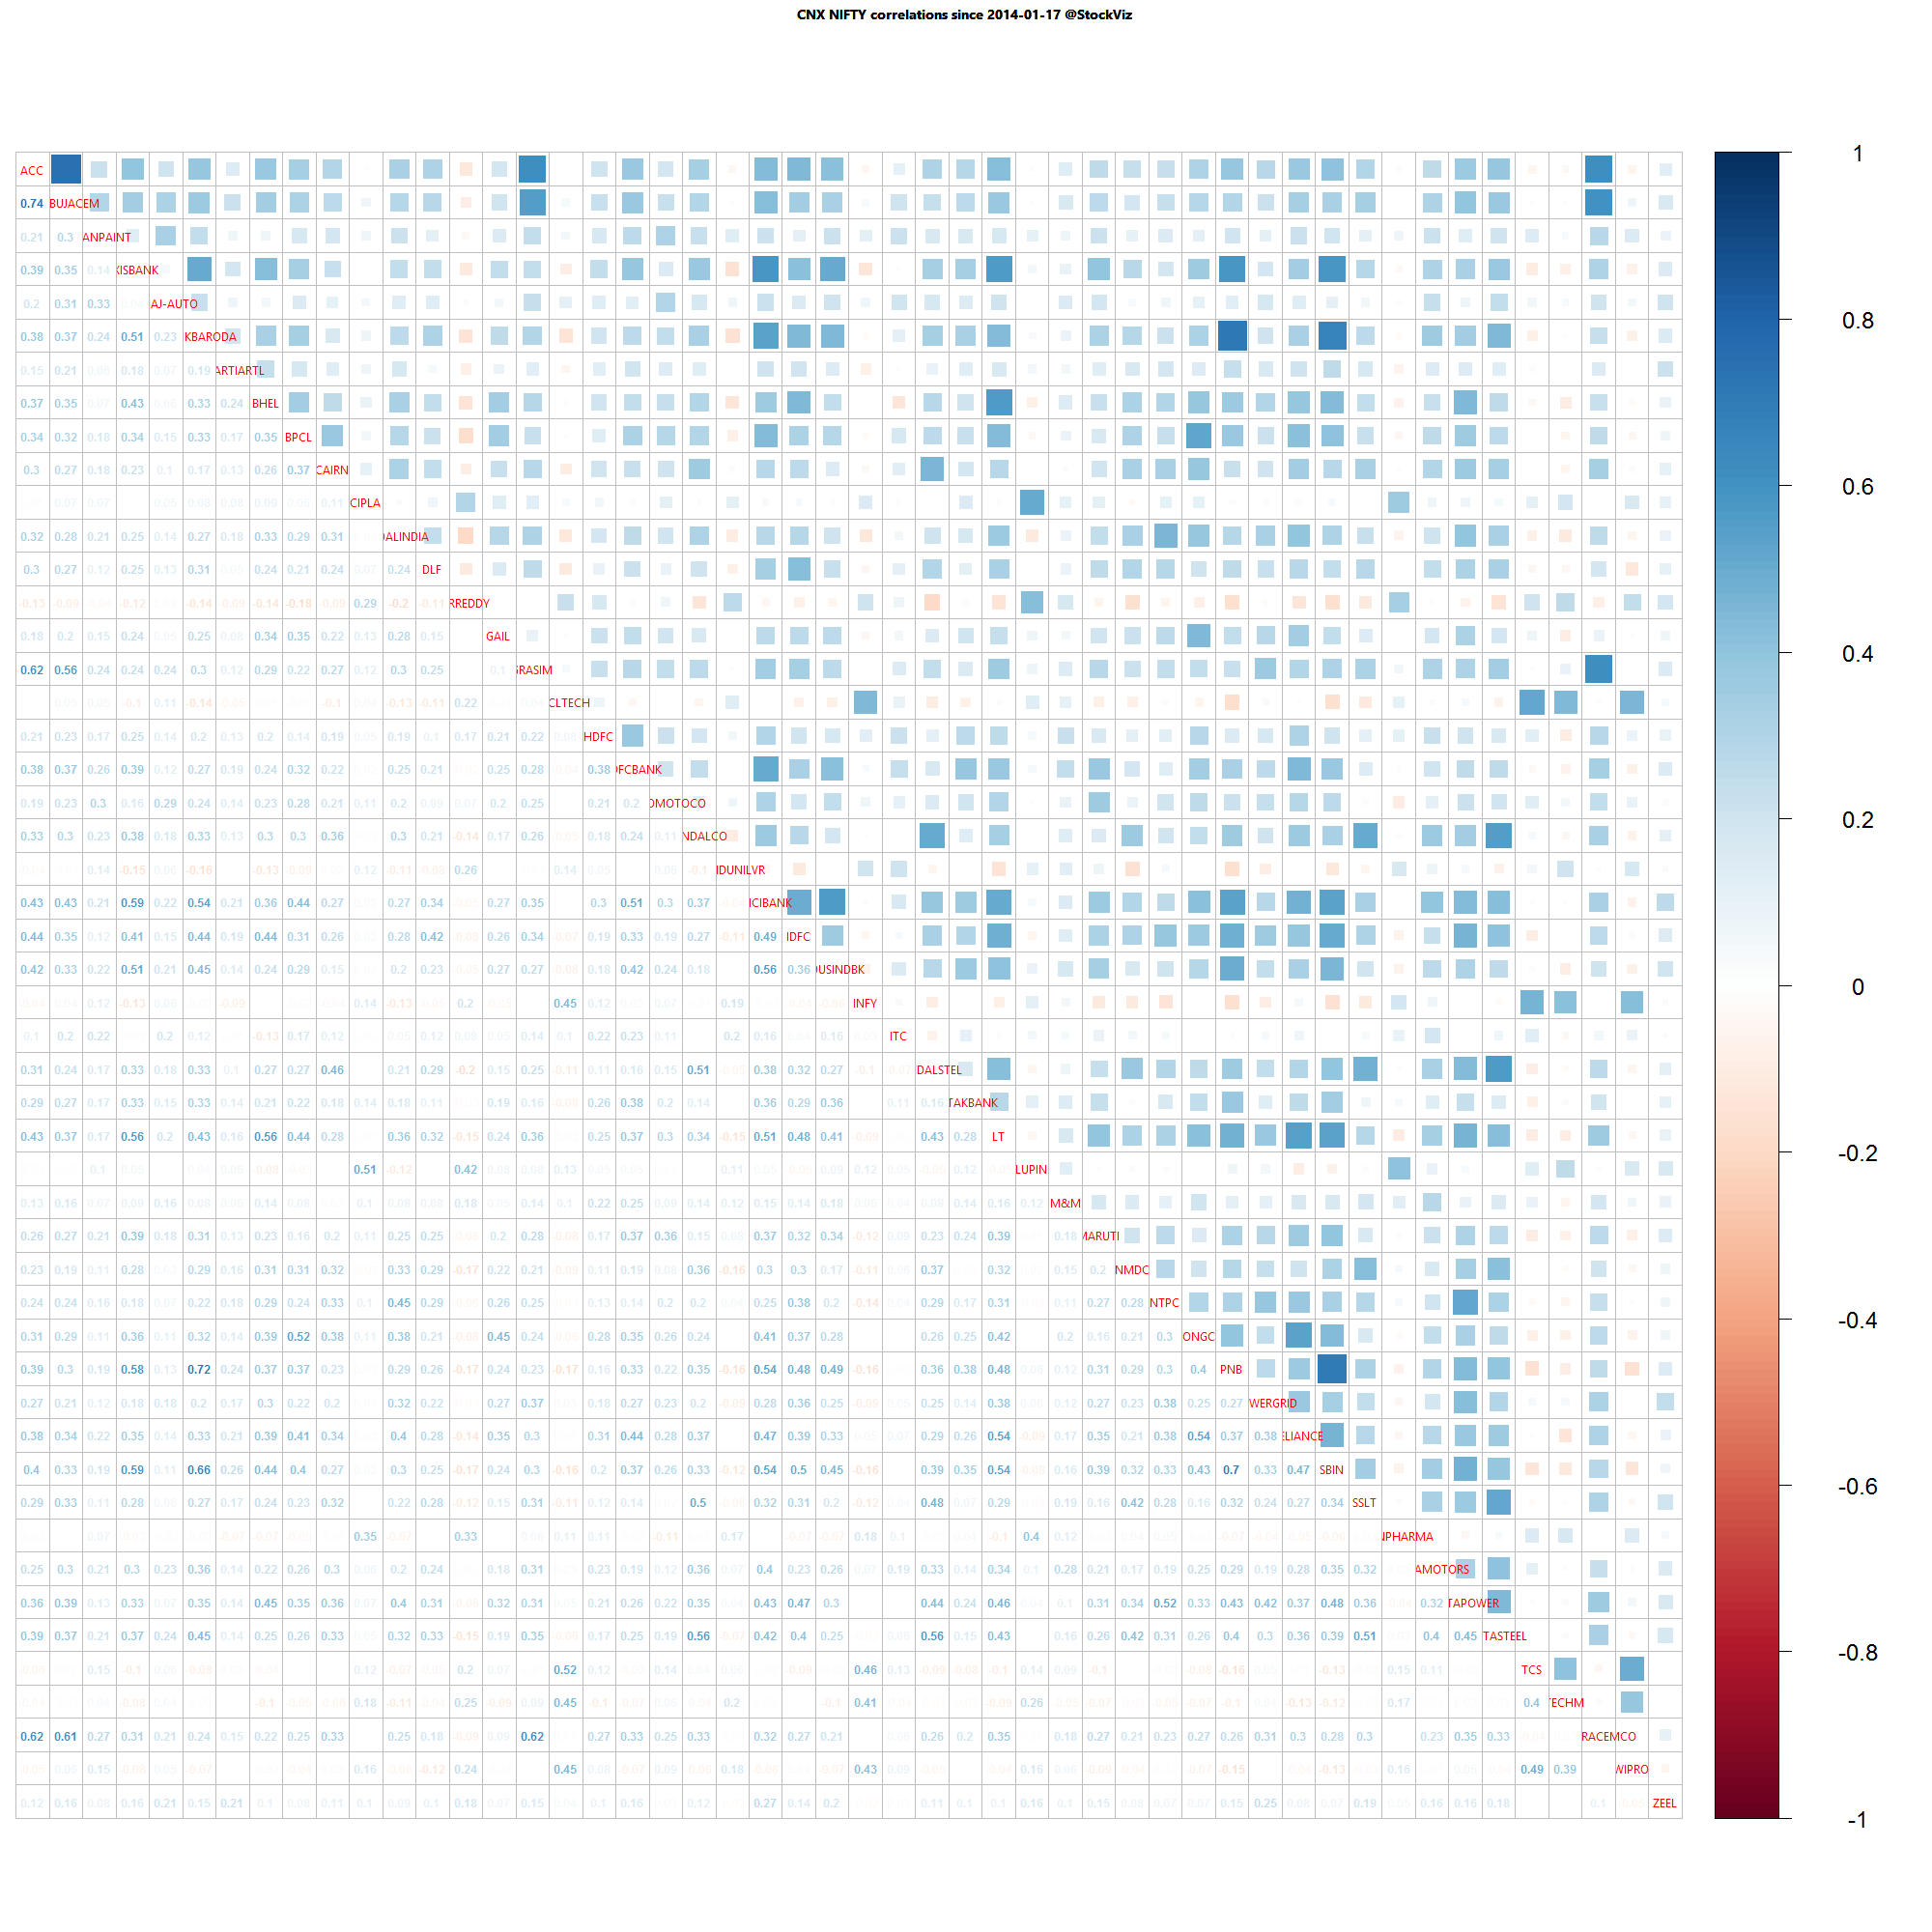
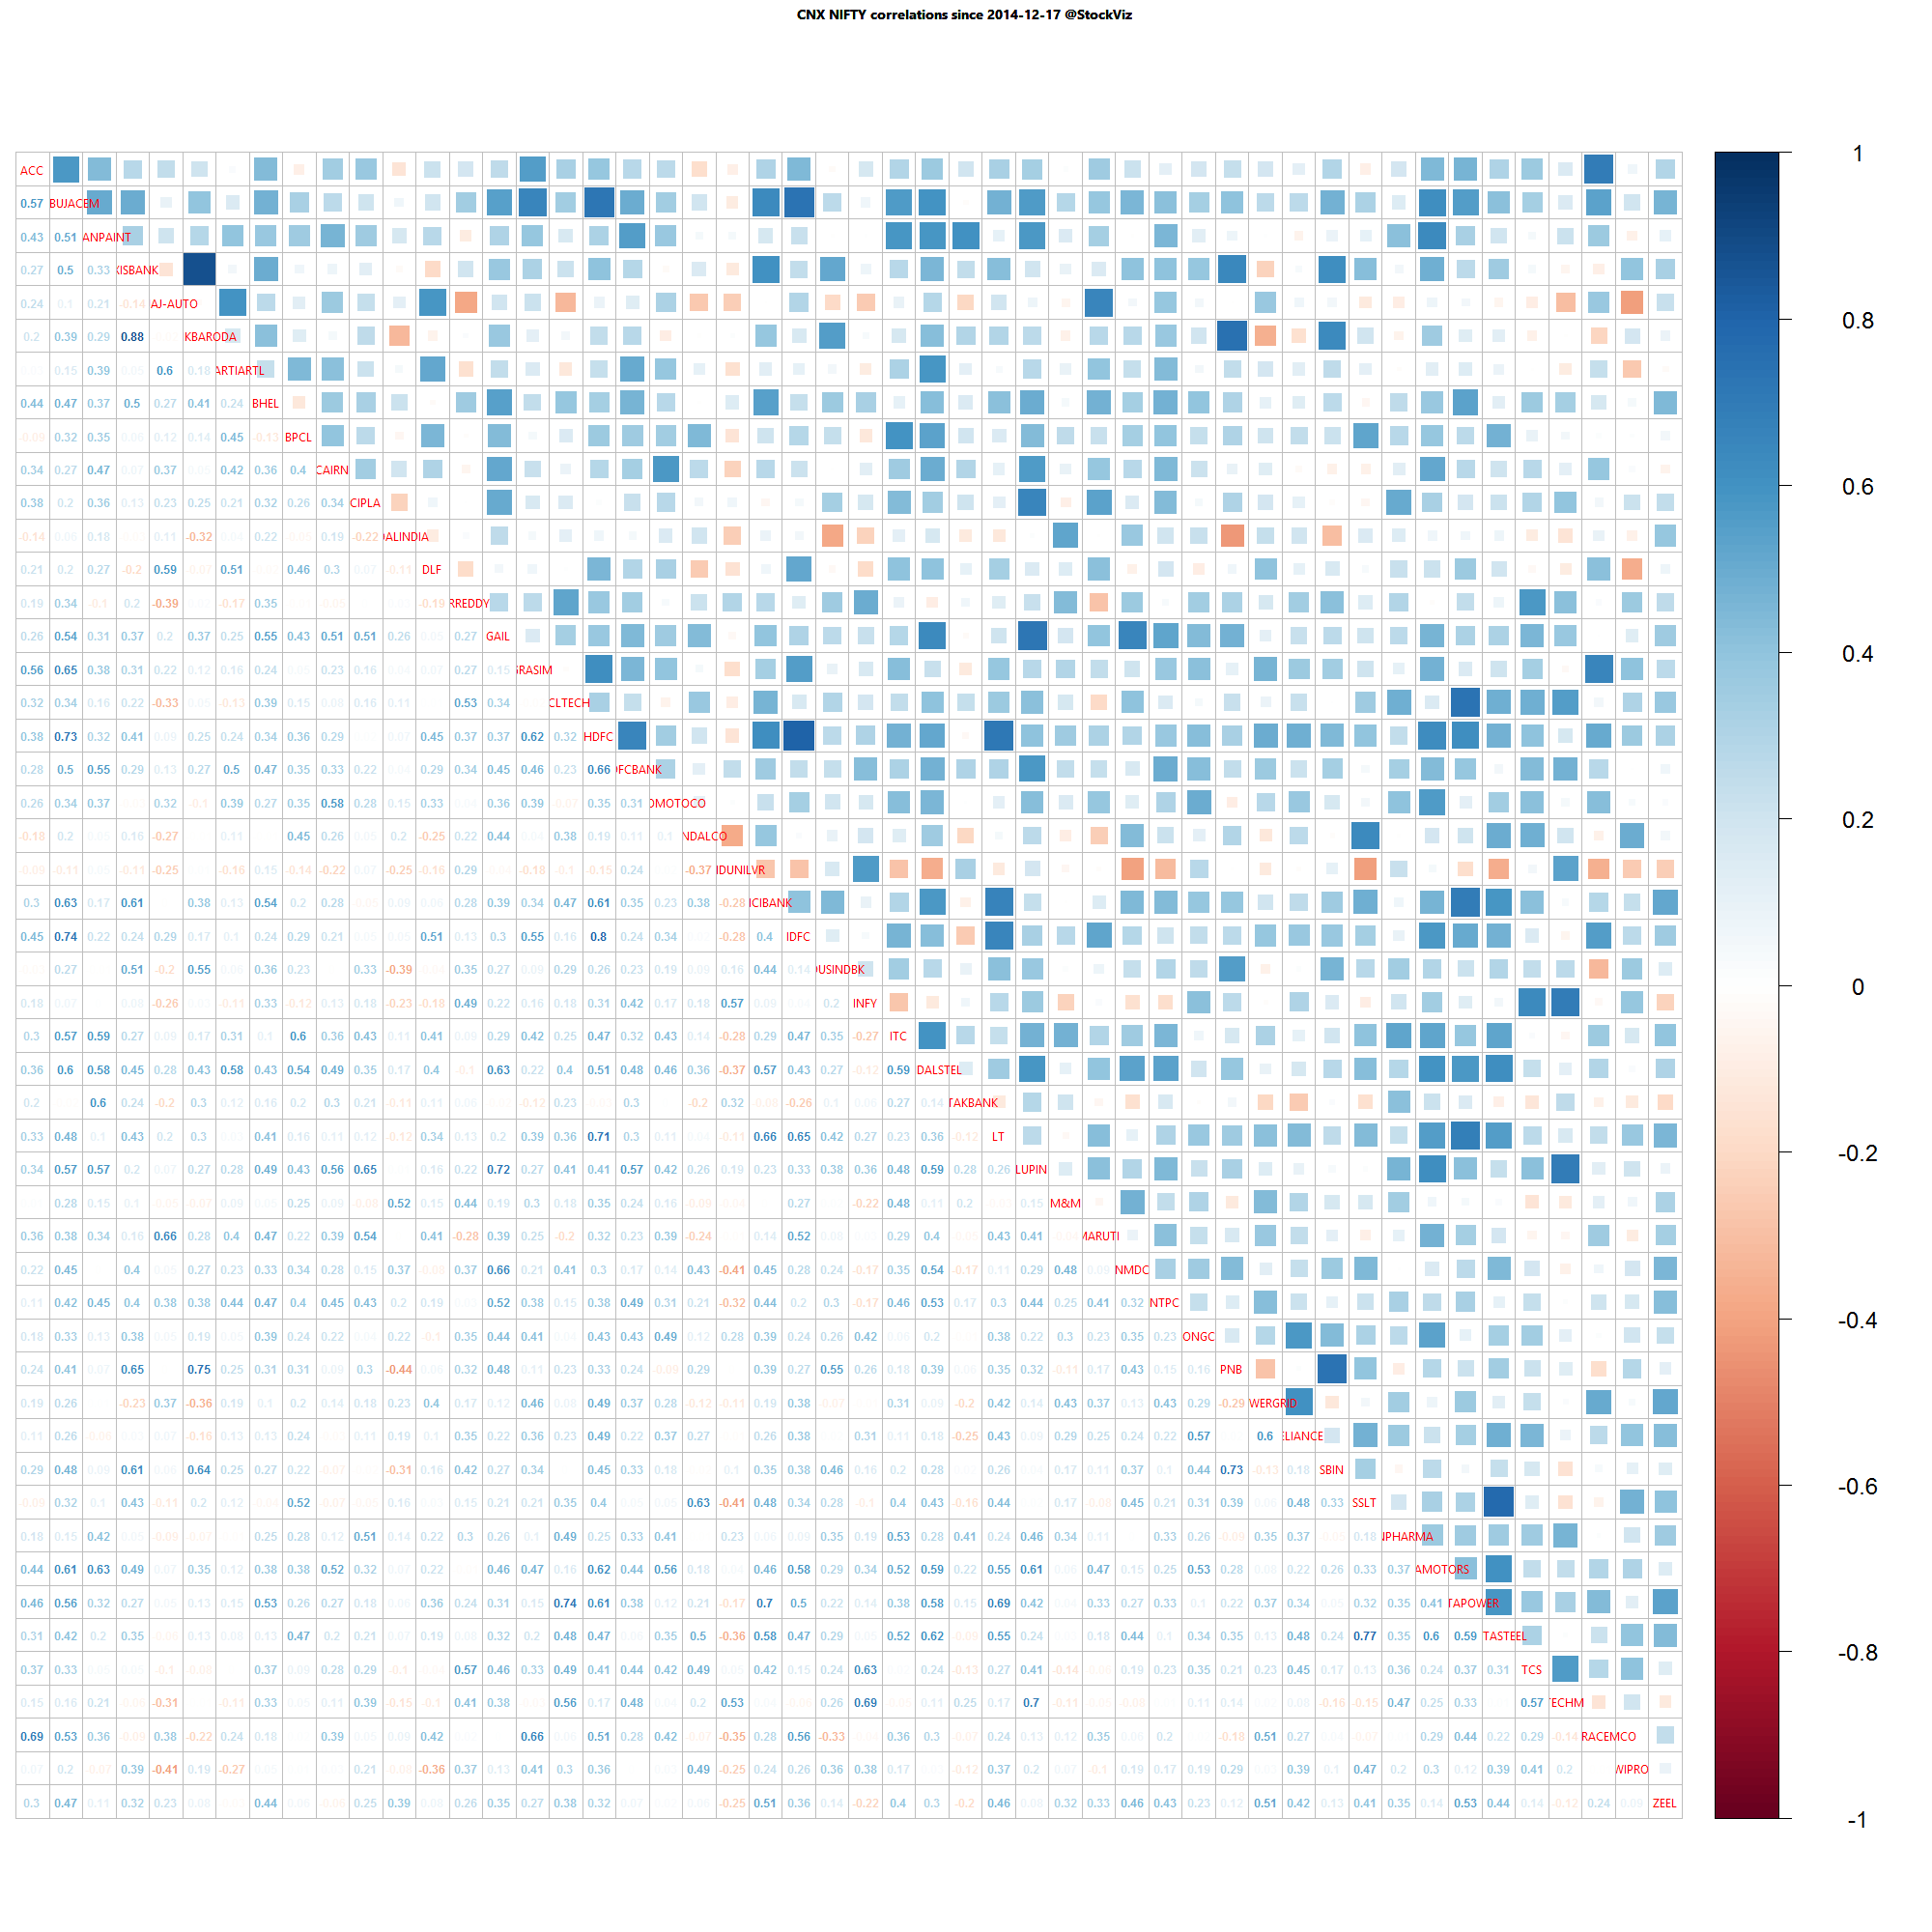
Correlation Update 24.01.2015

Nifty one year daily return correlations

Nifty one year daily return correlations

Nifty one month daily return correlations

Nifty one month daily return correlations

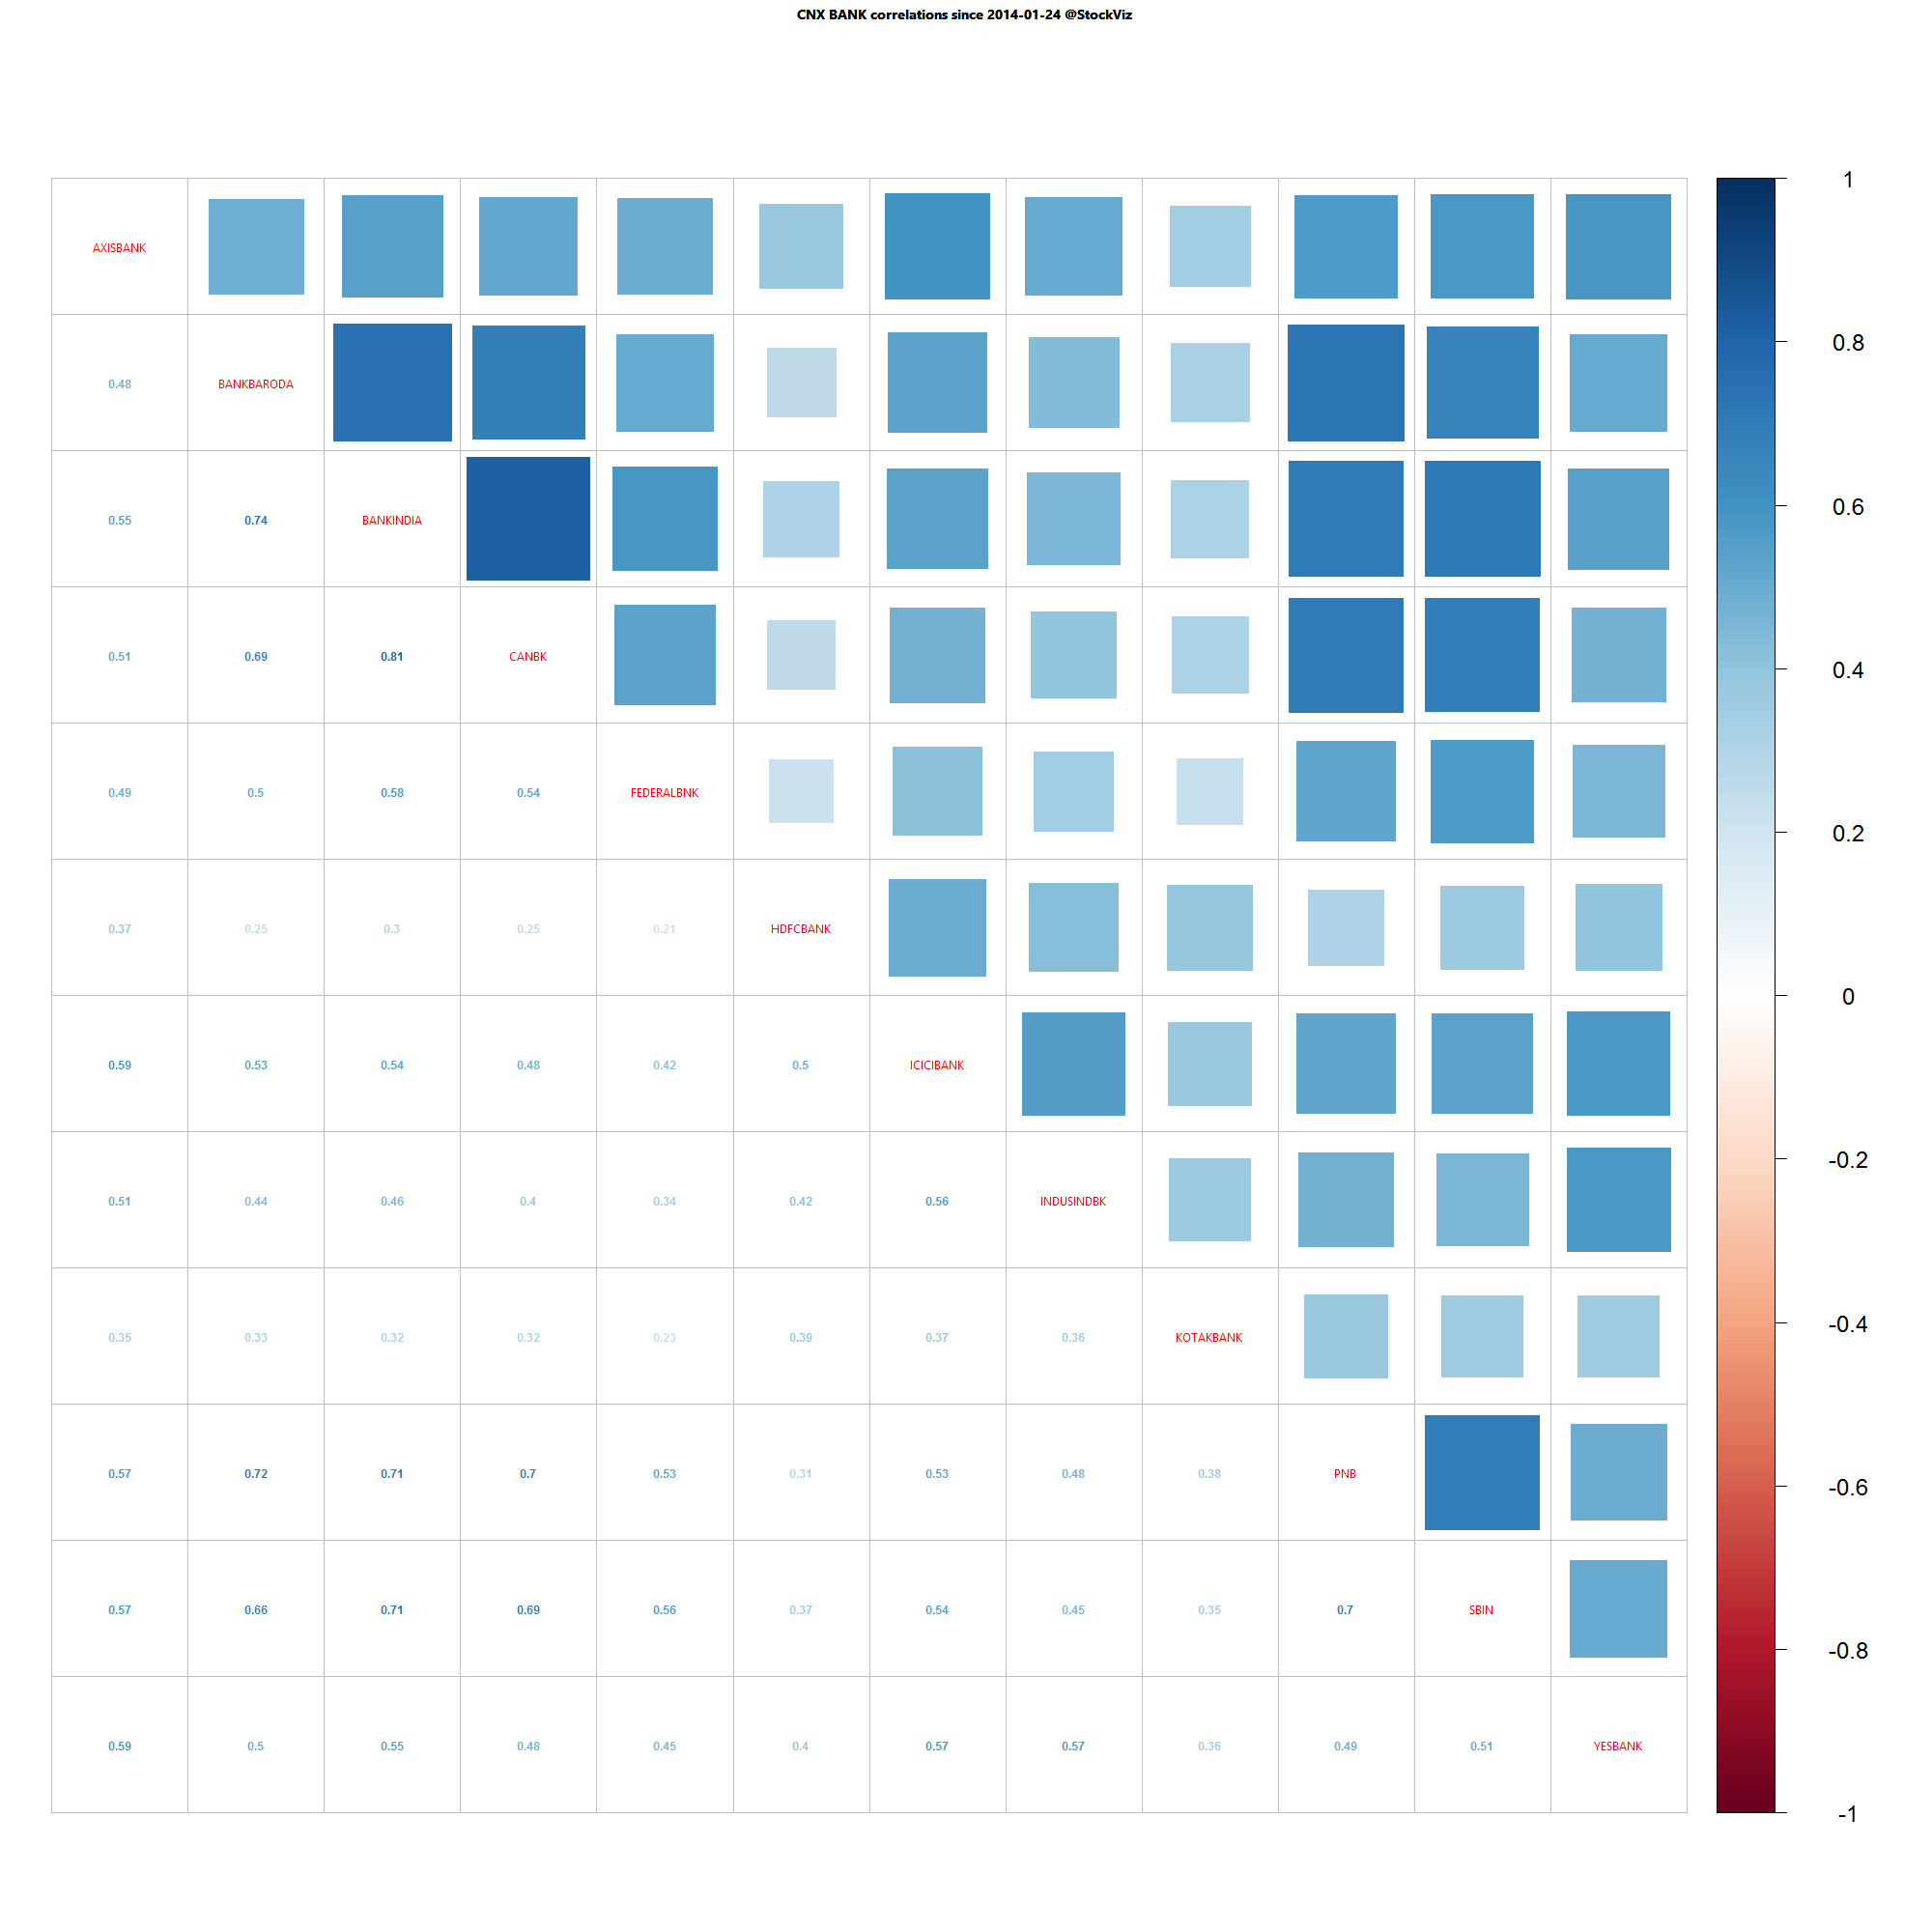
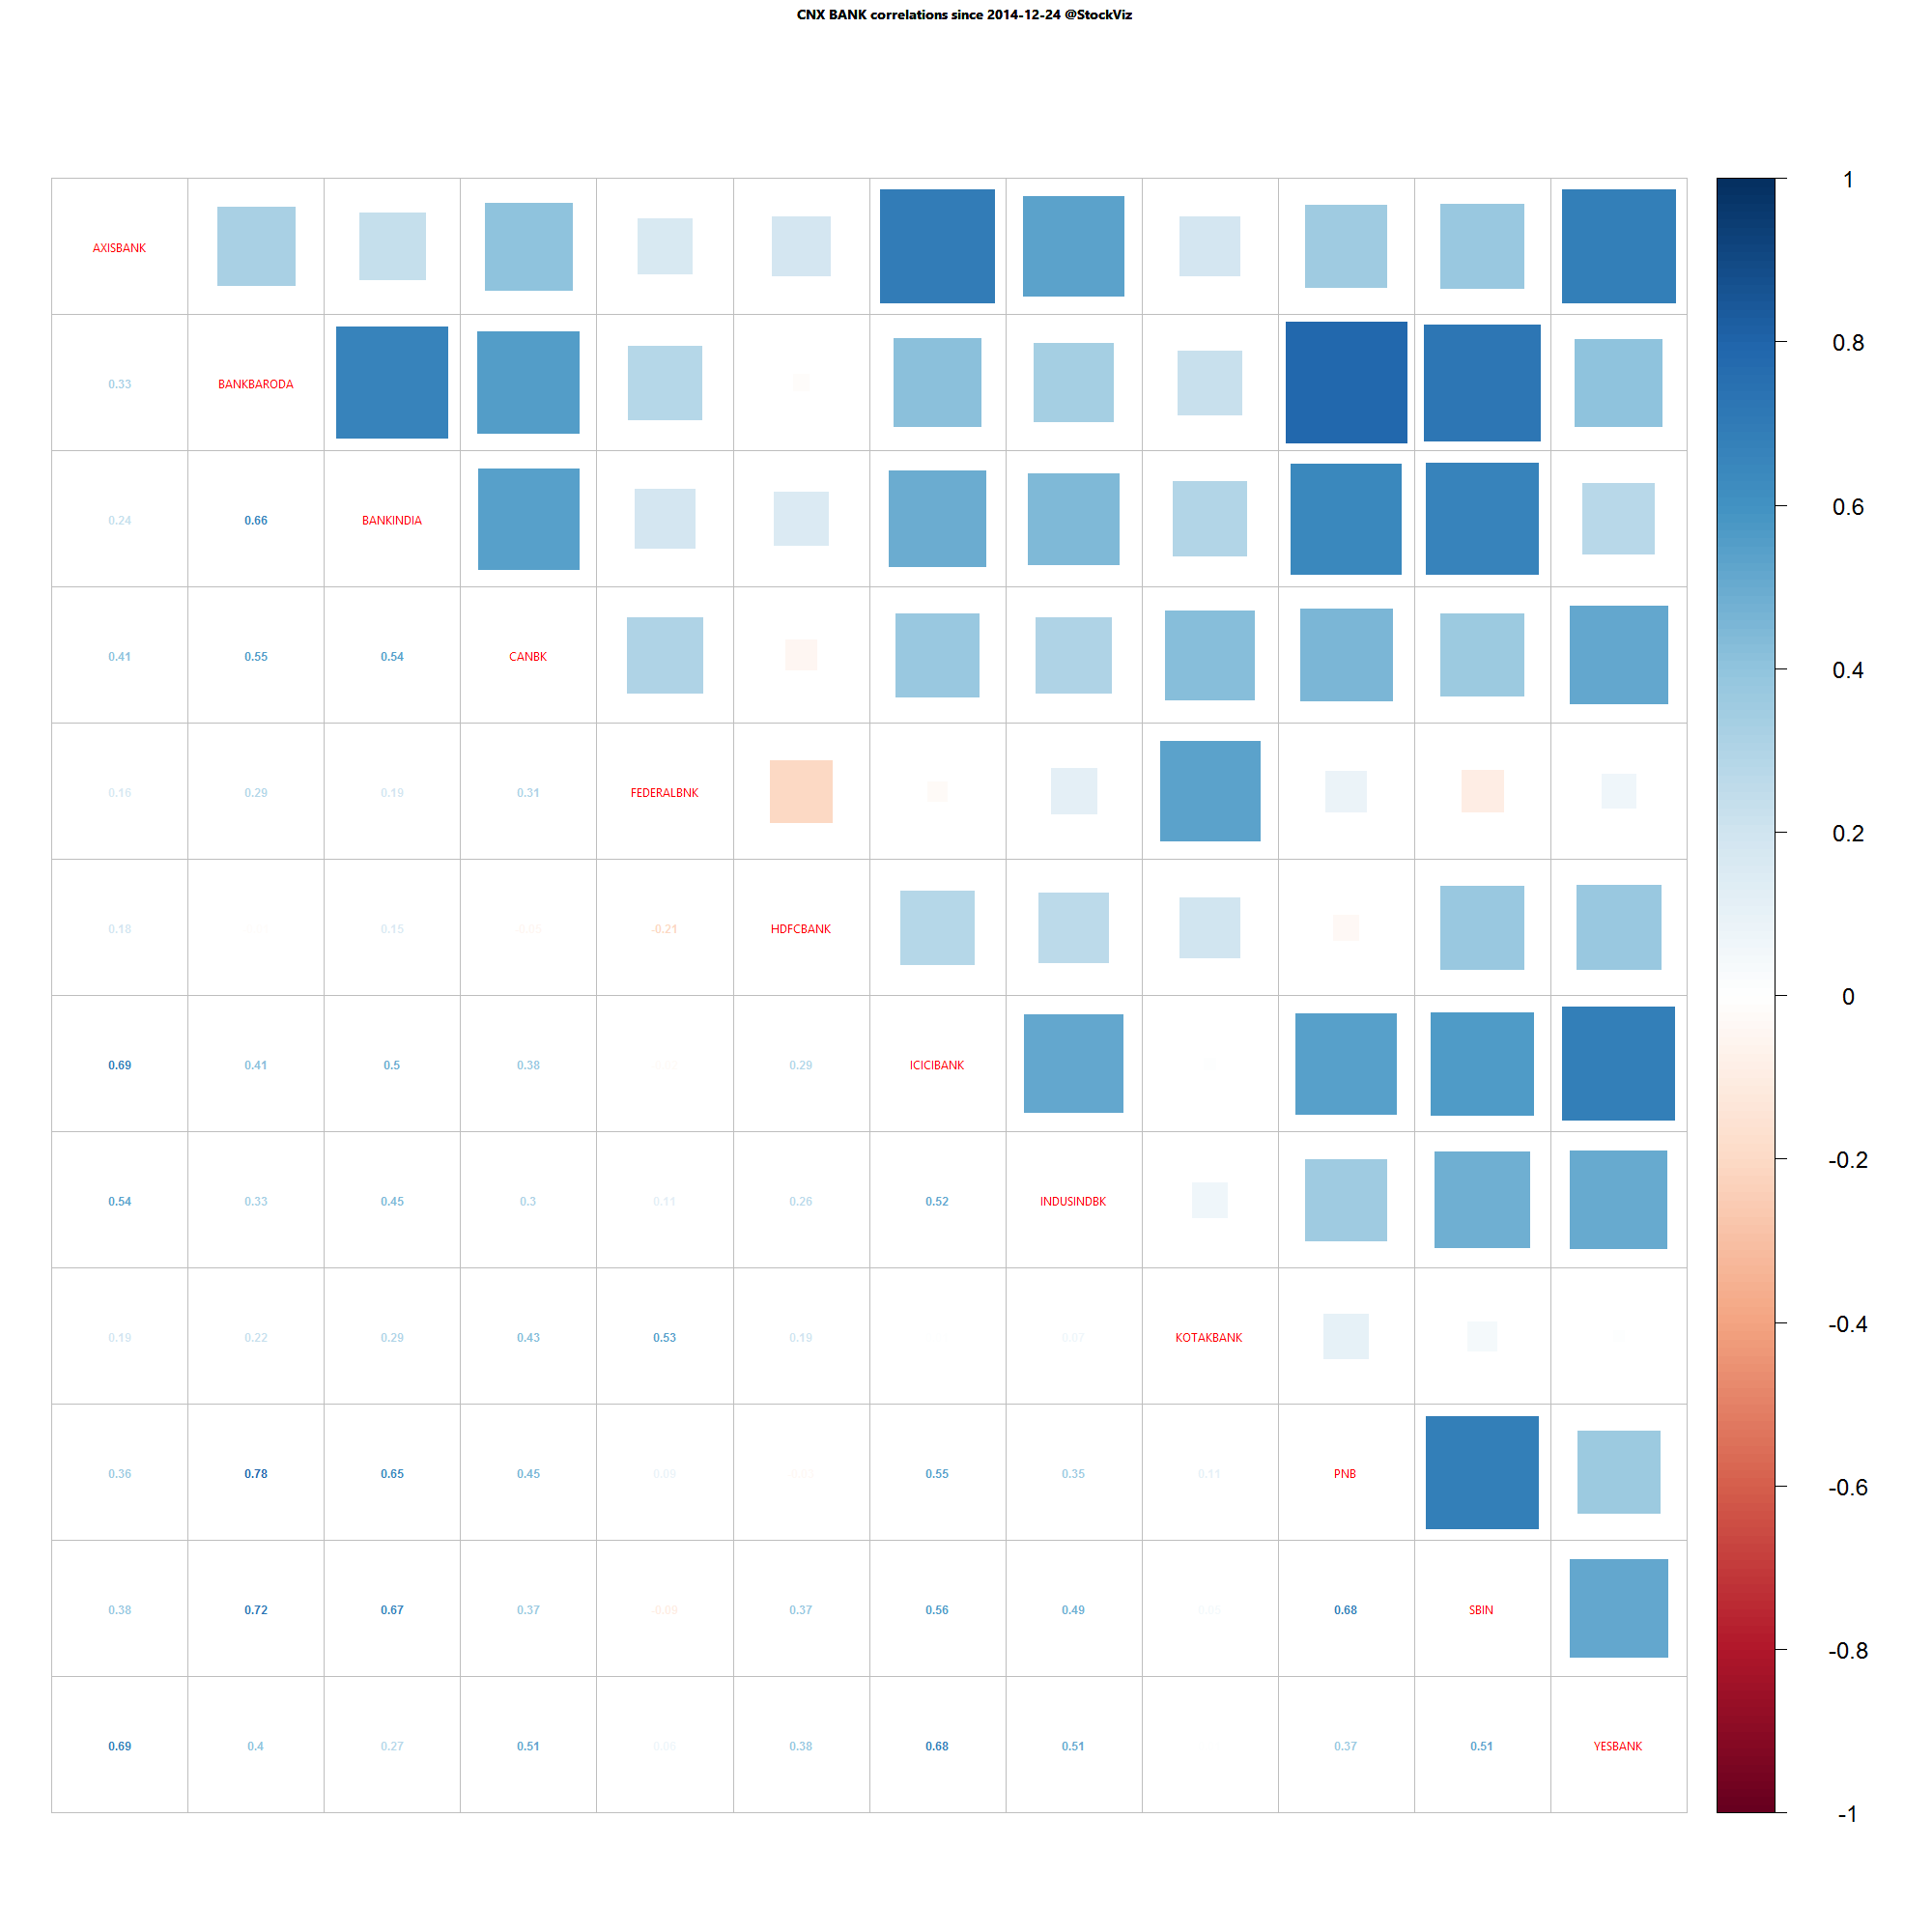
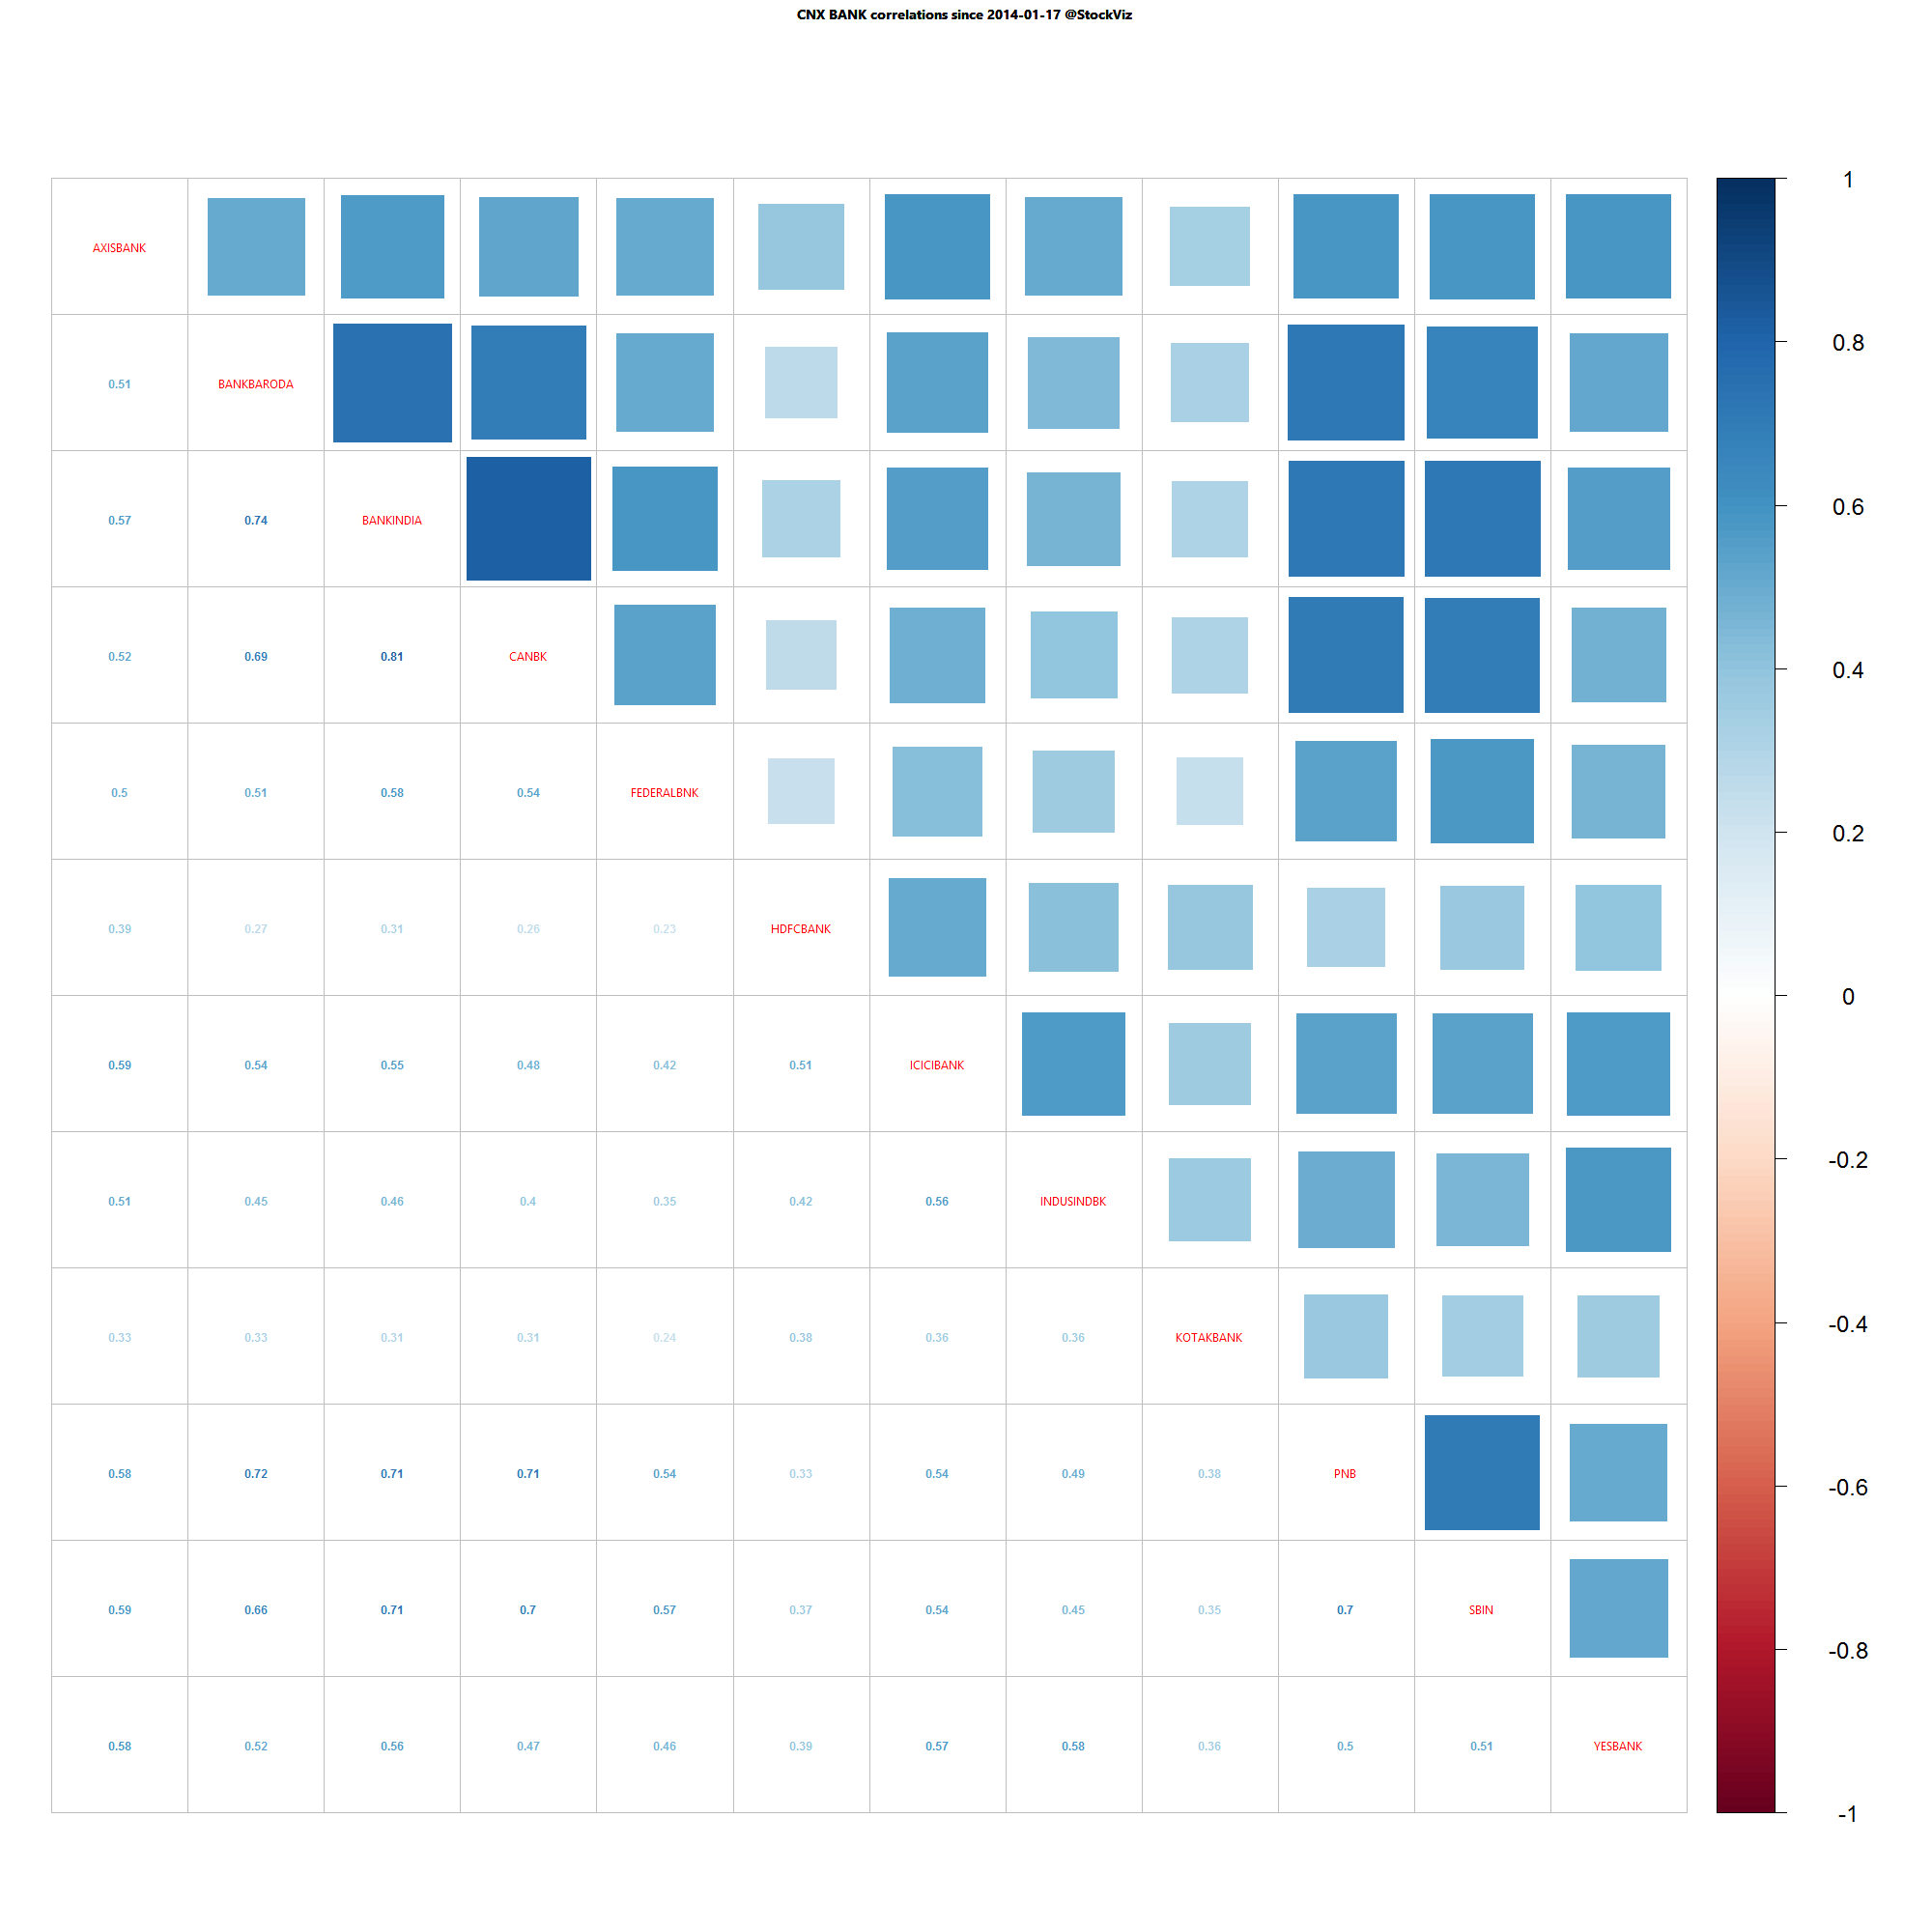
Bank Nifty one year daily return correlations

Bank Nifty one year daily return correlations

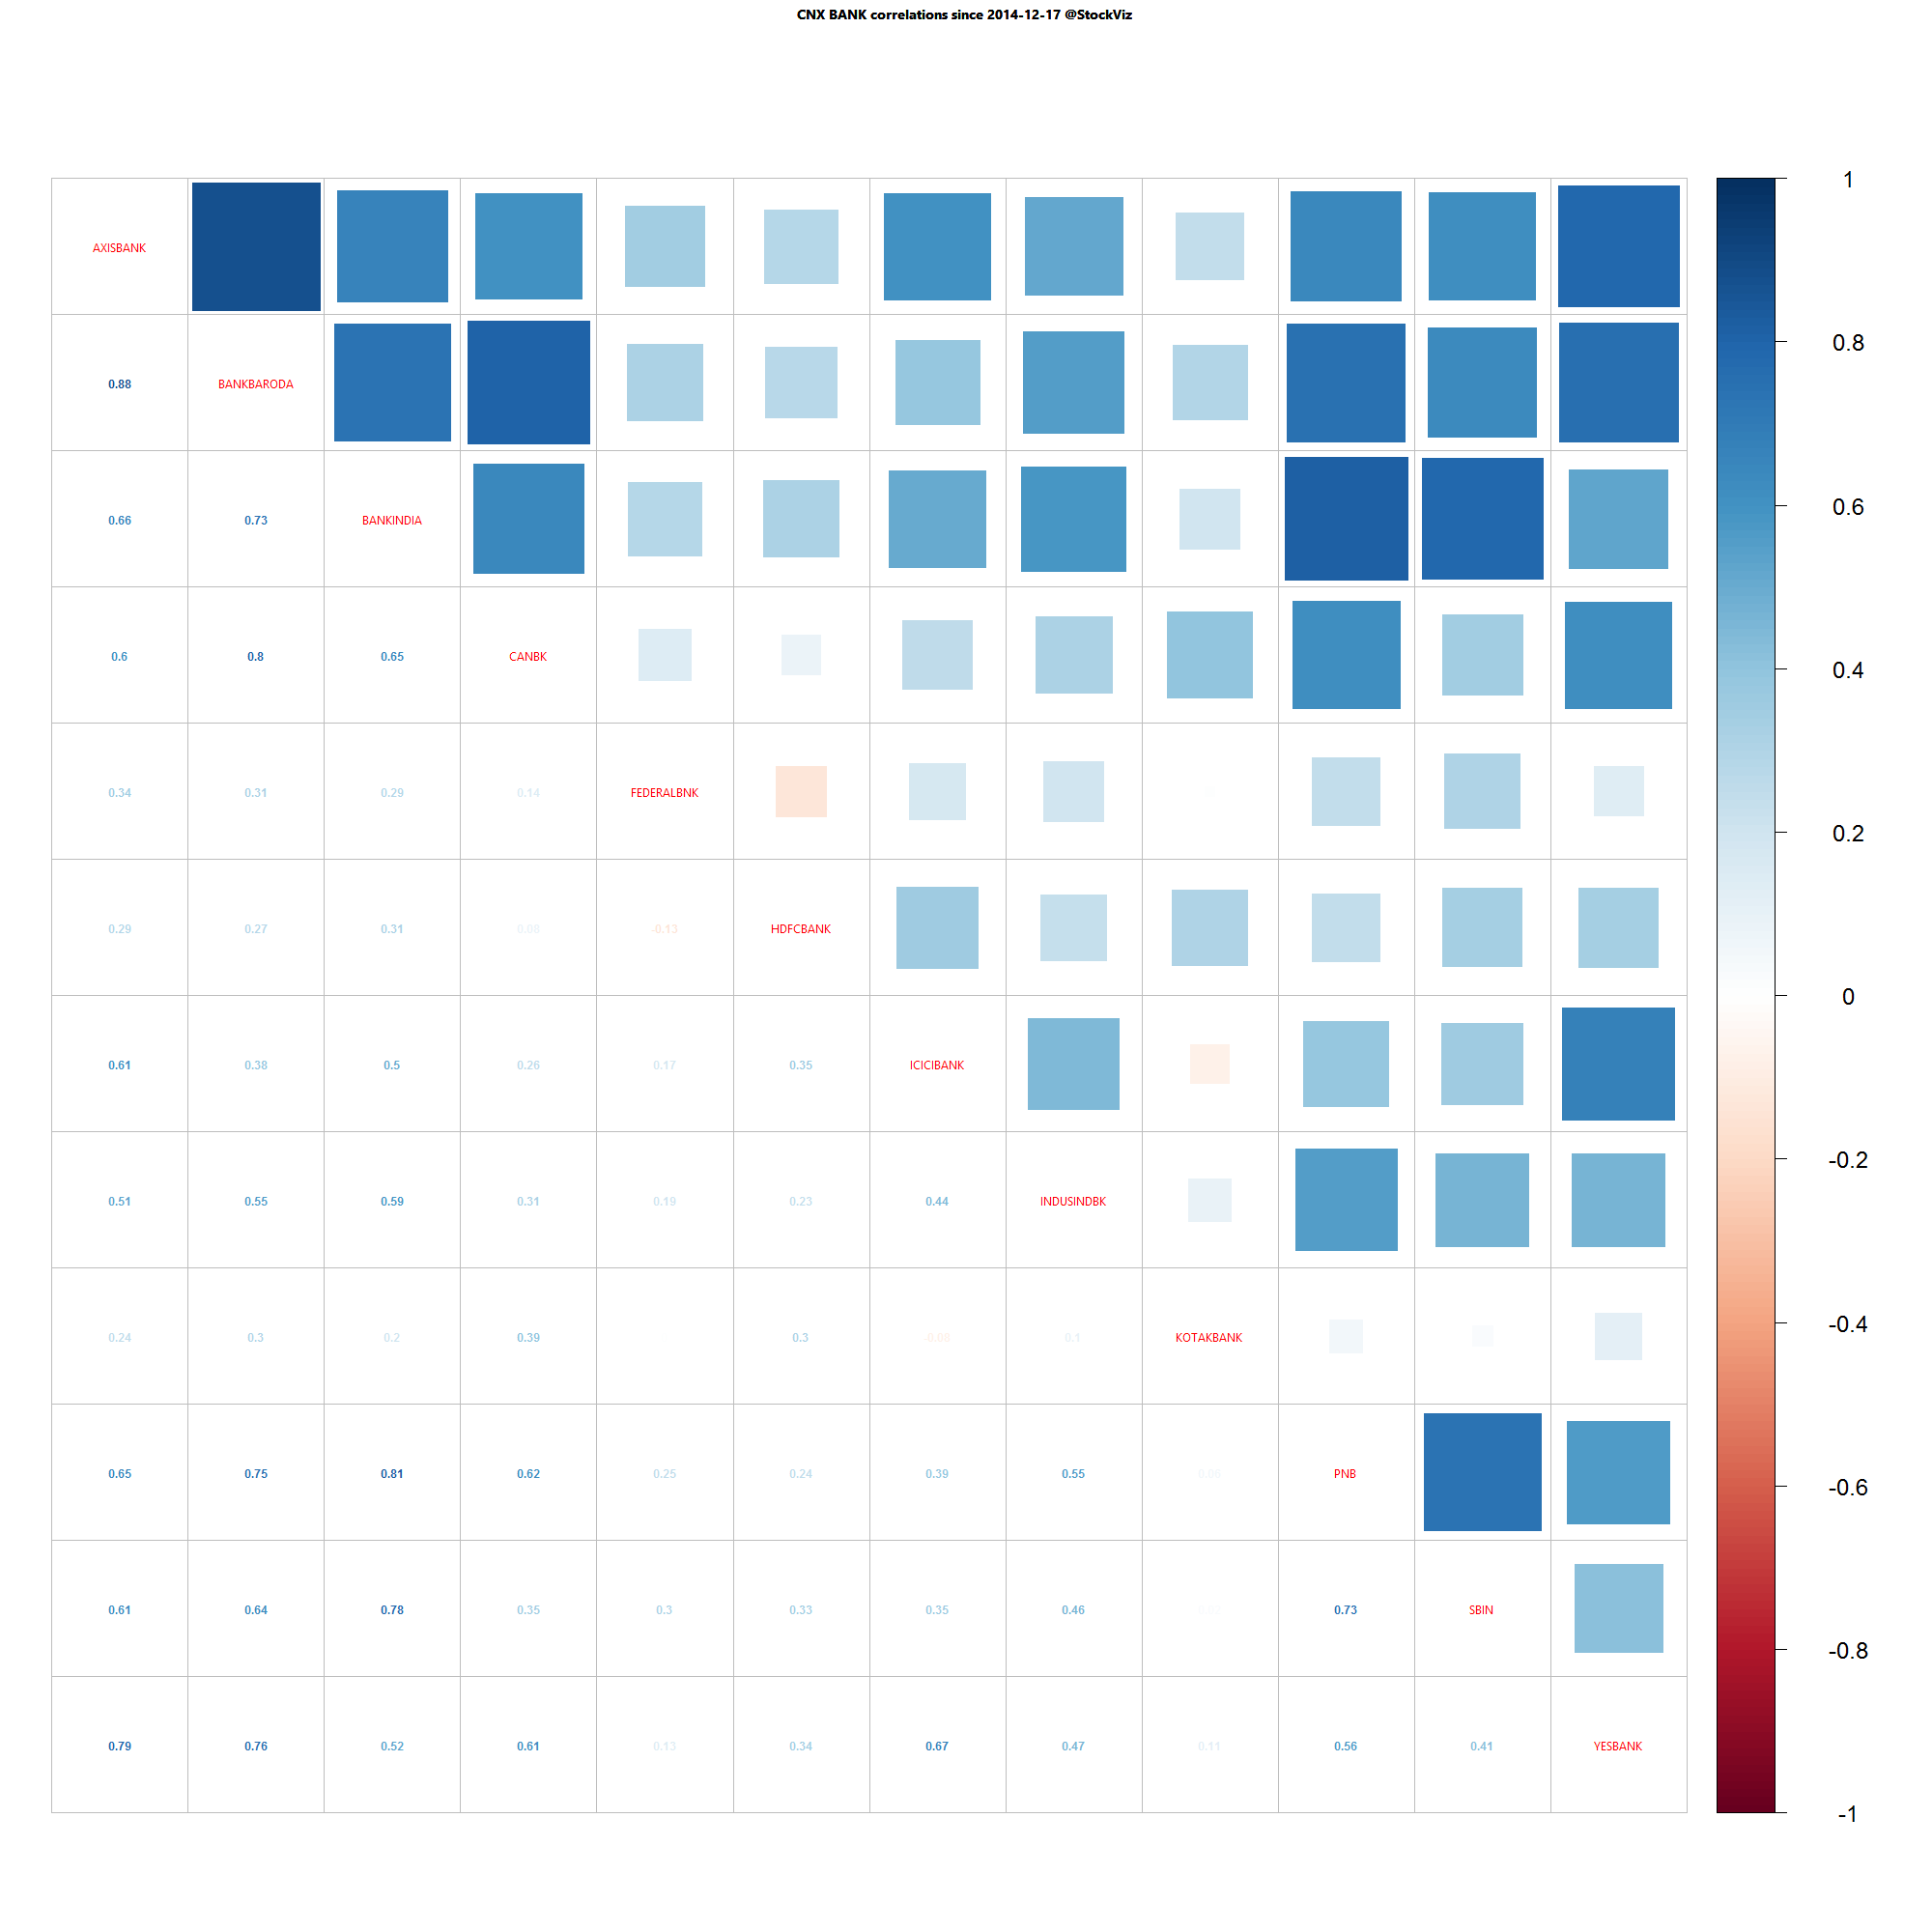
Bank Nifty one month daily return correlations

Bank Nifty one month daily return correlations

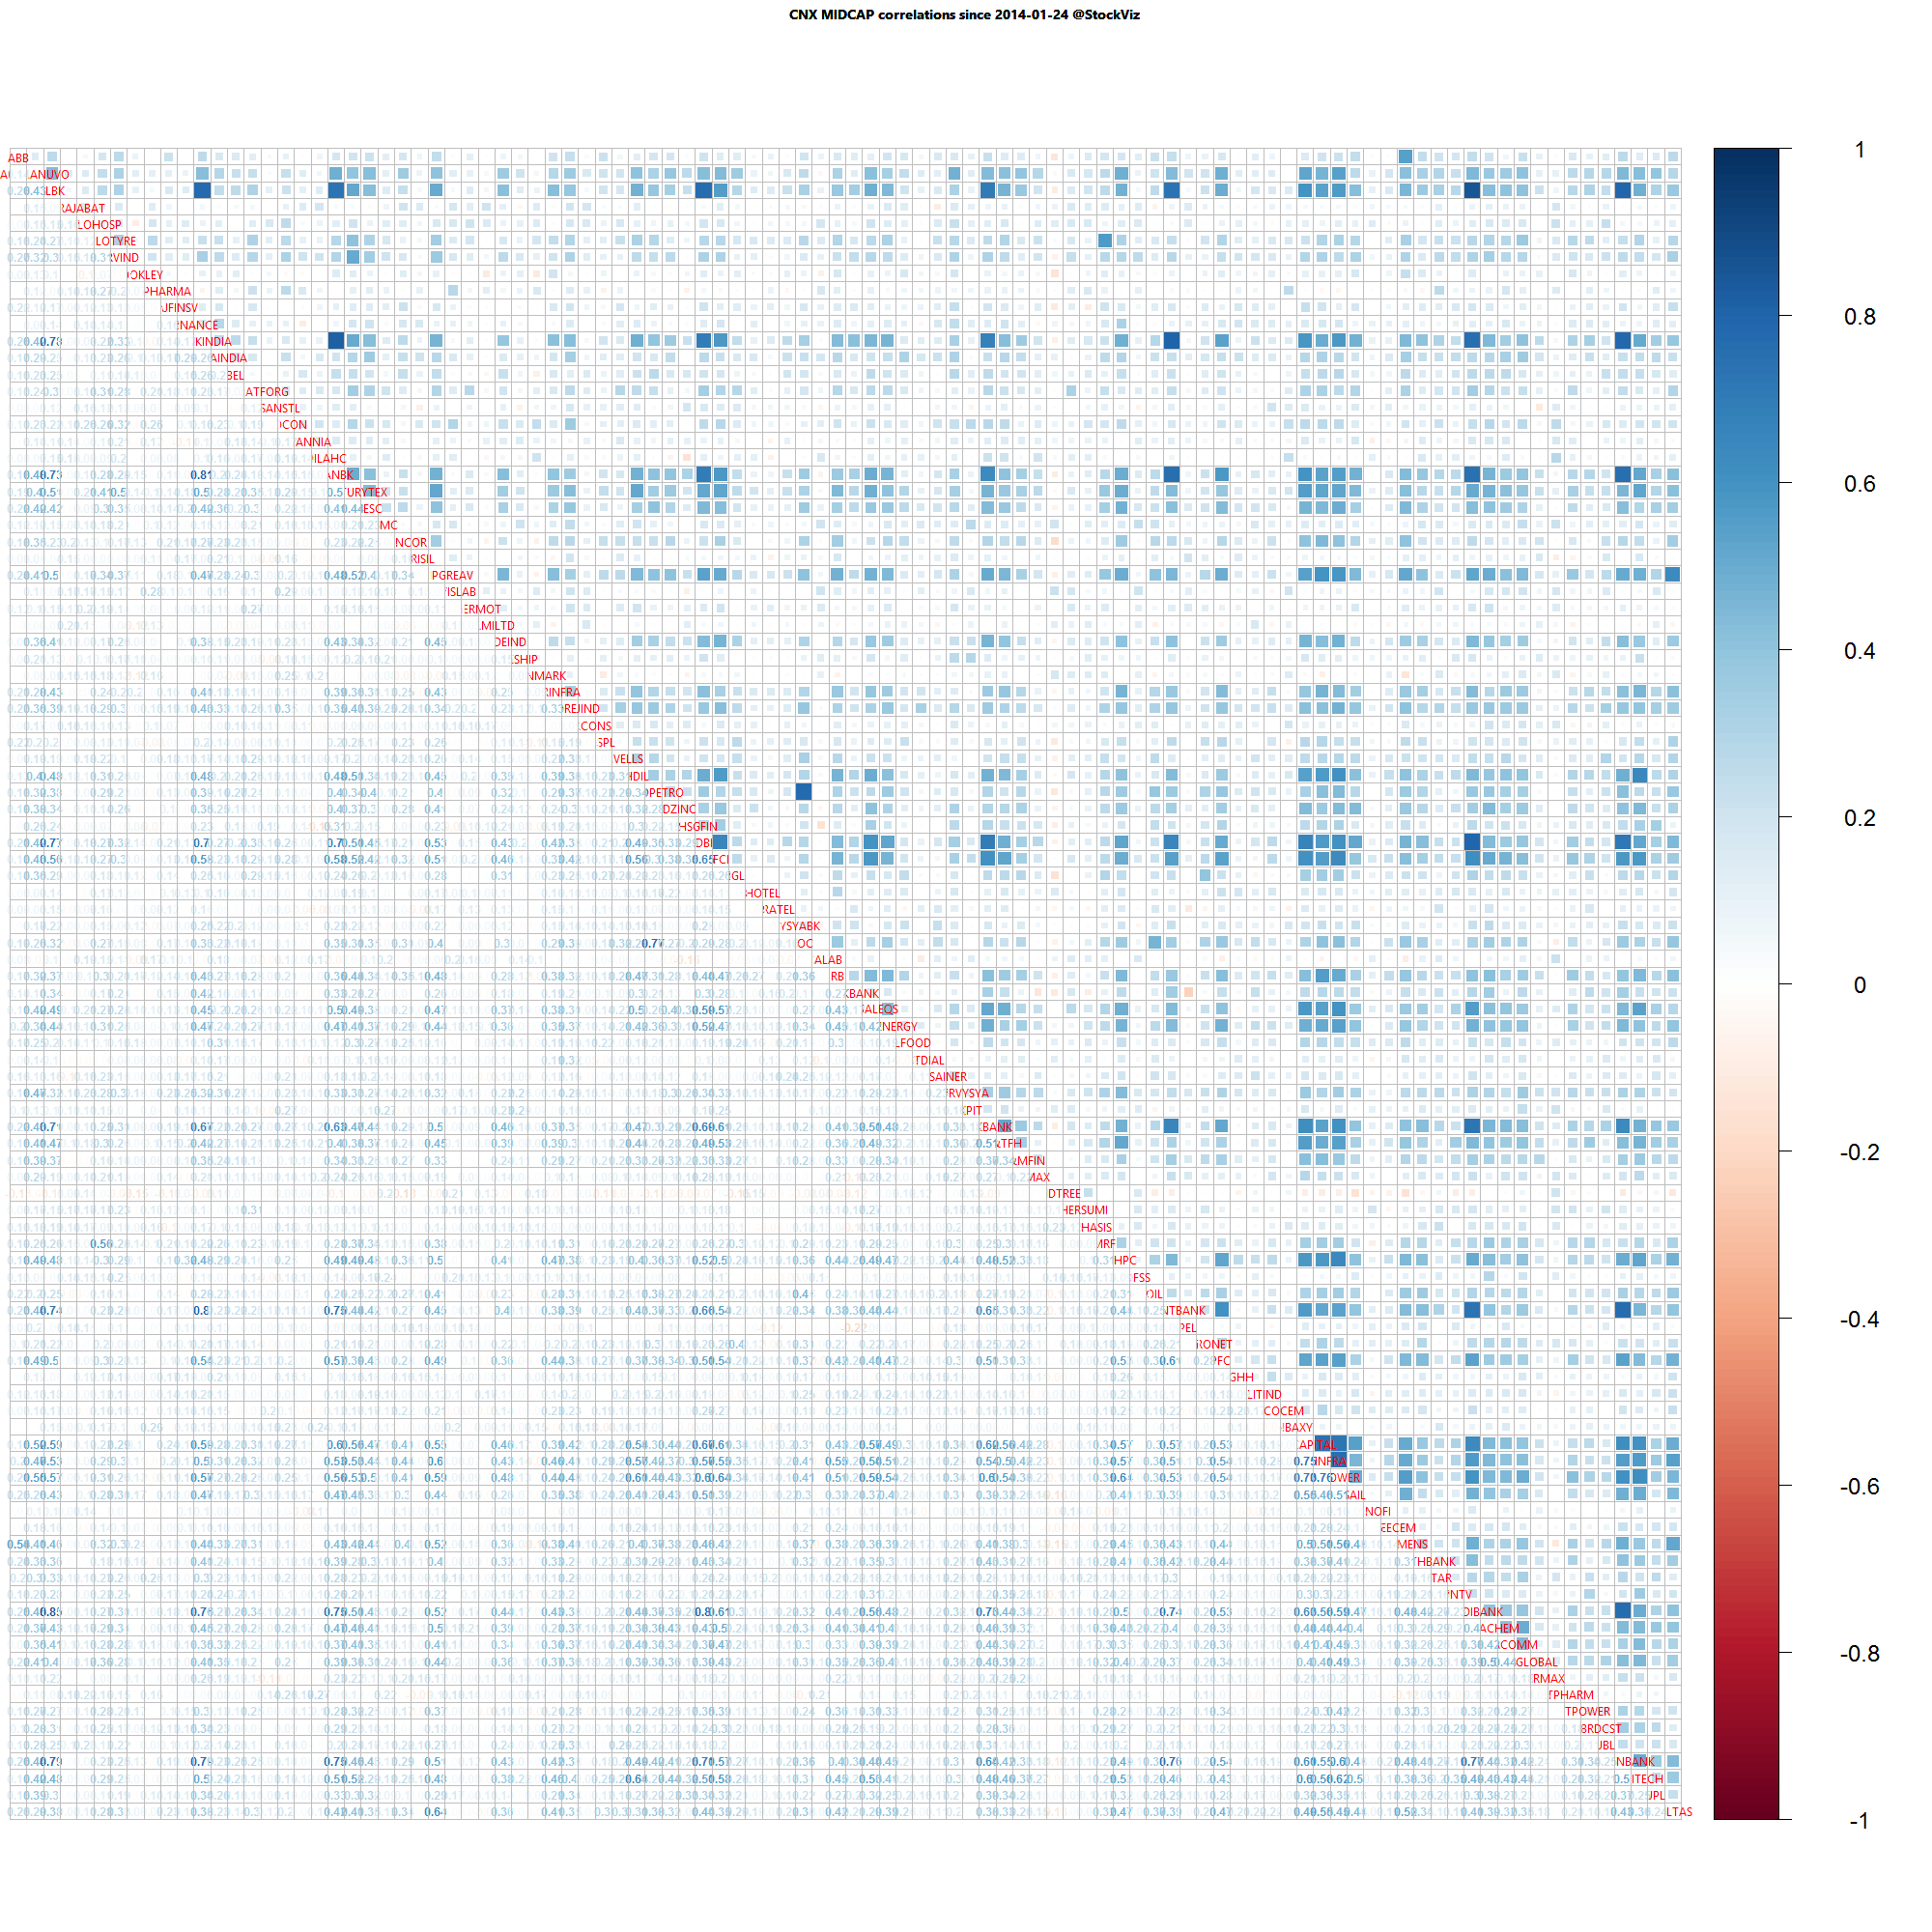
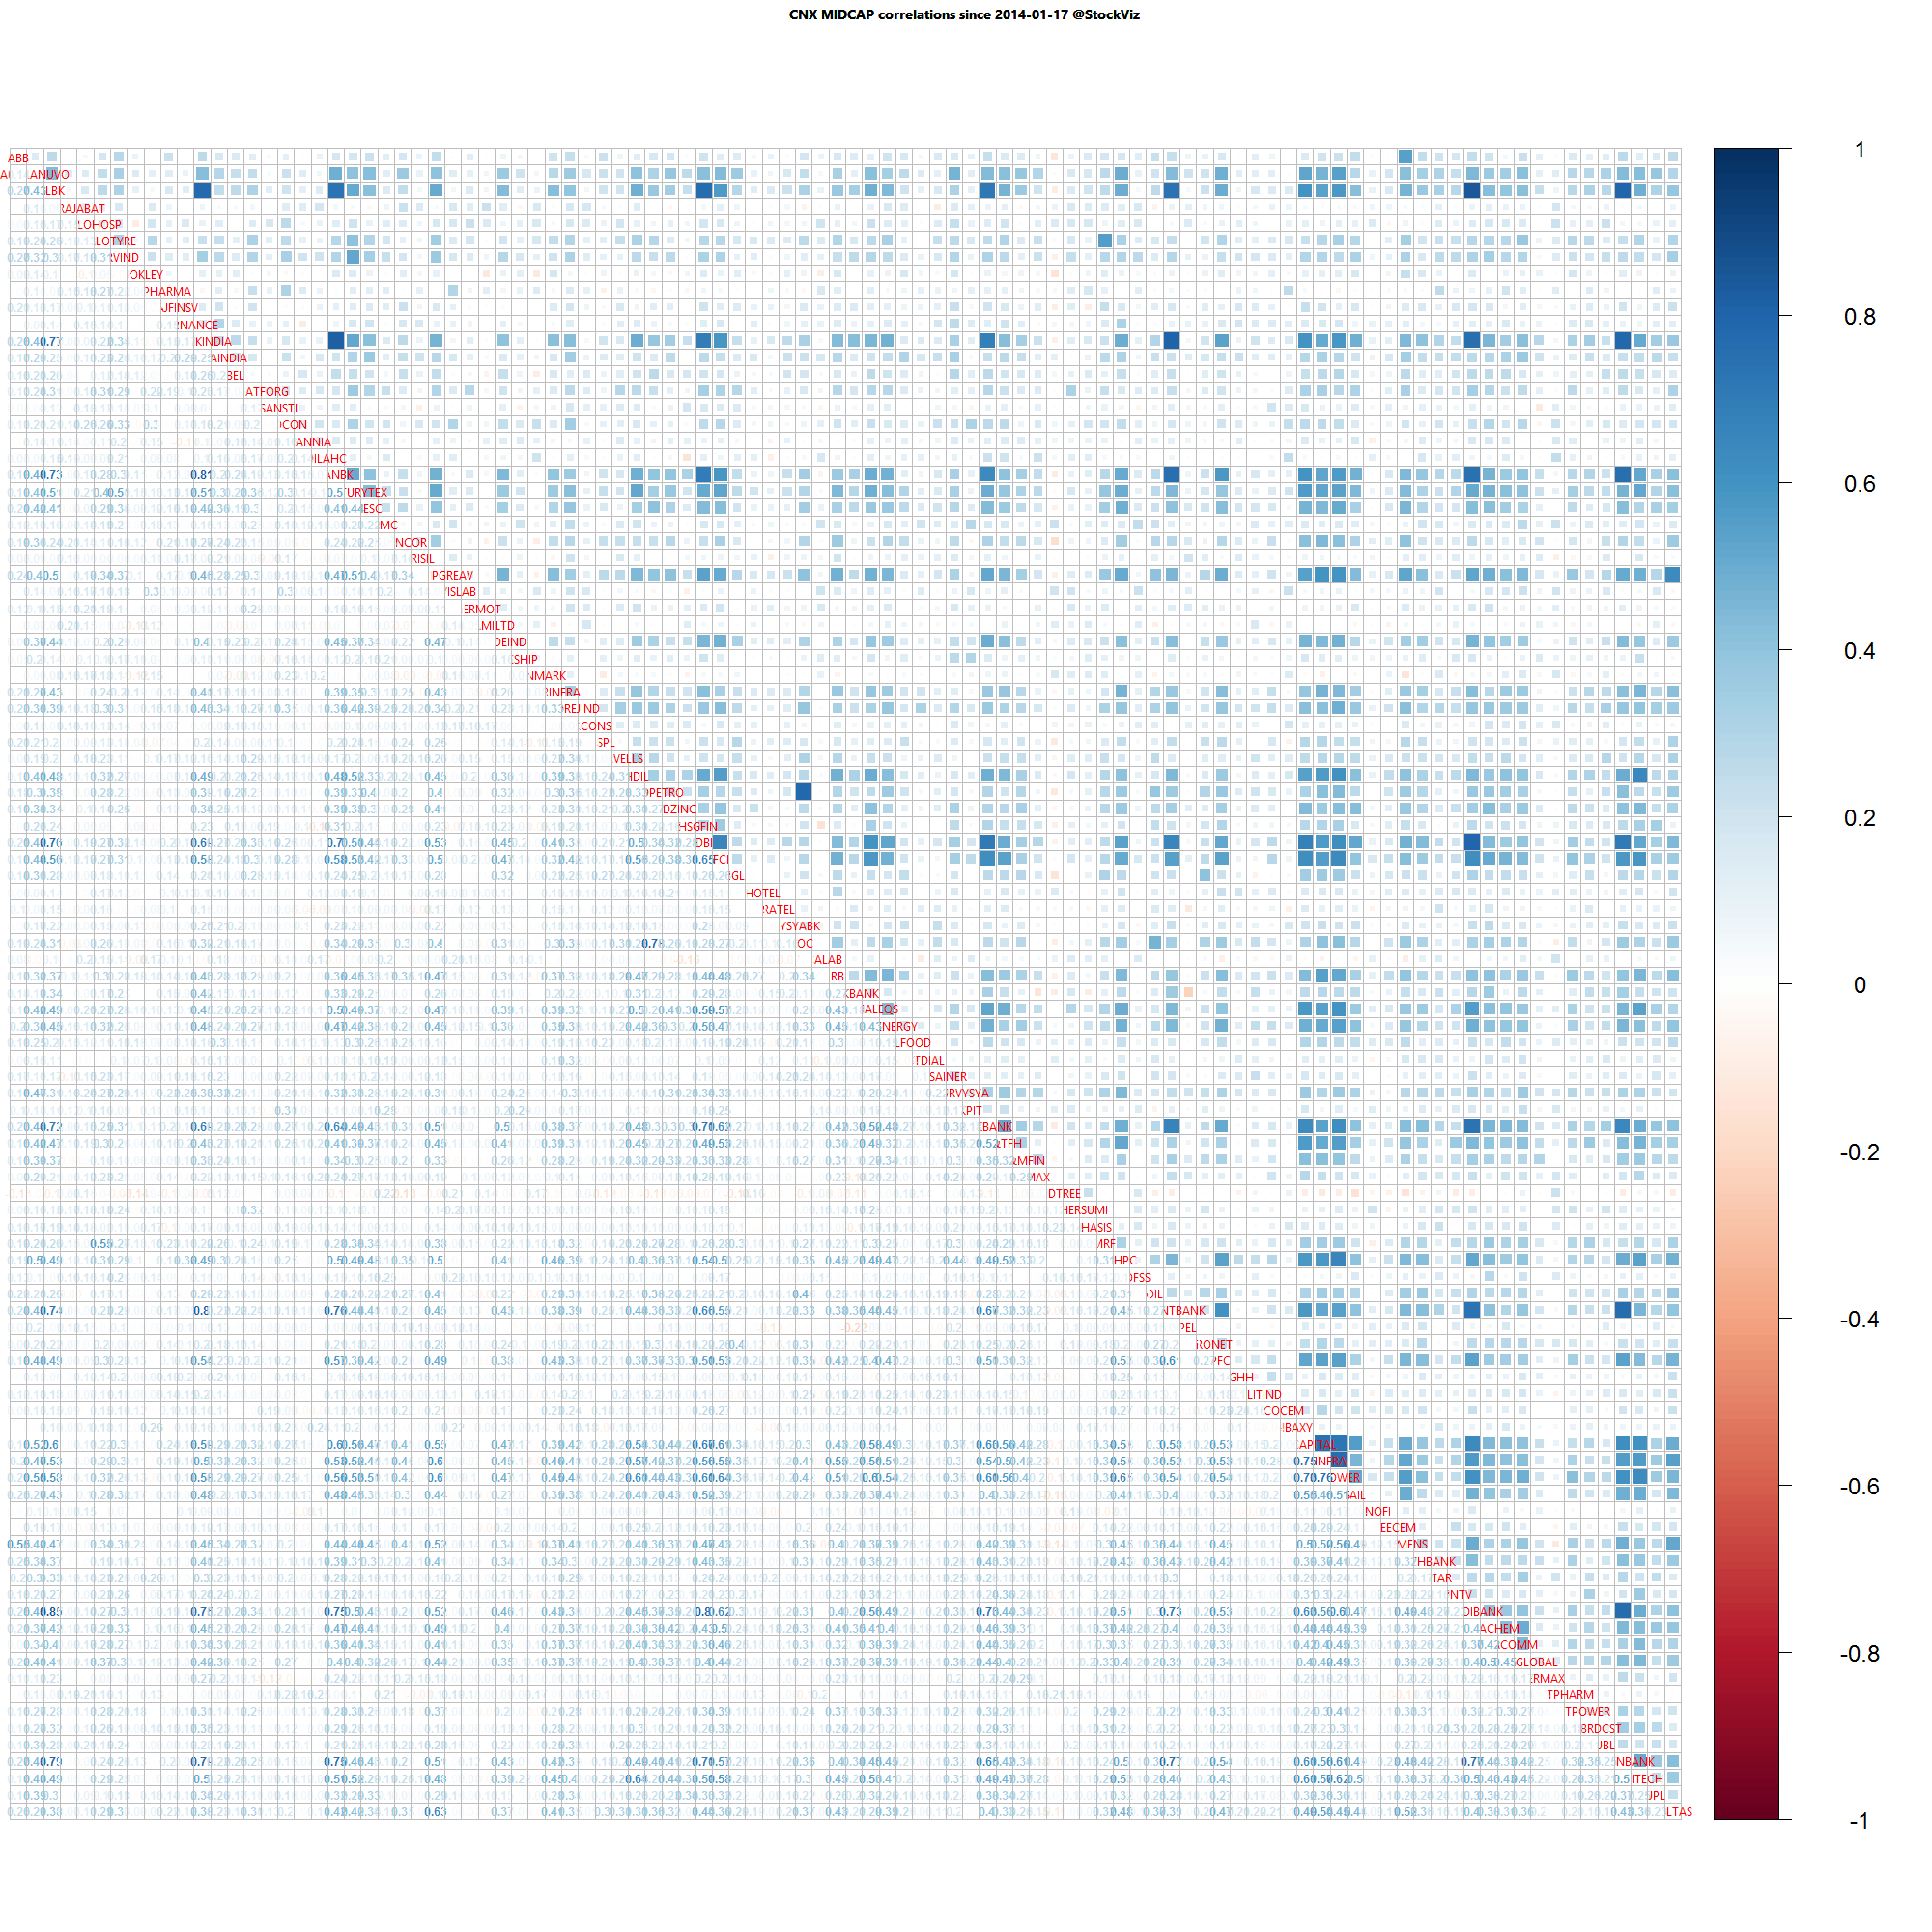
Midcap one year daily return correlations

Midcap one year daily return correlations

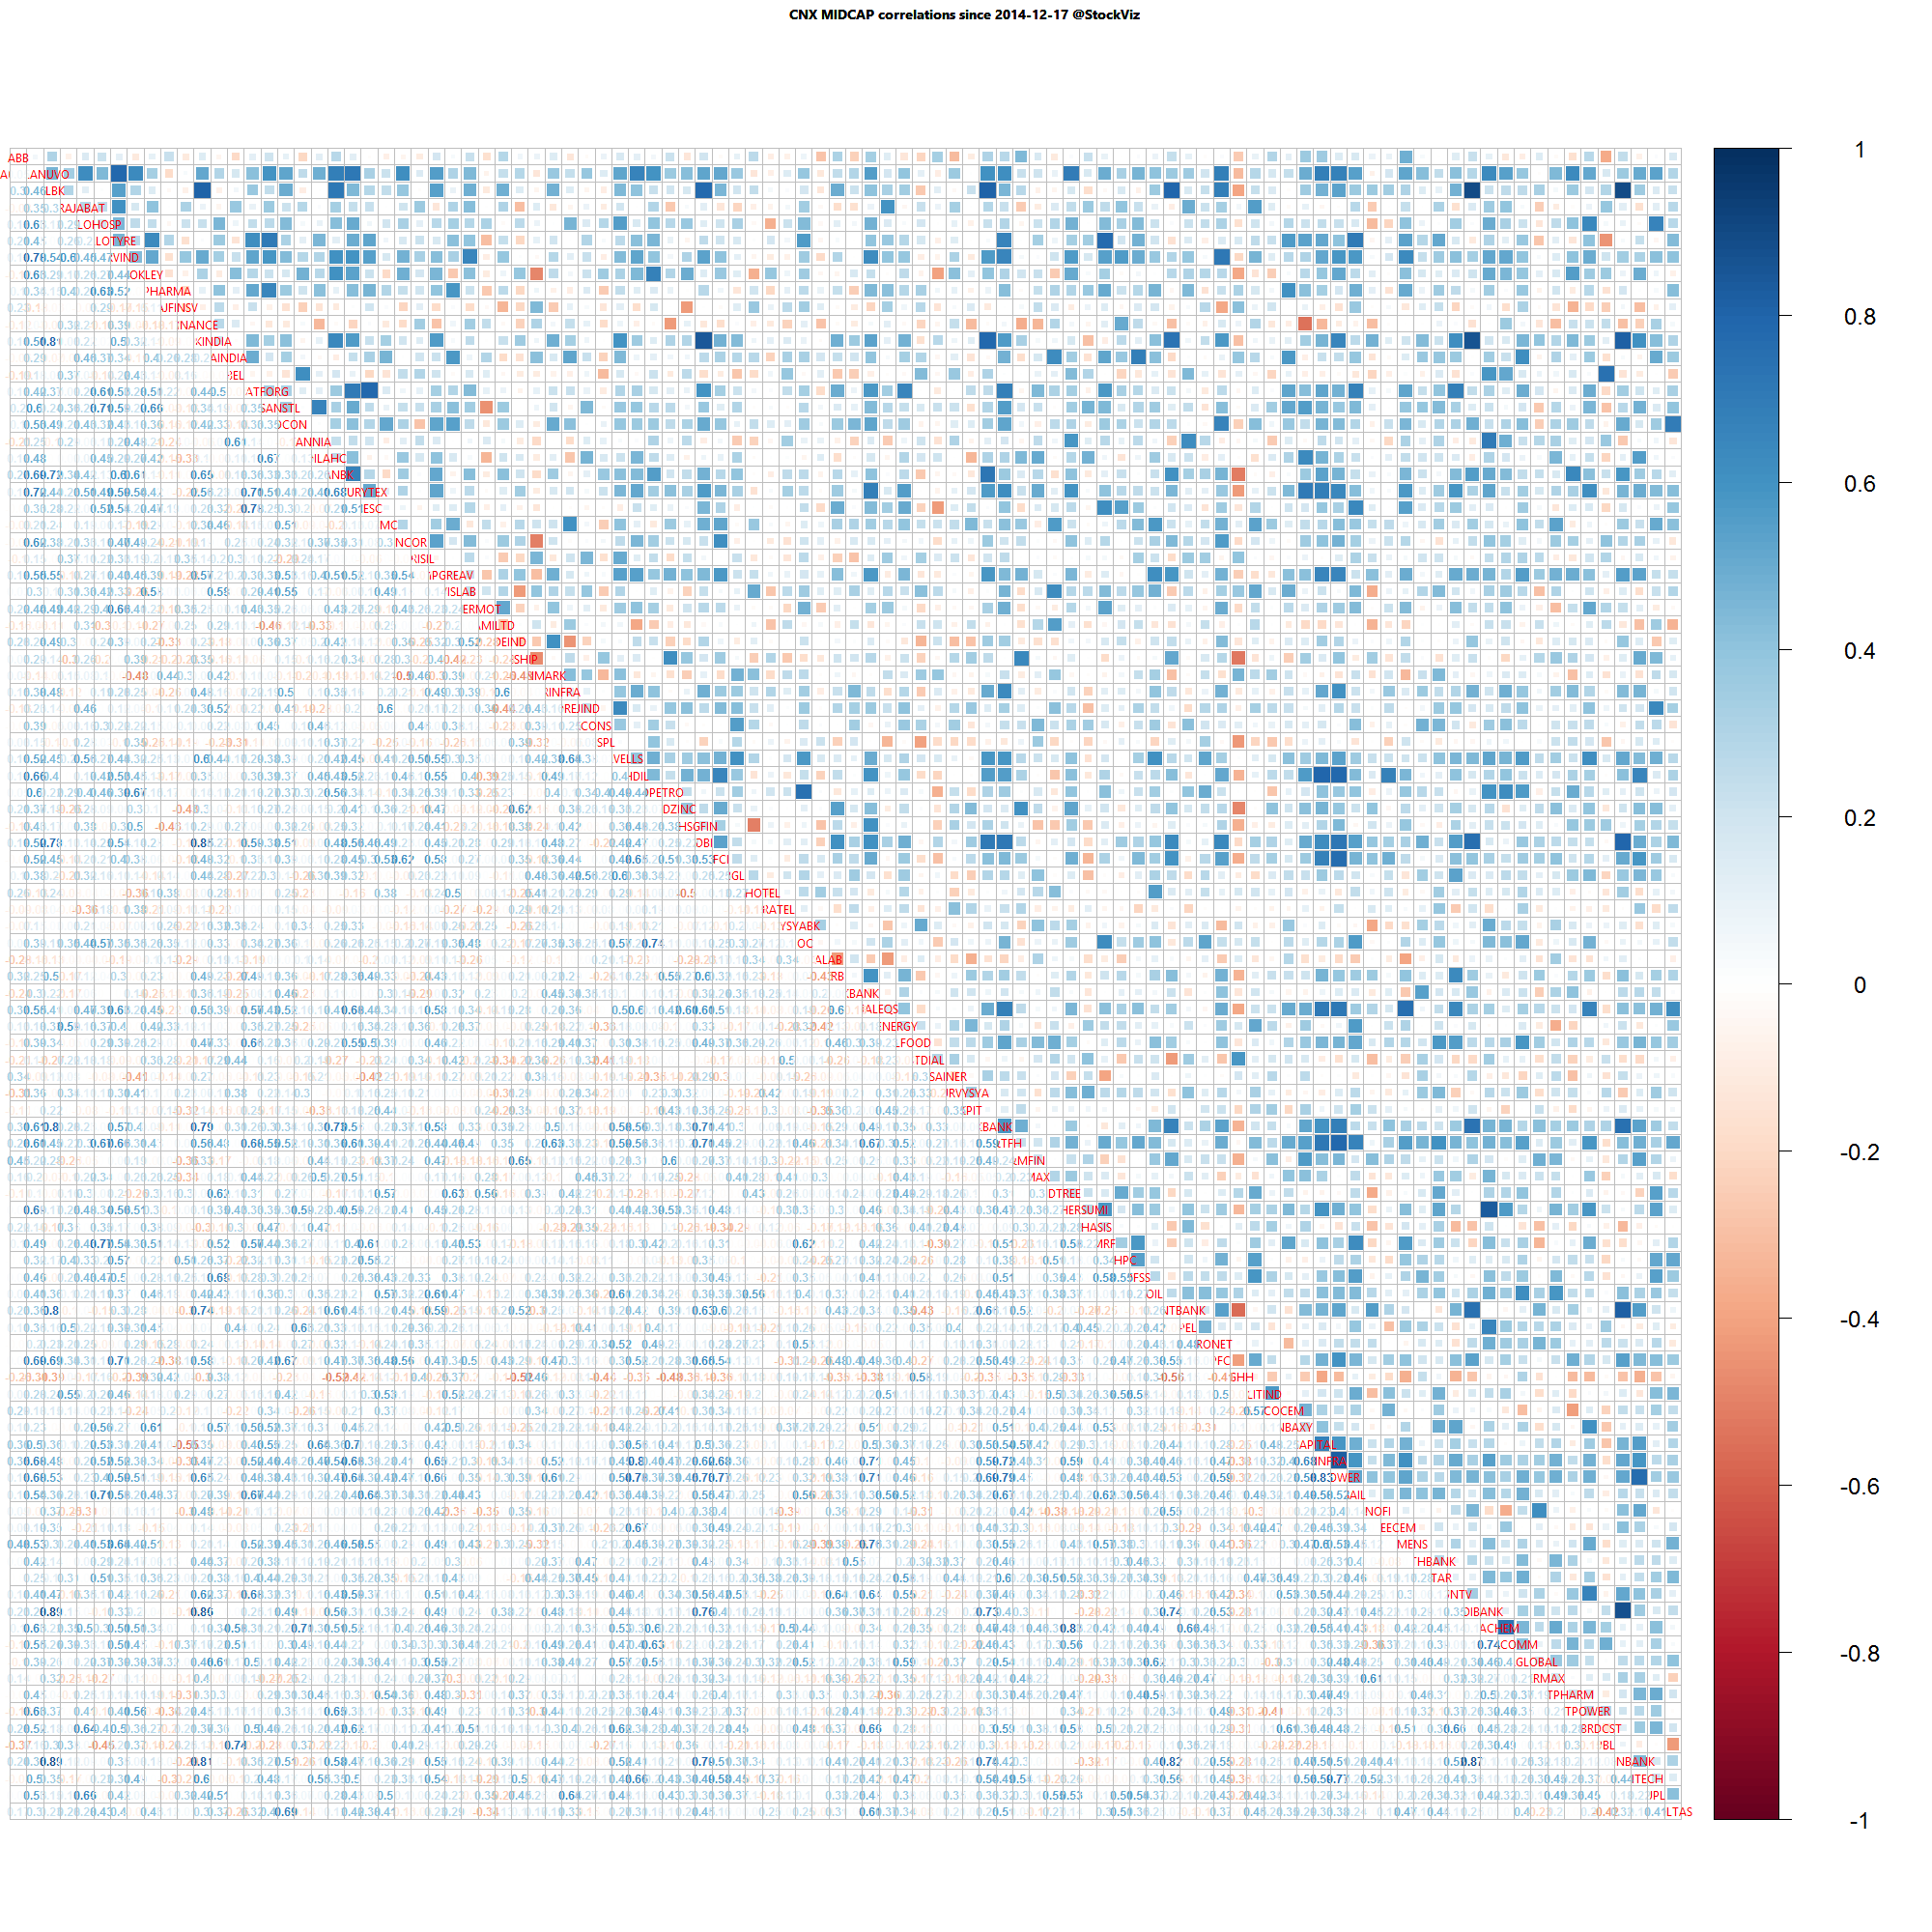
Midcap one month daily return correlations

Midcap one month daily return correlations

A lot of thick blue squares mean that positive correlations are high. Red squares mean negative correlations are high. Whites are the doldrums.

Weekly Recap: Big Bets

world.2015-1-9.2015-1-16

Equities

Major
DAX(DEU) +5.38%
CAC(FRA) +4.80%
UKX(GBR) +0.76%
NKY(JPN) -1.94%
SPX(USA) -1.44%
MINTs
JCI(IDN) -1.31%
INMEX(MEX) -2.57%
NGSEINDX(NGA) -3.68%
XU030(TUR) +0.10%
BRICS
IBOV(BRA) +0.54%
SHCOMP(CHN) +2.77%
NIFTY(IND) +2.77%
INDEXCF(RUS) +5.02%
TOP40(ZAF) -1.25%

Commodities

Energy
Heating Oil -1.82%
Brent Crude Oil +0.95%
WTI Crude Oil +0.96%
Natural Gas +4.83%
RBOB Gasoline +3.74%
Ethanol -8.81%
Metals
Gold 100oz +4.96%
Palladium -5.39%
Platinum +3.02%
Silver 5000oz +8.54%
Copper -4.66%

Currencies

USDEUR:+2.42% USDJPY:-0.89%

MINTs
USDIDR(IDN) -0.45%
USDMXN(MEX) -0.20%
USDNGN(NGA) +1.90%
USDTRY(TUR) +1.42%
BRICS
USDBRL(BRA) -0.72%
USDCNY(CHN) -0.01%
USDINR(IND) -0.73%
USDRUB(RUS) +5.82%
USDZAR(ZAF) +0.58%
Agricultural
Corn -3.20%
Feeder Cattle -3.05%
Lean Hogs -4.84%
Soybean Meal -9.92%
Wheat -6.01%
Cattle -3.58%
Coffee (Robusta) -1.52%
Cotton -2.49%
Lumber -3.34%
Sugar #11 +2.41%
Cocoa -0.25%
Coffee (Arabica) -4.38%
Orange Juice +5.89%
Soybeans -5.62%
White Sugar +1.48%

Credit Indices

Index Change
Markit CDX EM -0.63%
Markit CDX NA HY -0.40%
Markit CDX NA IG +2.89%
Markit iTraxx Asia ex-Japan IG +3.23%
Markit iTraxx Australia +2.03%
Markit iTraxx Europe +0.73%
Markit iTraxx Europe Crossover +7.83%
Markit iTraxx Japan +0.75%
Markit iTraxx SovX Western Europe -0.74%
Markit LCDX (Loan CDS) -0.43%
Markit MCDX (Municipal CDS) +2.56%
Rajan surprised us with a rate cut. But the Swiss central bank surprised a whole bunch of FX brokers and punters by abandoning their peg against the Euro. Most developed country 10-year yields are either at zero or negative. Investors are paying the Swiss for the privilege of lending them money!

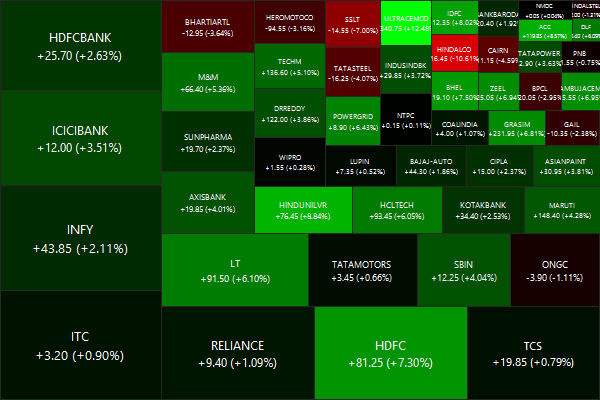
Nifty Heatmap

CNX NIFTY.2015-1-9.2015-1-16

Index Returns

index performance.2015-1-9.2015-1-16

Sector Performance

sector performance.2015-1-9.2015-1-16

Advance Decline

advance.decline.line2.2015-1-9.2015-1-16

Market Cap Decile Performance

Decile Mkt. Cap. Adv/Decl
1 (micro) +0.74% 70/65
2 -0.29% 74/61
3 +1.86% 73/62
4 +1.33% 68/67
5 +0.33% 68/67
6 +1.61% 73/62
7 +1.28% 66/69
8 +1.72% 70/65
9 +2.28% 71/64
10 (mega) +2.90% 68/67
Large caps outperformed mid and small caps.

Top Winners and Losers

BOSCHLTD +10.24%
UPL +11.37%
ULTRACEMCO +12.48%
HINDALCO -10.61%
PETRONET -7.62%
SSLT -7.00%
Miners got pummeled. The end of a super-cycle brings many deaths…

ETF Performance

PSUBNKBEES +3.43%
JUNIORBEES +3.38%
BANKBEES +3.28%
GOLDBEES +3.09%
NIFTYBEES +2.99%
CPSEETF -0.04%
INFRABEES -0.60%
Go Rate-Cut Rajan!

Yield Curve

yield Curve.2015-1-9.2015-1-16

Bond Indices

Sub Index Change in YTM Total Return(%)
GSEC TB -0.10 +0.18%
GSEC SUB 1-3 -0.48 +0.49%
GSEC SUB 3-8 -0.32 +1.36%
GSEC SUB 8 -0.28 +2.57%
The long-end continues to rock investor returns…

Investment Theme Performance

Thought for the weekend

Concentration produces wealth. Diversification protects it.
Concentration produces innovation. Diversification produces mediocrity.
Make big bets, do fewer things, concentrate your resources.
Don’t hedge, commit.

Source: Making Big Bets

Correlation Update 17.01.2015

Nifty one year daily return correlations

Nifty one year daily return correlations

Nifty one month daily return correlations

Nifty one month daily return correlations

Bank Nifty one year daily return correlations

Bank Nifty one year daily return correlations

Bank Nifty one month daily return correlations

Bank Nifty one month daily return correlations

Midcap one year daily return correlations

Midcap one year daily return correlations

Midcap one month daily return correlations

Midcap one month daily return correlations

A lot of thick blue squares mean that positive correlations are high. Red squares mean negative correlations are high. Whites are the doldrums.

Weekly Recap: Surge!

world.2015-01-2.2015-01-09

Equities

Major
DAX(DEU) -1.19%
CAC(FRA) -1.72%
UKX(GBR) -0.71%
NKY(JPN) -1.45%
SPX(USA) -0.31%
MINTs
JCI(IDN) -0.50%
INMEX(MEX) -0.15%
NGSEINDX(NGA) -13.03%
XU030(TUR) +2.55%
BRICS
IBOV(BRA) +0.73%
SHCOMP(CHN) +1.57%
NIFTY(IND) -1.32%
INDEXCF(RUS) +8.50%
TOP40(ZAF) -1.61%

Commodities

Energy
Ethanol -8.70%
Brent Crude Oil -11.76%
Heating Oil -6.41%
Natural Gas -3.70%
RBOB Gasoline -8.49%
WTI Crude Oil -9.43%
Metals
Platinum +2.32%
Gold 100oz +2.78%
Silver 5000oz +5.81%
Copper -1.76%
Palladium +1.02%

Currencies

USDEUR:+1.44% USDJPY:-1.50%

MINTs
USDIDR(IDN) +0.81%
USDMXN(MEX) -1.40%
USDNGN(NGA) -2.29%
USDTRY(TUR) -2.00%
BRICS
USDBRL(BRA) -2.19%
USDCNY(CHN) +0.02%
USDINR(IND) -1.53%
USDRUB(RUS) +4.93%
USDZAR(ZAF) -1.79%
Agricultural
Cattle -2.98%
Corn +1.98%
Orange Juice -2.50%
Soybean Meal +2.07%
Soybeans +4.65%
Cotton +1.86%
Lean Hogs -3.52%
Sugar #11 +4.77%
Feeder Cattle -1.12%
Lumber -2.61%
Wheat -1.99%
Cocoa +2.41%
Coffee (Arabica) +13.60%
Coffee (Robusta) +7.25%
White Sugar +3.45%

Credit Indices

Index Change
Markit CDX EM -1.72%
Markit CDX NA HY -0.96%
Markit CDX NA IG +3.91%
Markit iTraxx Asia ex-Japan IG +12.78%
Markit iTraxx Australia +7.50%
Markit iTraxx Europe +1.52%
Markit iTraxx Europe Crossover +8.23%
Markit iTraxx Japan +5.72%
Markit iTraxx SovX Western Europe +1.50%
Markit LCDX (Loan CDS) +0.06%
Markit MCDX (Municipal CDS) +1.54%
Precious metals found a bid, the dollar rally took a pause for the cause, energy continued to tumble, credit widened and Nigeria got ground to dust.

Nifty Heatmap

CNX NIFTY.2015-01-2.2015-01-09

Index Returns

index performance.2015-01-2.2015-01-09

Sector Performance

sector performance.2015-01-2.2015-01-09

Advance Decline

advance.decline.line2.2015-01-2.2015-01-09

Market Cap Decile Performance

Decile Mkt. Cap. Adv/Decl
1 (micro) +2.17% 66/70
2 +1.39% 70/66
3 +0.62% 73/63
4 +3.15% 74/63
5 +0.78% 74/62
6 -0.28% 64/72
7 +0.29% 68/69
8 +0.01% 66/70
9 -0.54% 59/77
10 (mega) -0.44% 66/71
Mid-caps were a sight for sore eyes…

Top Winners and Losers

HINDPETRO +7.84%
UBL +8.18%
HINDUNILVR +14.37%
PFC -8.51%
NMDC -7.89%
IDEA -7.69%
Who would’ve thunk that Unilever can post double digit returns in a week?

ETF Performance

GOLDBEES +0.21%
INFRABEES -1.09%
NIFTYBEES -1.30%
CPSEETF -1.47%
BANKBEES -2.62%
JUNIORBEES -2.87%
PSUBNKBEES -4.84%
After “gyan sangam” comes the hangover. Decades of mismanagement, vested interests and perverse incentives cannot be wished away…

Yield Curve

yield Curve.2015-01-2.2015-01-09

Bond Indices

Sub Index Change in YTM Total Return(%)
GSEC TB -0.27 +0.23%
GSEC SUB 1-3 -0.63 +0.31%
GSEC SUB 3-8 -0.03 +0.46%
GSEC SUB 8 +0.03 -0.05%
Rate cuts factored in and some more…

Investment Theme Performance

Thought for the weekend

If your hairdresser or auto mechanic is busy, you get penciled in for next week. She doesn’t tell you she’ll fit you in tomorrow at double her usual rate.

Source: Surge!