Tag: VIX

VIX and Equity Index Returns, Part I

The VIX is a measure of implied volatility of the underlying index. For example, the CBOE Volatility Index is a measure of 30-day expected volatility derived from S&P 500 Index call and put option prices, India VIX similarly uses the NIFTY 50 call and put options prices to derive a measure of volatility. The question we will try to address in this series of posts is whether the VIX can be used to time entries and exits on the underlying index.

The VIX time-series

CBOE and India VIX
The VIX on S&P 500 has been around since the 90’s whereas India VIX started out around 2009. Moreover, the US enjoys a much wider and deeper market for volatility products than any other market in the world. VIX futures, VIX options, VIX of VIX, volatility ETFs and their inverse, all trade fairly well. Whereas in India, even though VIX futures have been listed for a while, it rarely trades. Trading activity of a derivative (VIX, in this case) invariably has an effect on the underlying (S&P 500, NIFTY 50…) So we expect the relationship between S&P 500 VIX and the S&P 500 index to be closer than that between India VIX and the NIFTY 50 index.

VIX quintiles

To begin, we will bucket the trailing 1000-day VIX closing prices into quintiles and observe the next 5, 10, 15 and 20-day returns of the underlying index over them.
S&P 500 VIX
SP500 returns over VIX quintiles
And, more recently:
SP500 returns over VIX quintiles

What is striking here, is that subsequent returns off the 5th quintile (when VIX is at its highest) is higher with smaller negative outliers than returns off the 1st quintile (when VIX is a its lowest.) This is counter-intuitive to the notion that “volatility begets volatility” so investors are better off staying away from the market when it is volatile.

India VIX and NIFTY 50 shows a similar pattern*:
NIFTY 50 returns over India VIX quintiles
*Smaller sample compared to the S&P 500 dataset.

A simple back-test

What happens to a long-only portfolio if it is long the index only when the VIX is within a particular quintile?
S&P 500/VIX
S&P 500 returns over different VIX quintiles
The strategy that is long when VIX is in the 5th quintile (L5) out-performs the other quintile strategies. Also, if you ignore the 2008 collapse, L5 has the shallowest of drawdowns.
NIFTY 50/VIX
Something similar happens with NIFTY 50 as well:
NIFTY 50 returns over different VIX quintiles

Implications

Cash-only investors can point to the superiority of buy&hold compared to these VIX-based strategies. However, the shallow drawdowns exhibited by the L5 strategy (long index when VIX is in the 5th quintile) is attractive to leveraged traders. For example, NIFTY 50 futures leverage is between 8x and 10x. So even if you play it safe and leverage only 5x, L5 returns would end up at ~100% compared to buy&hold’s 80% over the same period.

We will dig deeper in the next part of this series. Stay tuned!

Code and more charts are on github.

Volatility and VIX Charts

Our Volatility and VIX Collection had some charts that were more than two years old. This post updates some of those charts and will re-create them more often.

Volatility can be measured in a number of ways and its profile changes based on the look-back period. The parameters are selected based on what the volatility estimate is used for. Moreover, no two indices exhibit the same profile – traders need to be vary of transplanting trading strategies that work for one market into another.

Historical volatility density plots

20-day historical volatility density plots

historical volatility density plot

20-day historical volatility plots

US S&P 500
S&P 500 20-day historical volatility
Japanese Nikkei 225
Nikkei 225 20-day historical volatility
Indian NIFTY 50
NIFTY 50 20-day historical volatility

Implied volatility

S&P 500 VIX and NIFTY 50 VIX

Code and a lot more charts are on github.
Volatility

Introduction

Historical volatility and implied volatility.
Read: Part I, Part II

Nifty volatility

Density plots of historical volatility over different horizons.
Read: Large Moves Happen Together, NIFTY Volatility, Historical Perspective
Charts that are updated often: Volatility and VIX Charts

Dollar ETF volatilities

When you convert Indian indices to dollars, their volatility profile changes.
Read: INDA vs. SPY Observed Volatility

VIX – Implied Volatility Index

Do VIX indices across markets have any relationship with each other?
Read: India VIX vs. SPX VIX

Can a simple VIX based trading strategy avoid market losses?
Read: Macro Volatility and the NIFTY 50, VIX and Equity Index Returns, Part I, Part II.

Can VIX be predicted using a simple model?
ARMA + GARCH to Predict VIX

India VIX vs. SPX VIX

The VIX index is considered a gauge of fear in the markets. A high VIX entails high option implied volatility and occurs when traders bid up options. Given the recent market turbulence where pretty much all asset classes and equity markets across the board tanked, we wanted to check if VIX indices across markets had any relationship with each other.

VIX since 2009

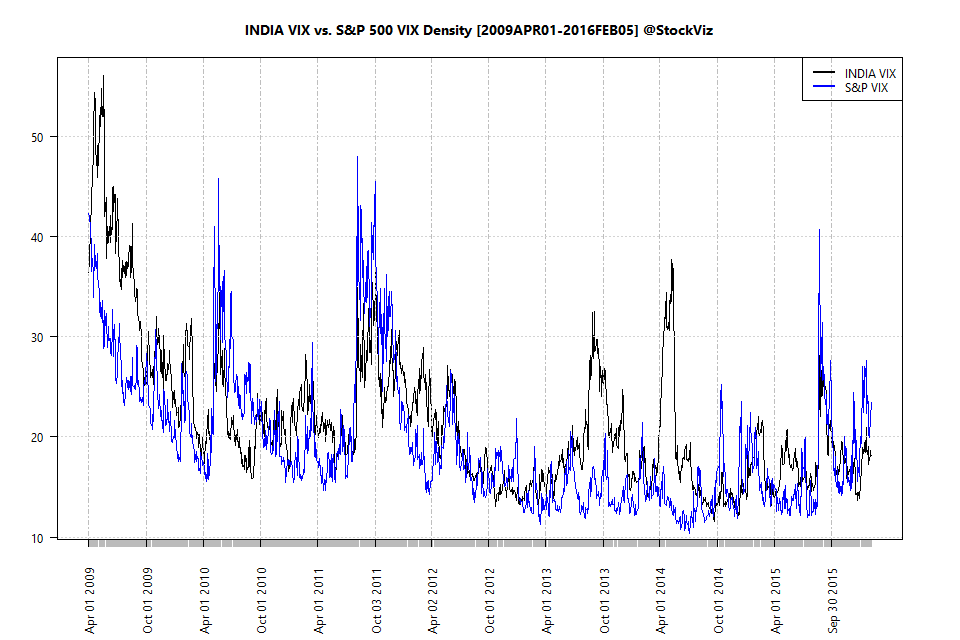
The India VIX index was introduced only in 2009. Let’s start by plotting it vs. the S&P 500 (SPX) Vix to see if it passes a visual sniff test.

vix.historical

We can see at least five instances where India Vix popped without a corresponding move by SPX VIX.

Distribution

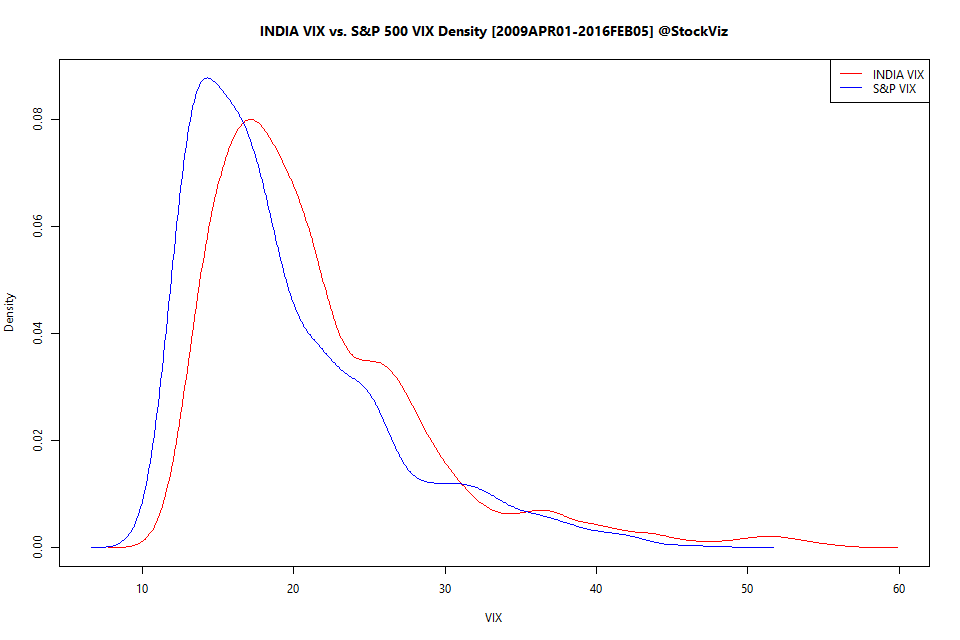
The problem with trying to nail down a relationship between the two indices is that, as one would expect, India VIX is way more dispersed than its SPX counterpart. Here’s the density plot.

india vix - spx vix density plot

India vs. spx vix density plot by year.

They might share the same suffix, but they are two completely different beasts.

Cross-correlation

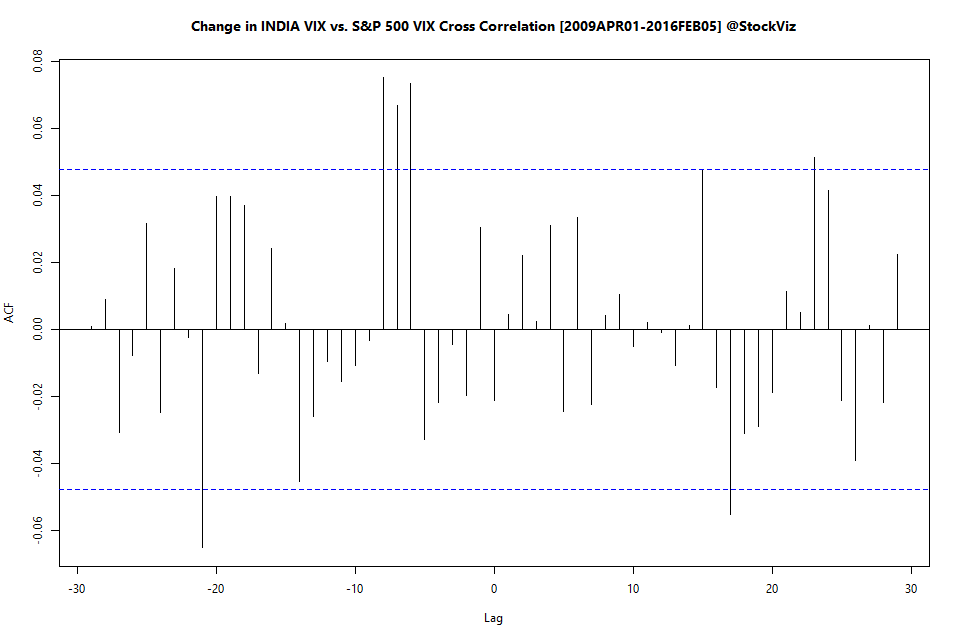
The plots above look at VIX levels. Maybe we should check if the changes in VIX are related. Here’s the cross-correlation plot.

india vix and spx vix cross-correlation plot

India vix and spx vix cross correlation by year.

Conclusion

We cannot really use the two Vix indices to predict each other’s moves.

ARMA + GARCH to Predict VIX

GARCH(1,1)

GARCH(1,1) is a common approach for modeling volatility. They were developed by Robert Engle to deal with the problem of auto-correlated residuals (which occurs when you have volatility clustering, for example) in time-series regression.

What we did:

  1. Picked the best fit ARIMA(p,d,q) model for historical VIX over different look back periods
  2. Created a GARCH(1,1) model based on ARMA(p,q)
  3. Predicted t+1 VIX

500-day lookback

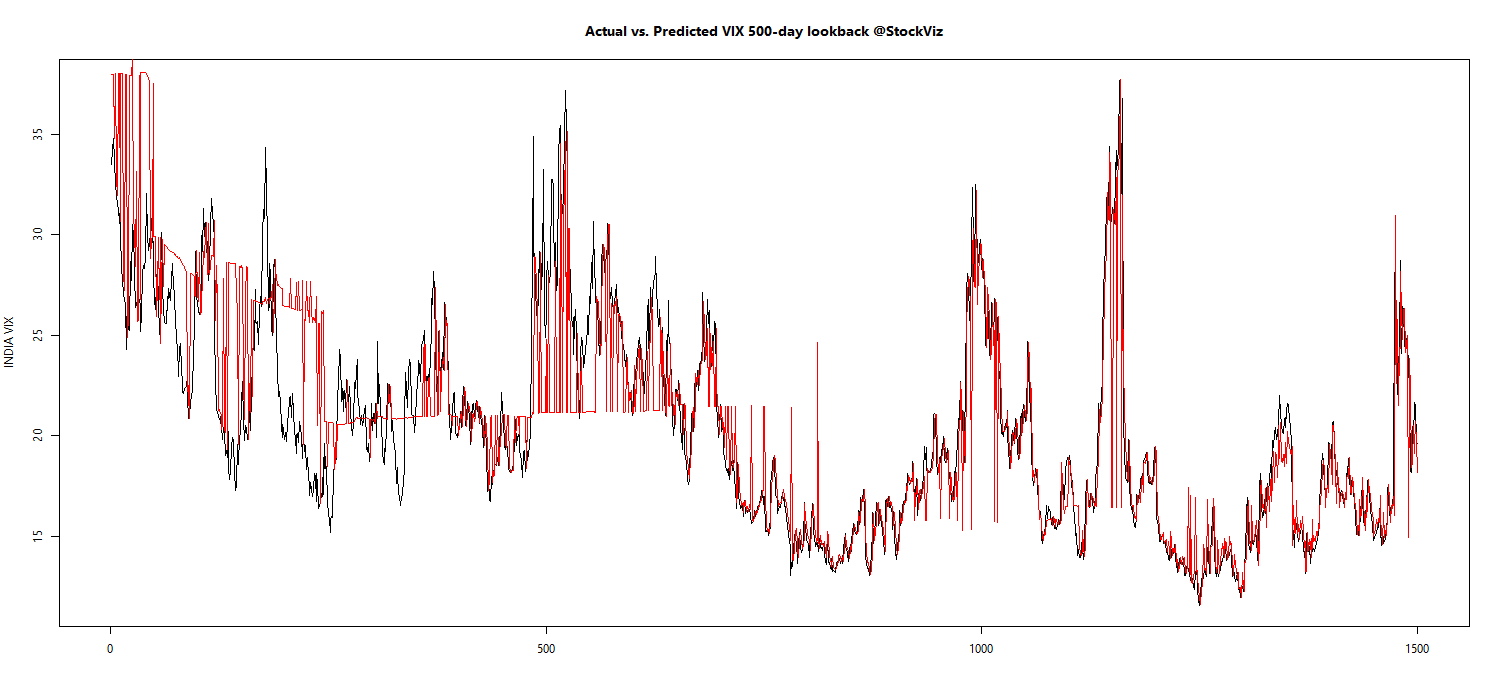
We found that modeling based on the previous 500-day VIX closing levels gave us the least prediction errors. The appendix has the charts for other lookback periods.

Prediction vs. Actual

VIX.prediction.500

Note how in some periods, the predicted value (red) is just the previous value.

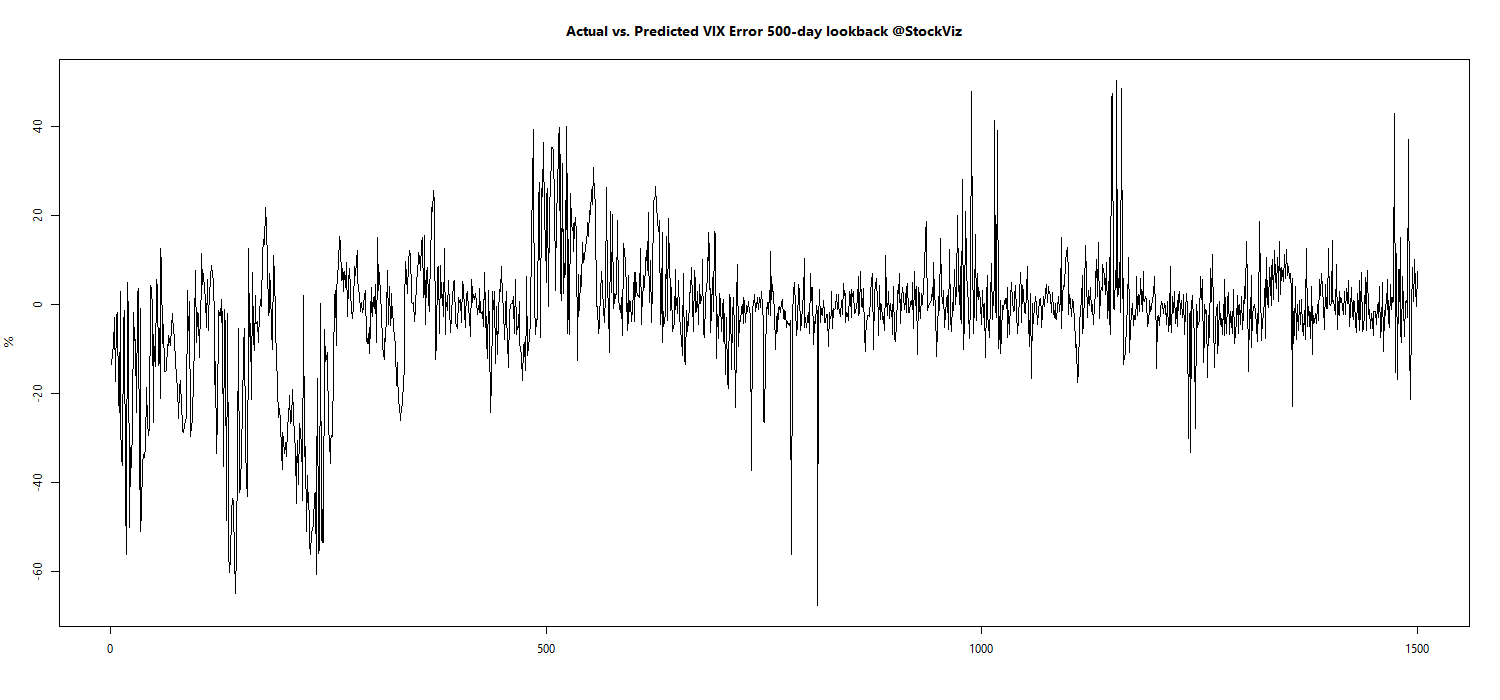
Prediction error

VIX.prediction.pctError.500

Values less than zero implies that the model prediction overshoots the actual VIX level the next day.

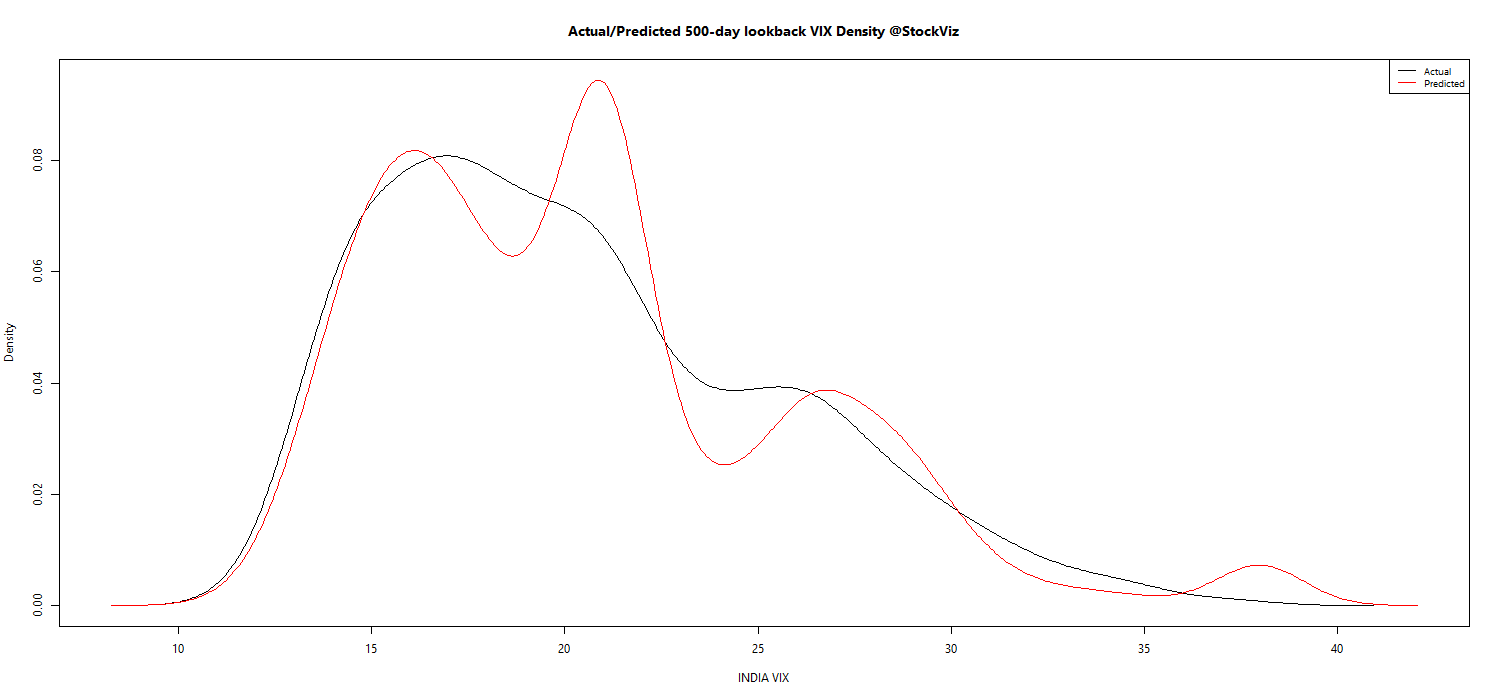
Prediction vs. Actual Density Plot

VIX.prediction.density.500

The model bias towards higher estimation of VIX is made explicit here.

Next steps

We will integrate this model to our morning ‘Options Daily’ posts so that we get an idea of both the current state of VIX and the expected modeled behavior.

Caveats:

  1. The 500-day lookback is purely empirical. Maybe some other look-back period that we have not tested would have been ideal to model. We will never know.
  2. Only the known history can be modeled. The outputs should be used along with market determined proxies of expected volatility.
  3. There is always a probability distribution around a predicted value. We will publish this in our daily posts.

Appendix

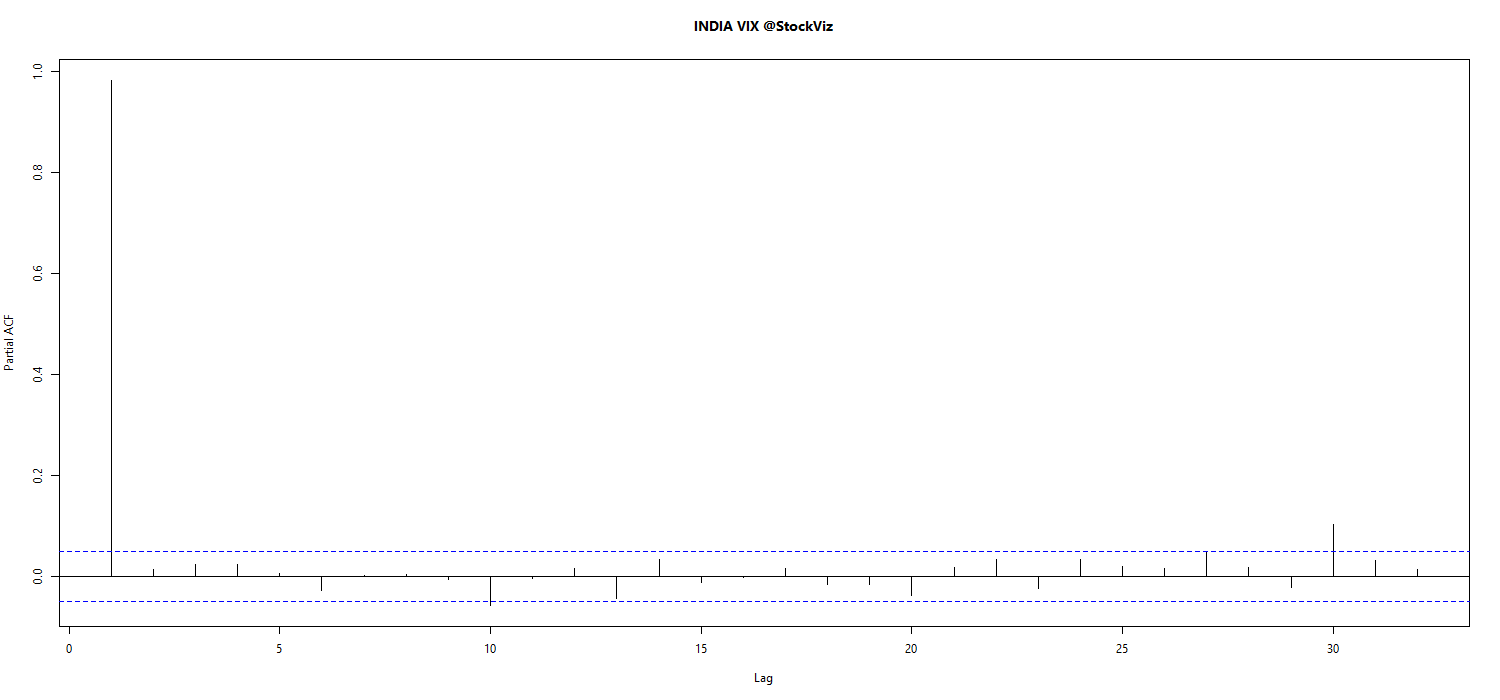
VIX.pacf

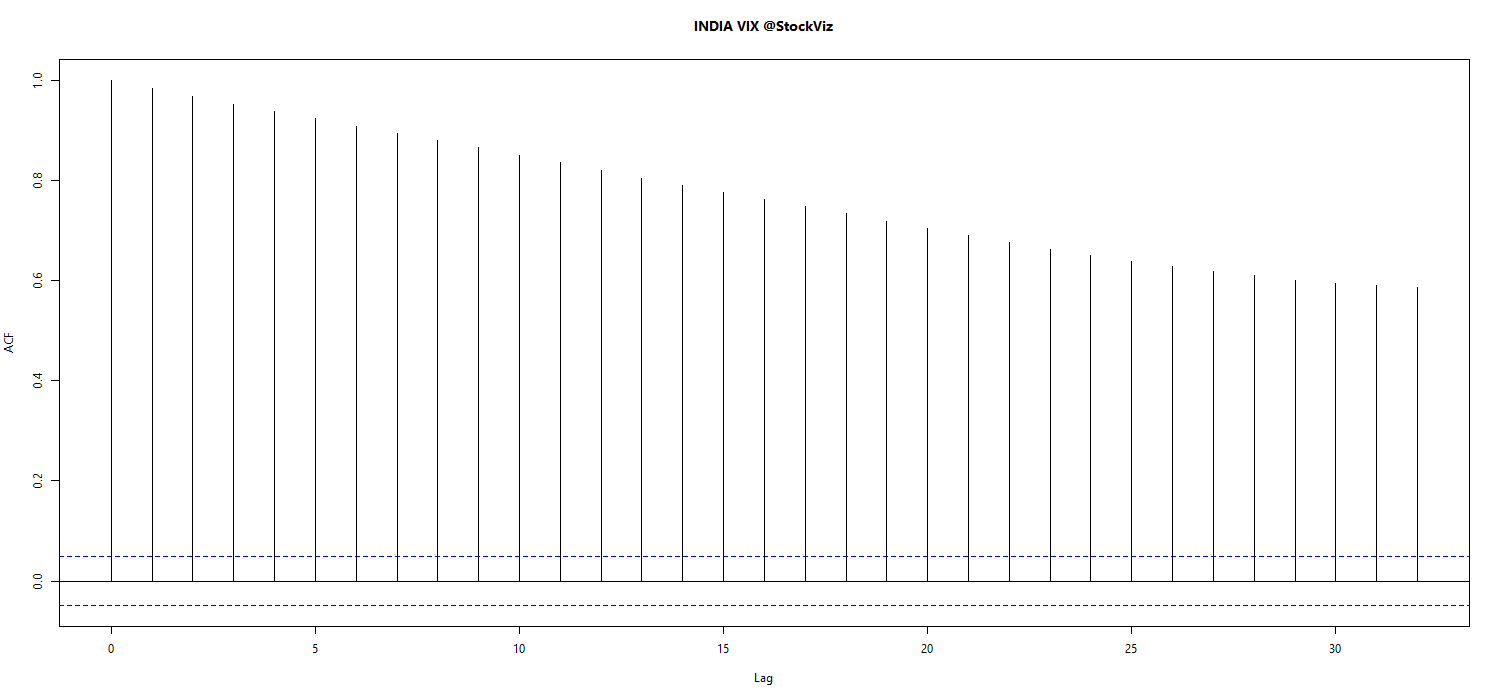
VIX.acf

VIX Model vs. Actual across various lookback periods. (pdf)

quant.stackexchange

Volatility Forecasting I: GARCH Models, Rob Reider (pdf)