This series of posts pulls together two things we observed in our previous posts:
- There is a non-linear relationship between USDINR and the NIFTY (NIFTY vs. INR/OIL Correlation)
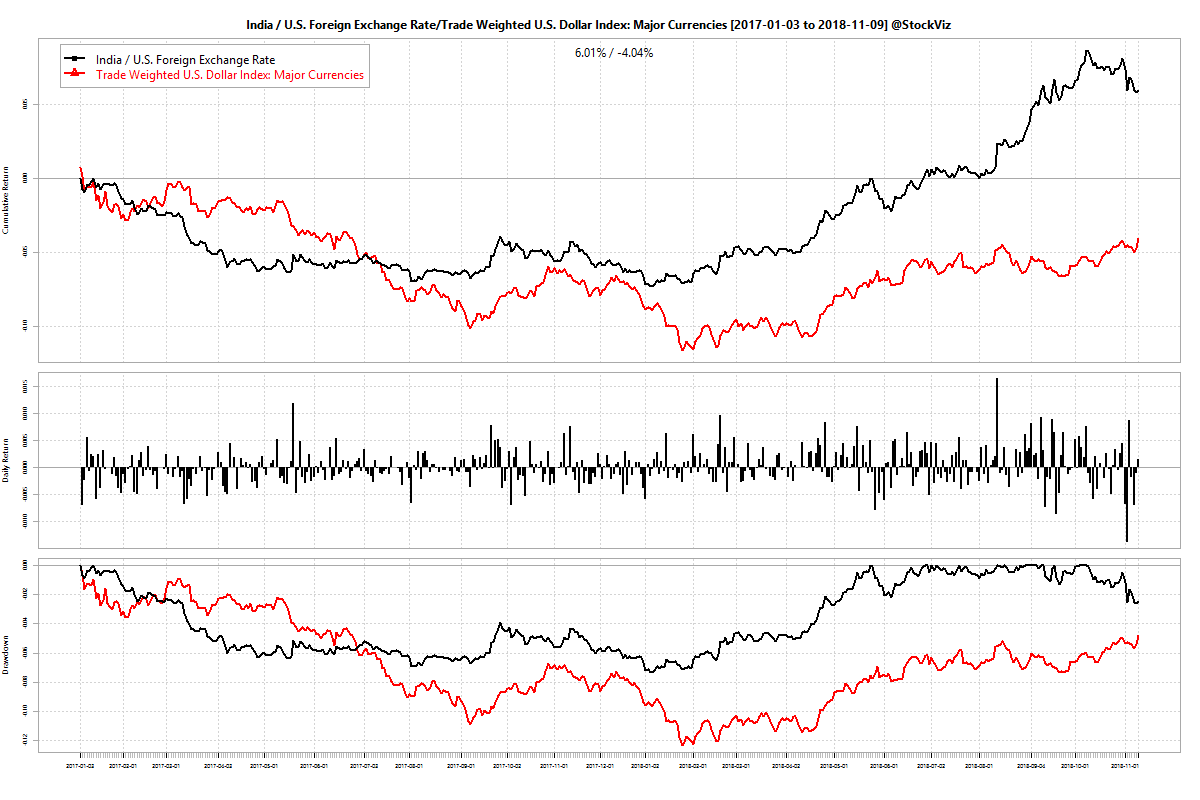
- There is a stable spread between USDINR and currency indices published by the FRED (USDINR and Dollar Indices)
Here, we use a Support Vector Machine (SVM) to train a model on the returns between the DTWEXM index (Trade Weighted U.S. Dollar Index: Major Currencies) and the NIFTY 50.
Outline
- Use 1-, 2-, 5- and 10-week returns of DTWEXM to train an SVM on subsequent 1-week returns of the NIFTY 50
- Consider two datasets: one between the years 2000 and 2018 and the other between 2005 and 2018 to include/exclude the 2008 market dislocation
- Divide the dataset into training/validation/test sets in a 60/20/20 ratio
- Use the validation test to figure out which SVM kernel to use
- Plot the cumulative return of a long-only, long-short and buy&hold NIFTY 50 strategy based on SVM predictions on the test set
- Use the common kernel between the #2 datasets for future experiments
Results
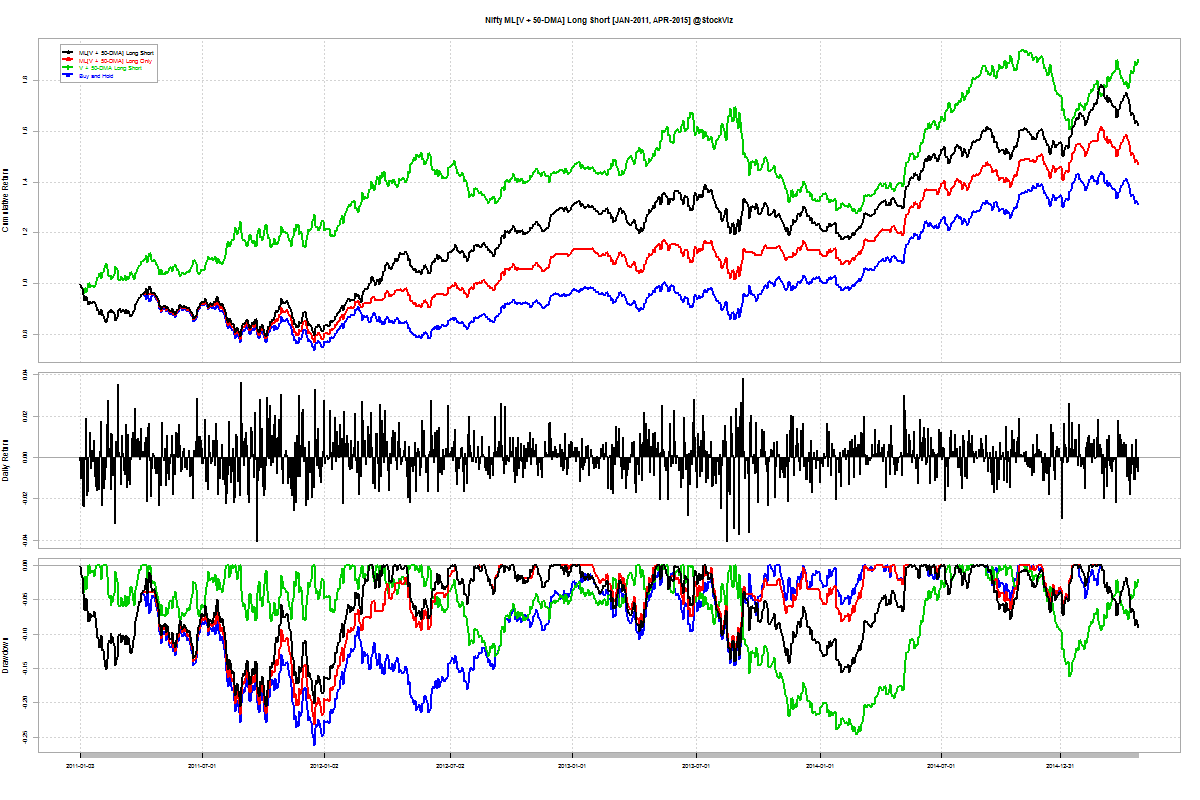
We find that an SVM using a 3rd degree (the default) polynomial kernel gives the “best” results. We use the SVM thus trained to predict next week NIFTY returns and construct long-only and long-short portfolios.
Here are the cumulative returns when the dataset considered is the one between 2000 and 2018. The test set runs from 2015 through 2018:

There are some points of concern. For one, the model is heavily long-biased. Even when the actual returns were negative, the predicted values was mostly positive:

Second, the model has tracked the buy&hold NIFTY since the beginning of 2018. The narrative has been that the rise in oil prices caused the CAD to blow out that caused investors to pull out investments that caused the rupee and NIFTY to fall (whew!) Either USDINR moved independently of DTWEXM or the relationship between DTWEXM and NIFTY 50 broke down. It looks like its the former:
Third, the cumulative returns seem to have been majorly influenced by small set of predictions that cut a drawdown that occurred in July-2015 by half. We notice a similar effect on the smaller dataset (2005 through 2018):

See how a small branch in Nov-2016 lead to the superior returns of the model predicted portfolios.
Next steps
In the next part, we will fiddle around with the degree of the polynomial used in the kernel to see if it leads to better returns. Subsequent posts will cover the use of the other dollar indices (DTWEXB and DTWEXO) and finally USDINR (DEXINUS) itself.
Code and charts for this post are on github