We created a compilation of previous posts on StockViz for you on the psychology of technical analysis.
Hope it helps! [scribd id=62075096 key=key-vo5wkdqz59lq3bjtgqq mode=list width=600]
Invest Without Emotions
We created a compilation of previous posts on StockViz for you on the psychology of technical analysis.
Hope it helps! [scribd id=62075096 key=key-vo5wkdqz59lq3bjtgqq mode=list width=600]
 The greatest constraint on taking the right action in any market is doubt.
Volume is a direct measure of the amount of activity taking place in the market. Open interest is a cumulative measure of the unclosed bull positions in a particular futures market.
The level of Volume: The level of volume is indicative of people’s willingness to trade and reflects their attitudes to the market. A low level of volume indicates an unwillingness to open new positions and close old ones and reflects uncertainty about the future direction of the market. On the other hand, a high level of volume indicates a high degree of confidence in the future direction of the market.
The level of Open Interest: The level of OI is indicative of the liquidity of the market. if OI is low, then there are very few profits to be taken or bad positions to be closed. At low levels of OI, the market is illiquid and a new trade is likely to move the market.
Sudden changes in Volume and Open Interest: A sudden change in volume or OI is indicative of a change in the price-sentiment relationship.
Direction of change in Volume and Open Interest: Rising volume suggest a growing awareness of a higher-level trend and rising OI indicates a growing commitment to that trend. Falling volume indicates the unwillingness to pursue the immediate trend and falling OI suggests some reversal of sentiment.
A re-test is considered successful if prices move into new territory. If volume and OI do not rise into high ground, then a non-confirmation takes place and an important trend reversal is about to emerge (doubly true if OI falls as well). If both volume and OI fall as prices move into new territory, then the following price reversal could be quite dramatic. Falling OI, especially with higher volume, portends a sharp reversal in prices.
A momentum index is a measure of the speed of change of the market. It can be a
The biggest draw-back of momentum indices is that non-confirmation only generates a signal when prices themselves actually start to reverse.
The A/D index is a simple ratio of the number of stocks that have advanced to the number of stocks that have declined. It acts as a proxy for the internal strength of the market. Hence, if a market price index moves into new ground but the A/D doesn’t follow suit, then the life expectancy of the movement may be limited and a severe setback may ensue.
This is one of a series of posts reviewing The Psychology of Technical Analysis by Tony Plummer.

 The Elliot Wave Principal: Stock market averages rise in 5 ‘waves’ and fall in 3 ‘waves’
The Elliot Wave Principal (EWP) has a strong following amongst technical traders. However, nobody, including Elliot himself, has been able to explain why it works and remains an extraordinarily complex system to apply.
EWP applies to all degrees of price movements. In a 5-3 bull/bear cycle, the first 5 waves themselves are composed of smaller 5-3 bull/bear cycles, etc. So each 5-3 cycle is actually part of a larger, higher-degree cycle.

The emergence of a 5-wave impulse pattern, either upwards or downwards, indicates the direction of the long-term trend. A rising 5-wave pattern after a sharp fall would indicate further rises, while a falling 5-wave pattern after a sharp rise would indicate further loses.
Within each 5-wave movement:
Within each 3-wave movement:
There are some variations that exist
Combined with the variations, the EWP covers the complete catalogue of price movements.
This is one of a series of posts reviewing The Psychology of Technical Analysis by Tony Plummer.

There are three categories of price patterns that yield profitable signals.
This signal is given when the market price level penetrates the extension of a straight line drawn through successive troughs (in a rising market) or successive peaks (in a falling market).


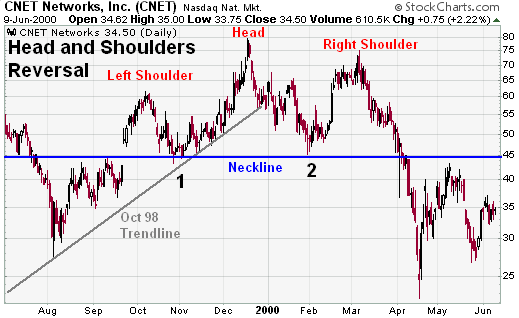 The H&S formation is similar in shape to a silhouette of a person’s head and shoulders. In the case of a top formation, the ‘left shoulder’ is formed by the period of price weakness just prior to the market moving to a new high; the ‘head’ is formed by the new high itself; and the ‘right shoulder’ is formed by a period of price strength just after the new height. The base of both the left and right shoulder occur at roughly the same price levels – you can draw a ‘neckline’ between the two. A sell signal is generated when prices penetrate the neckline.

A trading signal is generated when the price bounces away from a particular level at least twice. At market peaks, such a pattern is called the double top.
This is one of a series of posts reviewing The Psychology of Technical Analysis by Tony Plummer.

 Financial markets exhibit crowd behaviour. A crowd is a dynamic system. A dynamic system can be expressed as a system of spirals. Hence, it follows that if we can identify the presence of an unstable cycle in price movements, we should be able to calculate the precise price targets. The life cycle of a positive shock goes something like this: the initial market reaction that establishes a new trend or the resumption of an old one, a reversal under a spiral mechanism and finally, a jump in a dynamic move. The final jump is 2.618 (the Golden Ratio) times the length of the last wave of the base pattern that precedes it.
The actual shape of a price pulse will be distorted by higher-order trends. However, in practice, any price movement subdivides into there phases: the first two phases constitute either a top or base pattern. The third phase consists of a dynamic impulse wave. Subsidiary fluctuations occur because this three-wave pattern is repeated at all levels of the hierarchy.
This is one of a series of posts reviewing The Psychology of Technical Analysis by Tony Plummer.
