There are three categories of price patterns that yield profitable signals.
Trend-line break
This signal is given when the market price level penetrates the extension of a straight line drawn through successive troughs (in a rising market) or successive peaks (in a falling market).


Head and Shoulders
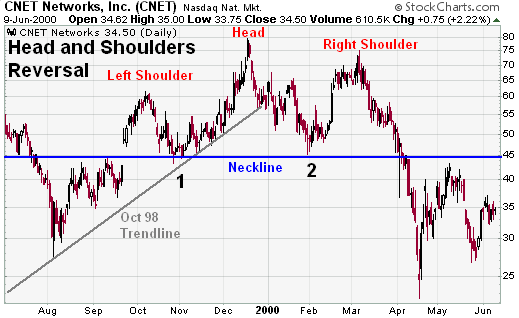 The H&S formation is similar in shape to a silhouette of a person’s head and shoulders. In the case of a top formation, the ‘left shoulder’ is formed by the period of price weakness just prior to the market moving to a new high; the ‘head’ is formed by the new high itself; and the ‘right shoulder’ is formed by a period of price strength just after the new height. The base of both the left and right shoulder occur at roughly the same price levels – you can draw a ‘neckline’ between the two. A sell signal is generated when prices penetrate the neckline.
Multiple top/bottom

A trading signal is generated when the price bounces away from a particular level at least twice. At market peaks, such a pattern is called the double top.
This is one of a series of posts reviewing The Psychology of Technical Analysis by Tony Plummer.
