Tag: pair trading

Finding Pairs to Trade

Correlation

When we discussed banks and introduced pair trading, we pointed out that a pairs trading strategy involves answering these questions:

  1. How do you identify “stocks that move together?”
  2. Should they be in the same industry?
  3. How far should they have to diverge before you enter the trade?
  4. When is a position unwound?

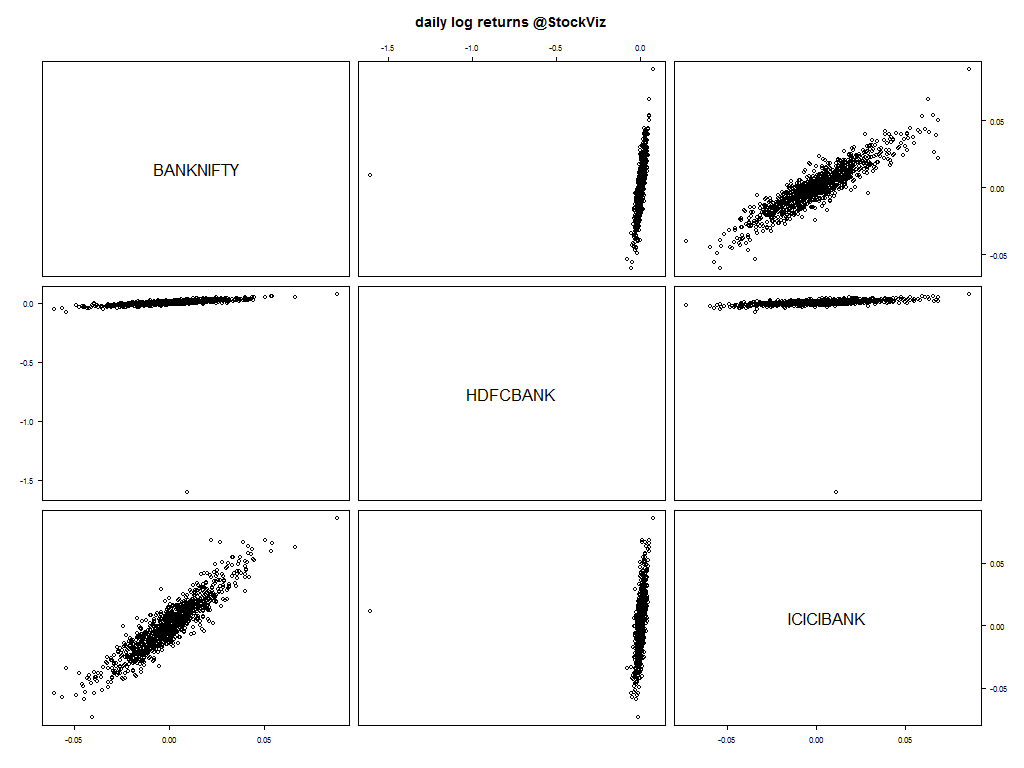
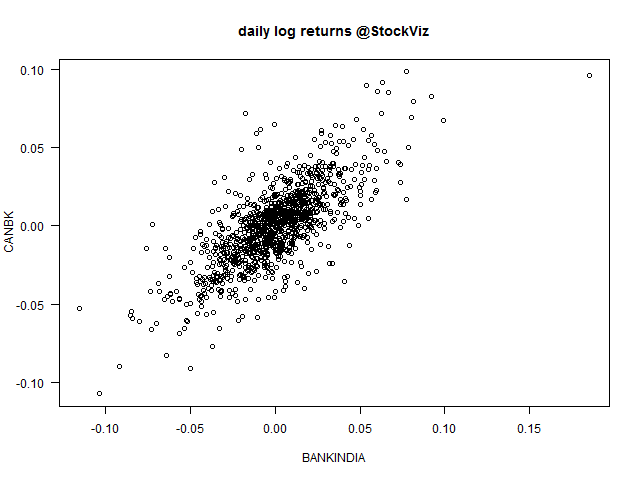
Traders new to pair trading often mistake the correlation of prices to be indicative of “similarity”. For example, consider the Bank Nifty, HDFC Bank and ICICI bank. Here’s the chart of the closing price of the nearest to expiration futures contract:

bank-futures-prices

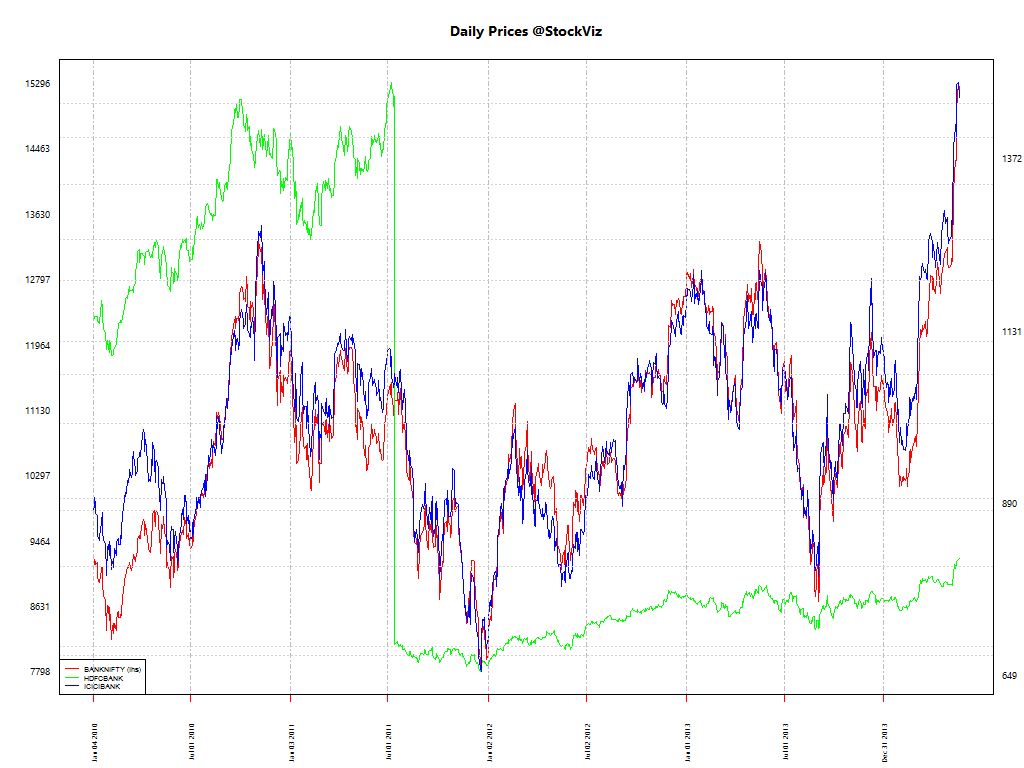
And there are some really tight correlations:

BANKNIFTY HDFCBANK ICICIBANK
BANKNIFTY 1.0000000 0.7419966 0.9462238
HDFCBANK 0.7419966 1.0000000 0.8327847
ICICIBANK 0.9462238 0.8327847 1.0000000

However, this is only part of the story. What we need are pairs who’s price movements are mean reverting. Looking at price correlation alone is not enough.
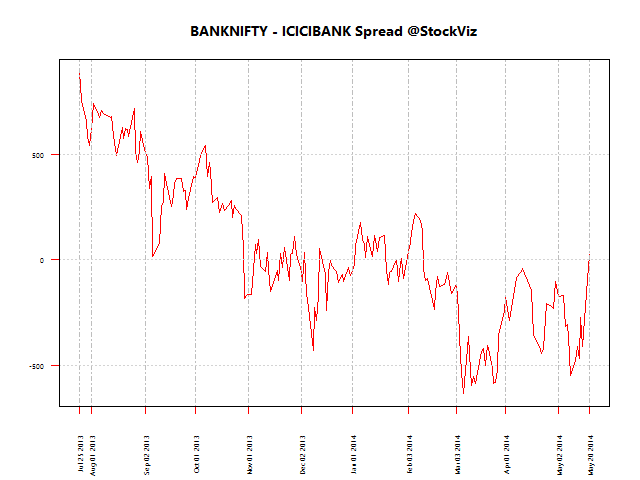
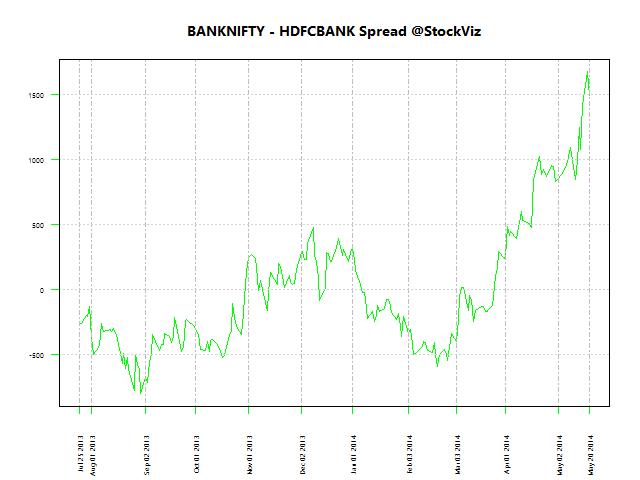
Spreads

We need the spread between pairs to be “stable”, i.e., mean reverting.

spread = A – βB

where A and B are prices and β is the first regression coefficient.
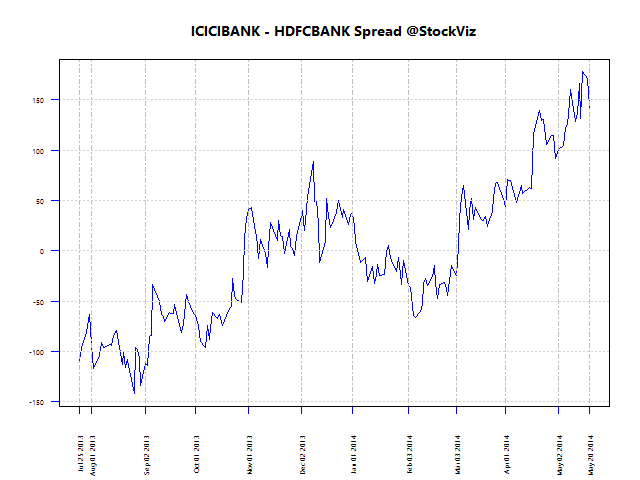
200-day spreads

Here are the spreads between these pairs using 200-day data for regression:
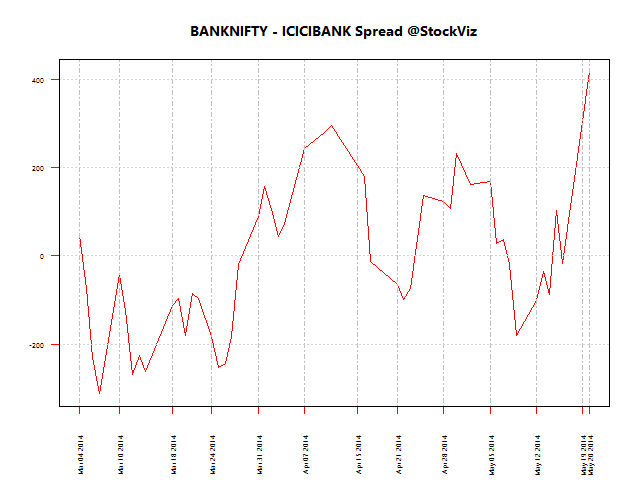
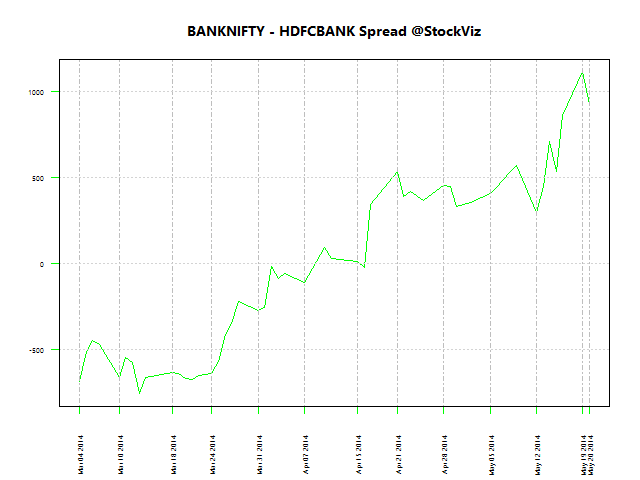
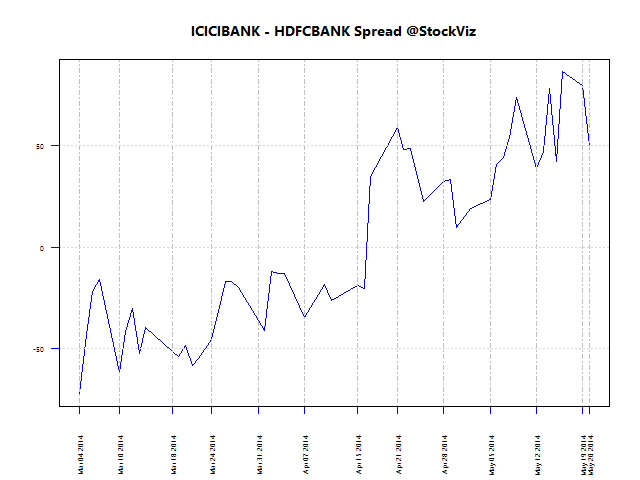
BANKNIFTY - ICICIBANK Spread 200

BANKNIFTY - HDFCBANK Spread 200

ICICIBANK - HDFCBANK Spread 200

50-day spreads

Here are the spreads between these pairs using 50-day data for regression:

BANKNIFTY - ICICIBANK Spread 50

BANKNIFTY - HDFCBANK Spread 50

ICICIBANK - HDFCBANK Spread 50

Testing for cointegration

You don’t have to visually inspect spreads to see if they are mean-reverting. The most straightforward way of checking if a time-series is co-integrated is to perform a Dickey-Fuller test on it. If the p-value is less than 0.10, then this could be a good pair for trading.

N Pair p-value
300 BANKNIFTY vs. ICICIBANK 0.010000
300 BANKNIFTY vs. HDFCBANK 0.904480
300 ICICIBANK vs. HDFCBANK 0.407347
200 BANKNIFTY vs. ICICIBANK 0.010000
200 BANKNIFTY vs. HDFCBANK 0.472129
200 ICICIBANK vs. HDFCBANK 0.037115
100 BANKNIFTY vs. ICICIBANK 0.223806
100 BANKNIFTY vs. HDFCBANK 0.980776
100 ICICIBANK vs. HDFCBANK 0.670717
50 BANKNIFTY vs. ICICIBANK 0.429057
50 BANKNIFTY vs. HDFCBANK 0.405498
50 ICICIBANK vs. HDFCBANK 0.133357
30 BANKNIFTY vs. ICICIBANK 0.570427
30 BANKNIFTY vs. HDFCBANK 0.057717
30 ICICIBANK vs. HDFCBANK 0.370011

If you are trading futures, then a 200-day fit may not make much sense. The latest 30-day test between BANKNIFTY and HDFCBANK has a surprisingly low p-value of 0.057, indicating that there is a potential trade there.

To be continued…

Bank Nifty vs. HDFC Bank and ICICI Bank

We recently discussed linear regression by using it to inspect the relationship between two banking stocks. Lets try and extend that treatment to an index and its predominant constituents.

Bank Nifty

The Bank Nifty is composed of 12 bank stocks with ICICIBANK and HDFCBANK making up 29.27% and 28.26% of the index, respectively. Lets start with the scatterplot of daily log returns of the nearest to expiration futures.

bank-futures

Notice the strong relationship between the index and the banks?

Q-Q Plots

ICICIBANK~HDFCBANK-q-q-plot

BANKNIFTY~ICICIBANK-q-q-plot

BANKNIFTY~HDFCBANK-q-q-plot

Index vs. Banks have a predominantly Gaussian distribution. HDFC vs. ICICI – not so much.

Pairs trading

With this knowledge in hand, can we trade pairs made out of these three? The rules for pairs trading is fairly straightforward:

  1. find stocks that move together
  2. take a long–short position when they diverge and unwind on convergence

The execution of a pairs trading strategy involves answering these questions:

  1. How do you identify “stocks that move together?”
  2. Should they be in the same industry?
  3. How far should they have to diverge before you enter the trade?
  4. When is a position unwound?

Bank Nifty, HDFC Bank and ICICI Bank certainly fit the criteria.

Co-integrated prices

If the long and short components fluctuate due to common factors, then the prices of the component portfolios would be co-integrated and the pairs trading strategy should work.

If we have two non-stationary time series X and Y that become stationary when differenced (these are called integrated of order one series, or I(1) series) such that some linear combination of X and Y is stationary (aka, I(0)), then we say that X and Y are cointegrated. In other words, while neither X nor Y alone hovers around a constant value, some combination of them does, so we can think of cointegration as describing a particular kind of long-run equilibrium relationship.

For a light introduction to co-integration, read this post on Quora.

To be continued…

Relationship between a pair of stocks

Linear Regression

The easiest relationship to examine between a pair of stocks is linearity. You can try and fit a linear model through their daily log returns first and then decide further course of action.

Here’s a scatter-plot that shows how Bank of India and Canara Bank could be related to each other.

BANKINDIA-CANBK

Results of linear regression:

Residuals:
      Min        1Q    Median        3Q       Max 
-0.055050 -0.009995  0.000331  0.009440  0.063258 

Coefficients:
              Estimate Std. Error t value Pr(>|t|)    
(Intercept) -0.0002843  0.0006817  -0.417    0.677    
BANKINDIA    0.7451950  0.0232860  32.002   <2e-16 ***
---
Residual standard error: 0.01638 on 575 degrees of freedom
Multiple R-squared:  0.6404,    Adjusted R-squared:  0.6398 
F-statistic:  1024 on 1 and 575 DF,  p-value: < 2.2e-16

After fitting a regression model it is important to determine whether all the necessary model assumptions are valid before performing inference. If there are any violations, subsequent inferential procedures may be invalid resulting in faulty conclusions. Therefore, it is crucial to perform appropriate model diagnostics.

Residuals vs. Fitted

Residuals are estimates of experimental error obtained by subtracting the observed responses from the predicted responses. The predicted response is calculated from the model after all the unknown model parameters have been estimated from the data. Ideally, we should not see any pattern here.

BANKINDIA-CANBK-1

BANKINDIA-CANBK-3

Q-Q Plot of Residuals

The QQ Plot shows fat tails.

QQ plot BANKINDIA-CANBK-2

Residuals vs. Leverage

The leverage of an observation measures its ability to move the regression model all by itself by simply moving in the y-direction. The leverage measures the amount by which the predicted value would change if the observation was shifted one unit in the y-direction. The leverage always takes values between 0 and 1. A point with zero leverage has no effect on the regression model. If a point has leverage equal to 1 the line must follow the point perfectly.

Labeled points on this plot represent cases we may want to investigate as possibly having undue influence on the regression relationship.

BANKINDIA-CANBK-4

Conclusion

A linear model on daily log returns may not be the best way to understand the relationship between the two stocks. We can either change the model (linear) or change the attribute (daily log returns) that we are using.

To be continued…

Source: Model Diagnostics for Regression