Tag: options

Covered Call Strategy Cheat Sheet

Paper from the brain-trust at AQR Capital Management: Covered Calls and Their Unintended Reversal Bet is a must read for anybody trading options.

Simply put, a covered call is when you own the underlying stock and you sell a call on it. If the stock doesn’t go beyond the strike at which you sold the call, then you pocket the premium. Otherwise, your upside on owning the stock is capped at the strike.

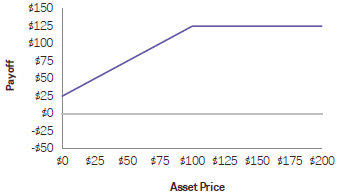
The payoff diagram of a covered call looks like this:

covered call payoff

The authors claim that over a quarter of a covered call’s risk may be attributed to market timing and investors are ignoring its effect on returns.

Because a covered call option strategy reflects an underlying position in equity (delta = 1) and being short a call with changing delta, we get the following situation:

  1. Baseline situation: equity delta = 1.0 and short call position delta = -0.5; net 0.5 delta
  2. In a falling market environment: equity delta = 1.0 and short call position delta = -0.25; net 0.75 delta, or higher market exposure
  3. In a rising market environment: equity delta = 1.0 and short call position delta = -0.75; net 0.25 delta, or lower market exposure

The insight: a covered call strategy embeds elements of a reversal strategy, not a trend-following strategy.

The cheat sheet

  1. Bearish on volatility? Don’t do a covered call.
  2. Bearish on the market? Don’t do a covered call.
  3. Like trend-following? Don’t do a covered call.

Sources

  • Covered Calls and Their Unintended Reversal Bet (pdf)
  • Own the Stock and Sell Calls: Guaranteed Win, Right? (AlphaArchitect)

Beyond Payoff Diagrams

In our previous post, we discussed how you can use a Nifty May 6600/6750 Long Put Spread to express a bearish view. However, the payoff diagram, only shows the P&L at expiry. The underlying can take a completely random path towards that payoff, impacting your daily mark-to-market.

Visualizing θ

One way to visualize it to keep all inputs to the model the same and compute the prices of the the options at different price points. Additionally, you can also plot historical values of your spread to give you an idea of where they are at.

NIFTY 6600-6750 Long Put Spread

Note: y-axis is not P&L

As you can see, its only at the very end of the spread’s life that its model value gets pulled towards the values shown in the payoff diagram. This is largely due to θ-decay.

Takeaways

If you are in-the-money on your spreads, then it makes sense to keep the position open till expiry. Most of the gains are accrued at the fag-end of the term.

What if: abki baar NO modi sarkar?

What if Modi fails to become the prime minister of India? Some are expecting the Nifty to crack by 1000 points in such a scenario. Although not a perfect hedge, a bear spread makes sense – think of it as insuring your portfolio against the adverse outcome.

NIFTY May 6600/6750 Long Put Spread

NIFTY May 6600-6750 Long Put Spread

The Nifty will have to expire below 6695.00 for the trade to be profitable. The max profit is Rs. 4750.00 and the cost to enter the trade (and max loss) is Rs. 2750.00.

NIFTY May 6600-6750 Long Put Spread payoff
NIFTY May 6600-6750 Long Put Spread PL

Thought process

This trade can be best described as buying a limited form of insurance. You are assuming that the Nifty will not fall too far below 6600 and losses are not going to be catastrophic. You could go farther down the option chain if you are feeling too nervous, but then your δs will get smaller so you will have to buy more spreads to cover your portfolio.

For example, if you did a NIFTY May 6500/6600 Long Put Spread instead, you will be moving the break-even to 6569.70, pay less (Rs. 1515.00) for a max profit of Rs. 3485.00. But the delta of this spread is -0.08 vs. -0.15 for spread described above.

Exiting the trade

The result of this election is expected to be declared on 16 May (Friday). Exit soon after election results are announced or right before it if the trade is profitable.

Read more about options: Options Trading Guide