Tag: macro

Macro: NIFTY vs. INR/OIL Correlation, Part I

We have all come across these type of headlines recently:
Sensex, Nifty fall further on surging crude oil prices (LiveMint)
Sensex, Nifty drop on fresh spurt in oil price, fall in rupee (ET)
But what exactly is the correlation between the NIFTY, USDINR and OIL?

Macro Caveats

A host of factors affect the prices of a widely tracked benchmark index like the NIFTY. Some of which are intrinsic (valuation, for example) and some that are external (capital flows, for example.) There relationships are dynamic – they keep changing over time.

Also, macro variables usually have a time-alignment problem. For example, the closing-prices of the NIFTY don’t align with the closing prices of, say, the NASDAQ. So to analyze the NIFTY and NASDAQ together, the time-series need to be shifted. And, perhaps, NASDAQ futures being traded at NIFTY close should be considered instead.

Comparing commodity and currency time-series with equity time-series has another problem. The former trades 24/7 in a global marketplace whereas equities predominantly trade in the local time-zone. So “closing” prices for commodities and currencies are hard to pin down at a granular level across markets. One way to tide over this issue is by using a weekly or monthly time-series instead of a daily one.

Time-periods

For the longest time, Indian markets were insulated from global capital flows. It is only recently that we have opened up both or economy and our markets. Currency futures started trading only in 2008 and the RBI still tries to “guide” the exchange rate. With these in mind, lets run the correlation between the NIFTY 50, USDINR and OIL weekly return time-series with NIFTY 50 lagged by on time-period.

NIFTY50.INR.OIL correlations

Data from 1995 through 2018 shows only a small correlation between NIFTY and INR. However, like we mentioned above, Indian markets now are more open than what they were before. So, if you run the same correlations on a smaller dataset – year 2010 through 2018 – we can see an uptick in the NIFTY-INR correlation.

NIFTY50.INR.OIL correlations

Take-away

It appears that the NIFTY has a closer relationship with INR than with OIL prices. In Part II of this thread, we will check if we can build a linear model that can capture this relationship. Stay tuned.

Code and charts are on github.

Introducing the Global Macro Dashboard

It is all local until it is not

World markets just witnessed a spiraling sell-off that caught most investors off-guard. The problem is that for most of the time, markets are local. Except for those times when they aren’t and correlations go to 1.

We tried singling out different factors to check if they could act as leading indicators of market sell-offs:

It is not one thing and it is never the same thing

The problem is that, statistically, no one global indicator is going to be a perfect canary in the coal mine. However, once the number of “meaningful” events crosses a threshold, correlations tend to 1.

But what exactly defines “meaningful?” Is it 1-sigma or 2-sigma? Should it be change in price or price itself? What should be the number of periods over which these statistics are calculated? The answers to these questions are going to take a while to figure out. In the meantime, we decided to create a dashboard that lets investors choose some of these filters.

You can play with our Global Macro Dashboard here: StockViz/GlobalDashboard

Welcome to glocal markets.

Macro Update July 2015

US TREASURIES VS. GILT SPREAD

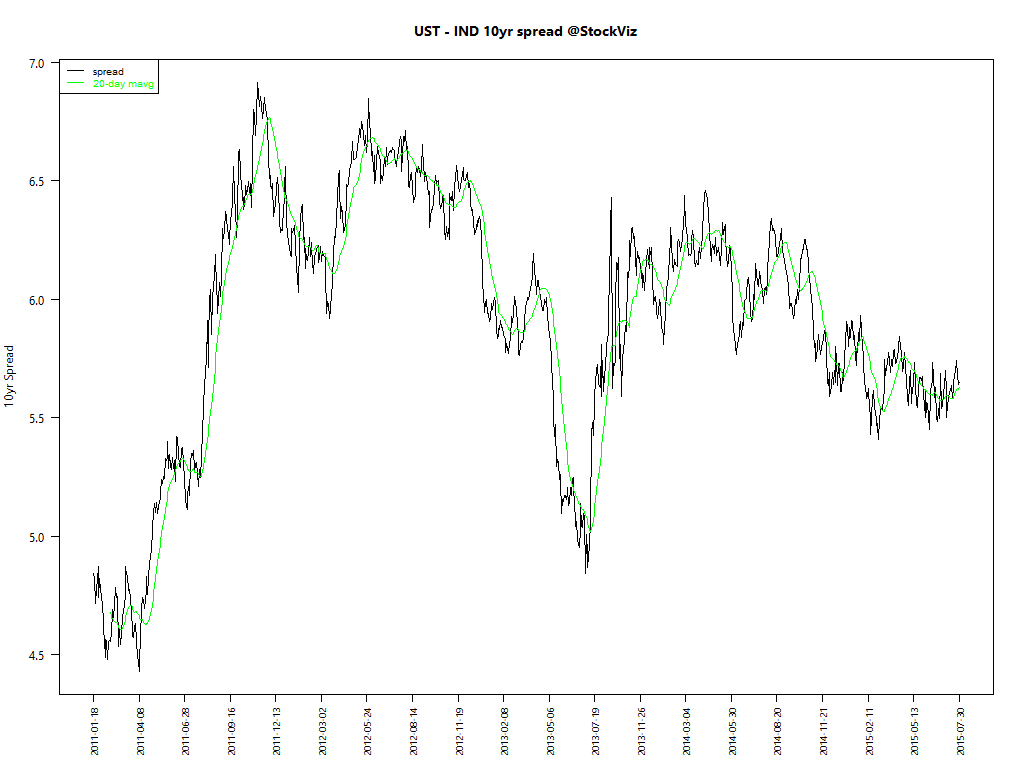
The spread between 10yr US Treasuries and Indian Gilts remained within a tight range this month.

ust-ind-10yr-spread.2011-01-18

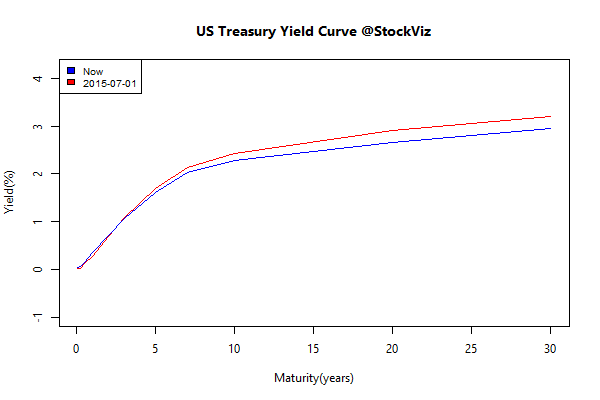
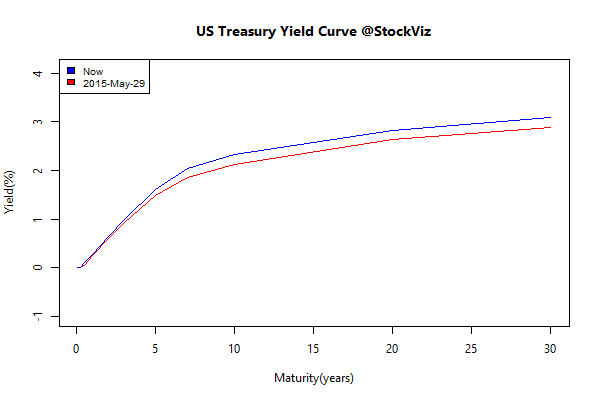
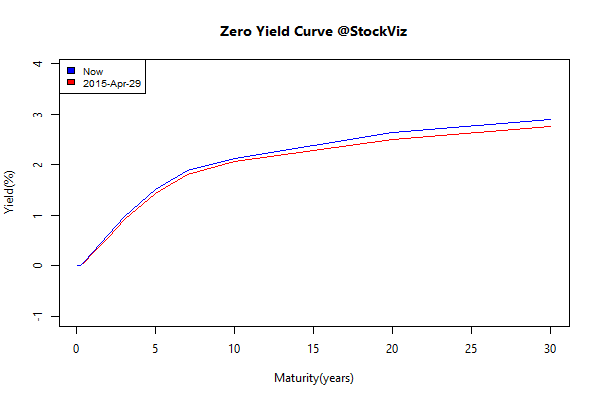
Long term US Treasury yields compressed.

ust-yield-curve.2015-06-30

Institutional investments

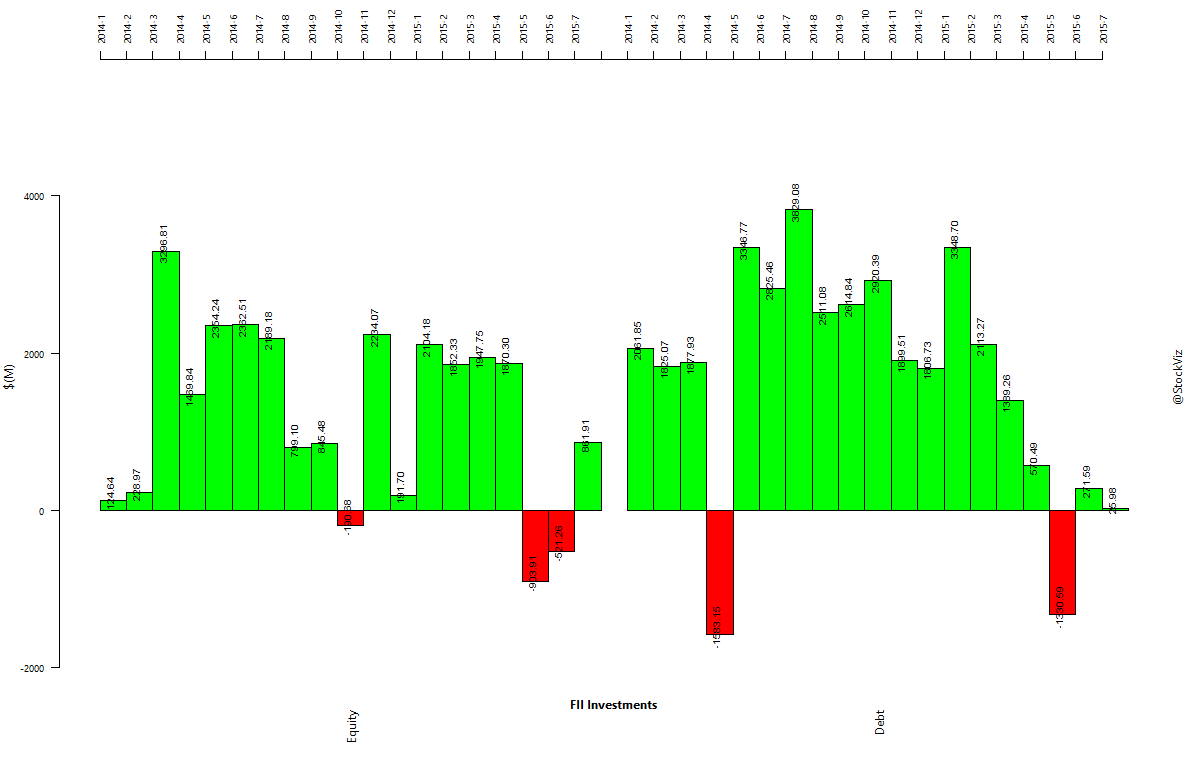
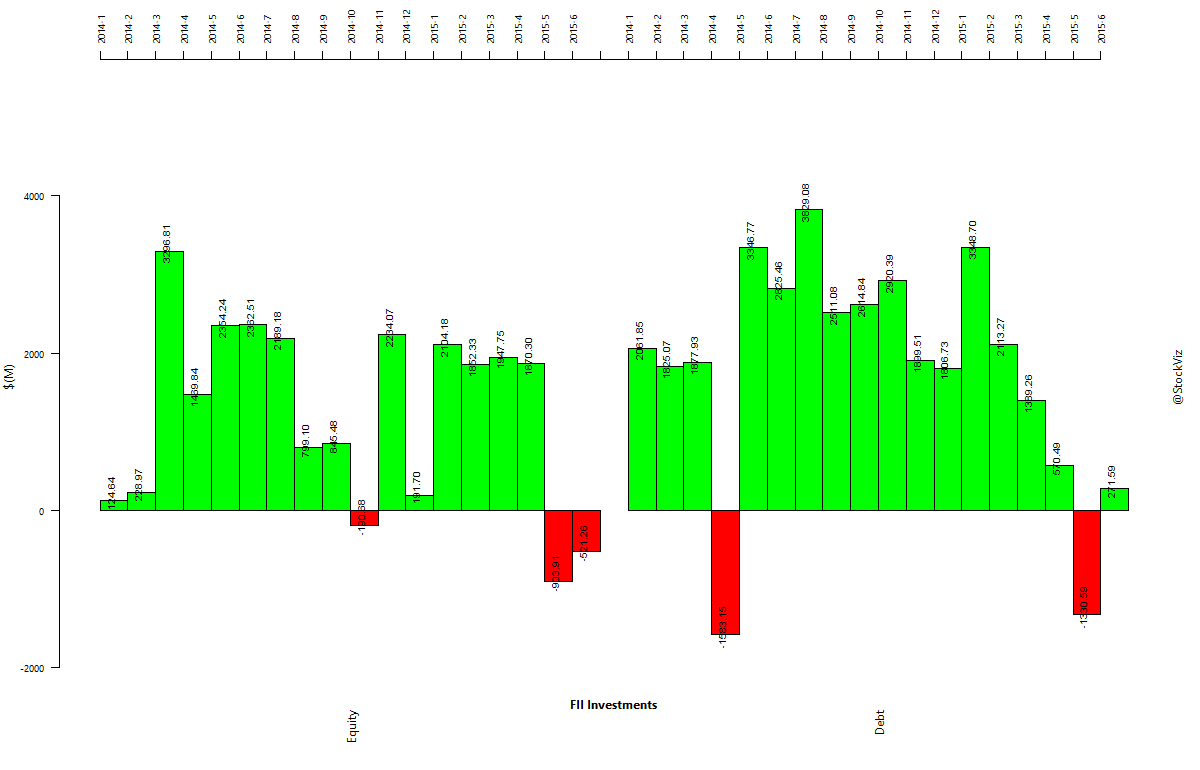
FIIs were net buyers in July. A welcome relief after June’s selloff.

fii-investments.2014-01-01.2015-07-31

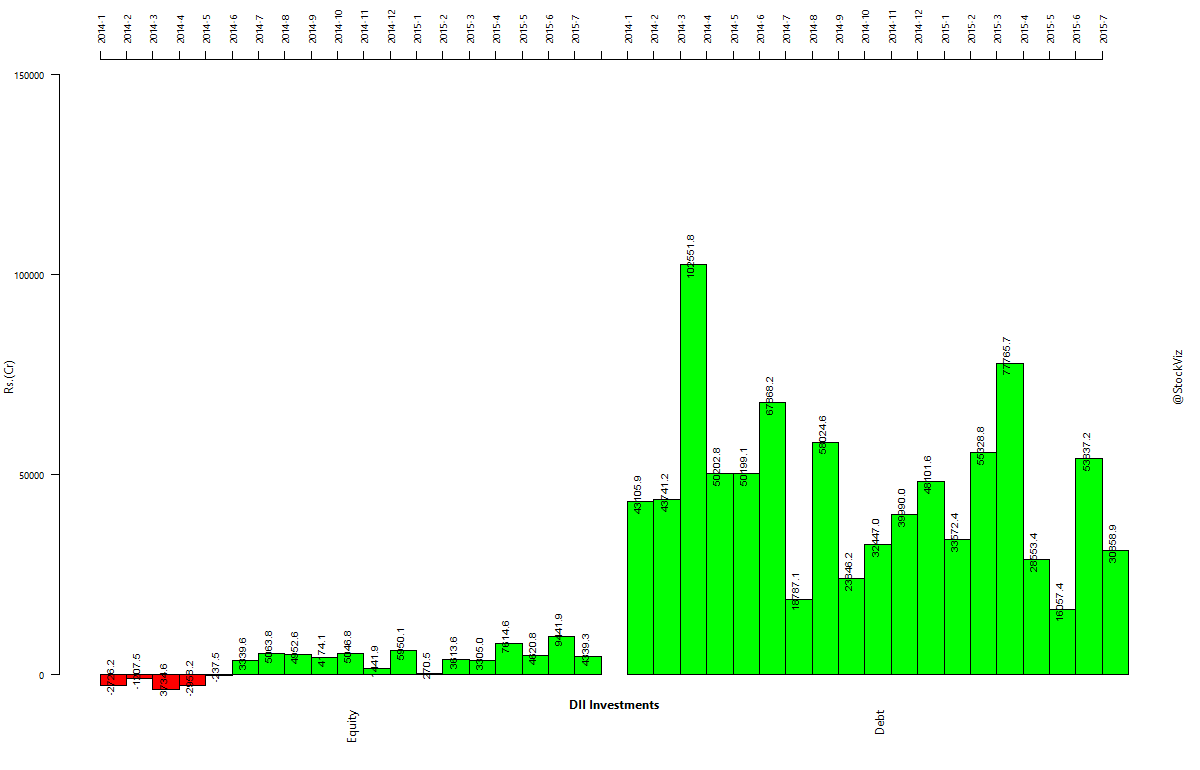
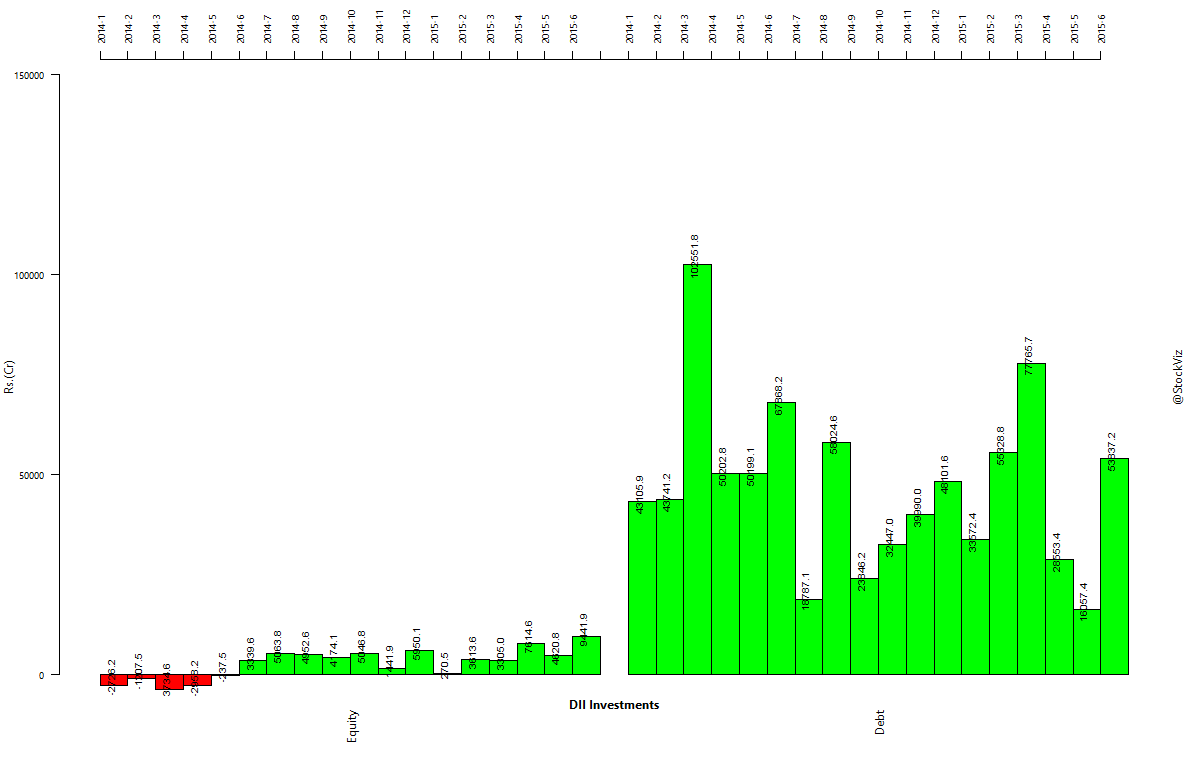
DIIs joined the bandwagon as well.

dii-investments.2014-01-01.2015-07-31

Oil

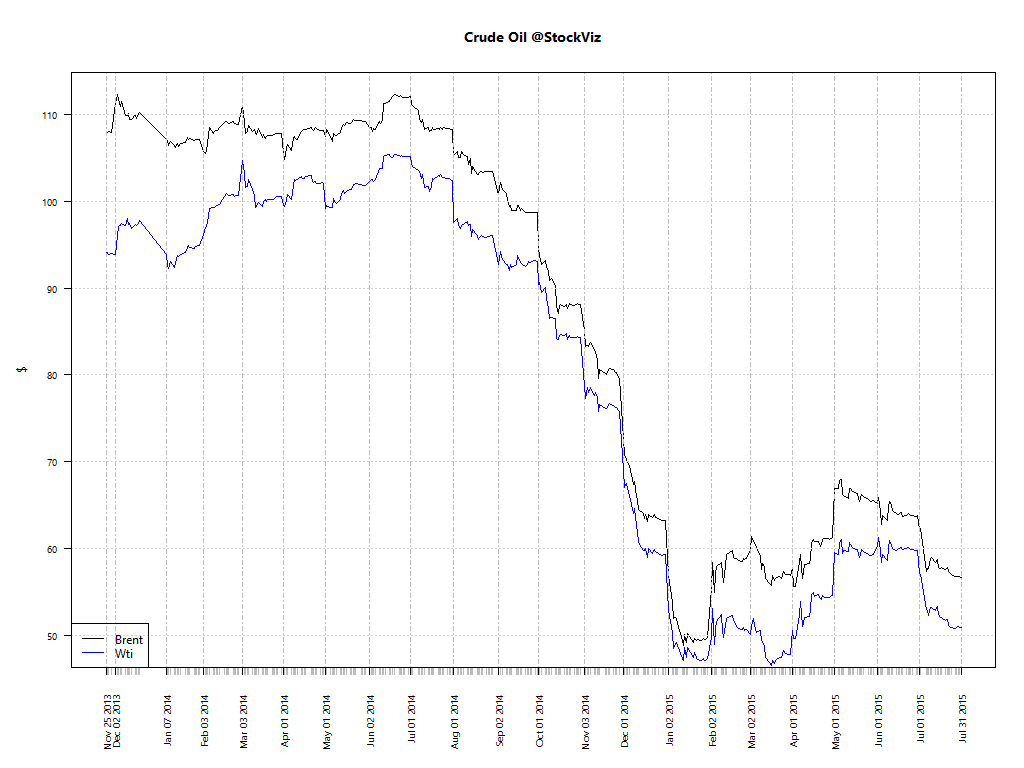
Oil got shellacked.

wti-brent.2011-01-18

Gold

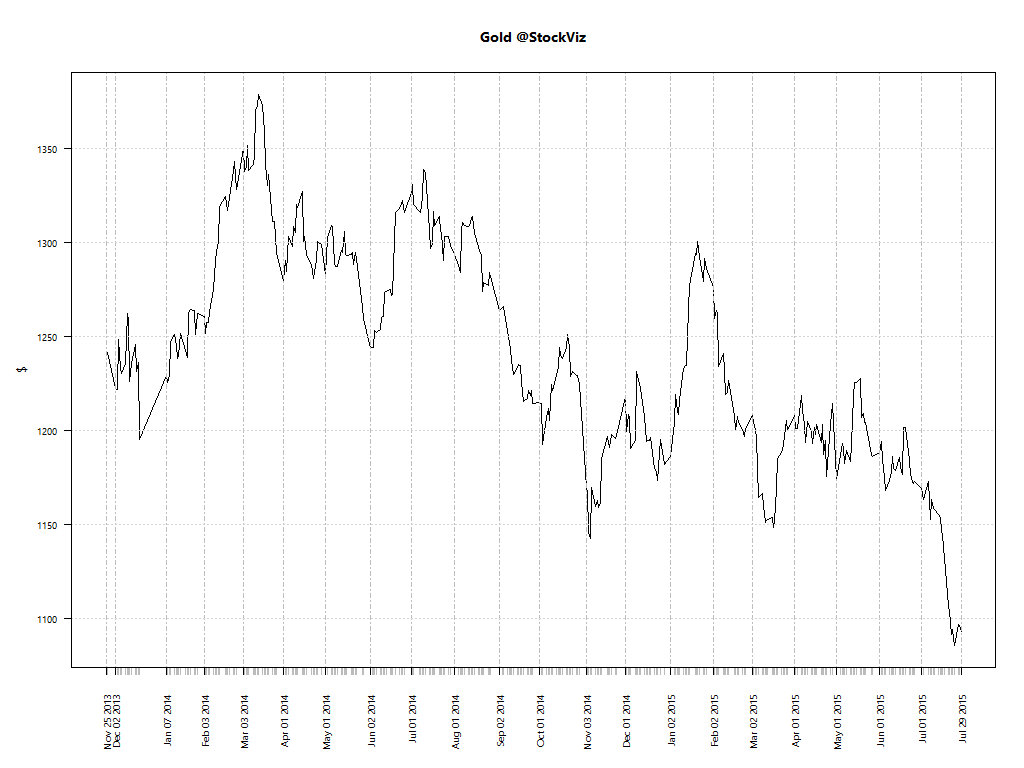
Gold got shellacked too.

gold.usd

Copper

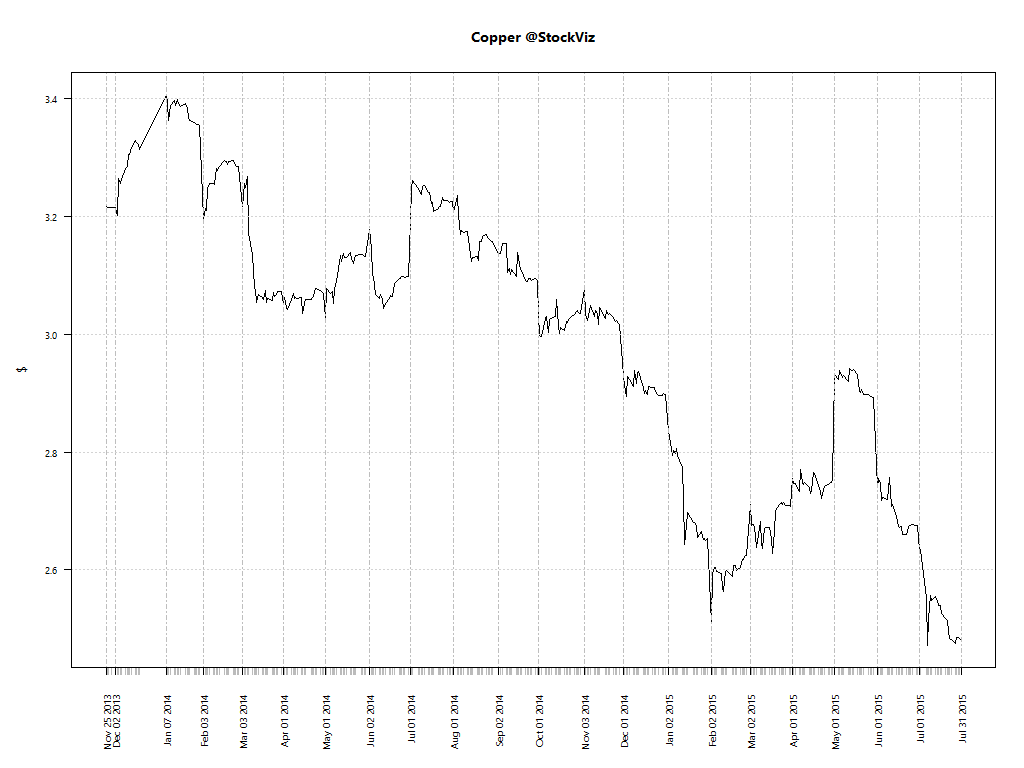
Copper got shellacked three.

copper.usd

US Dollar

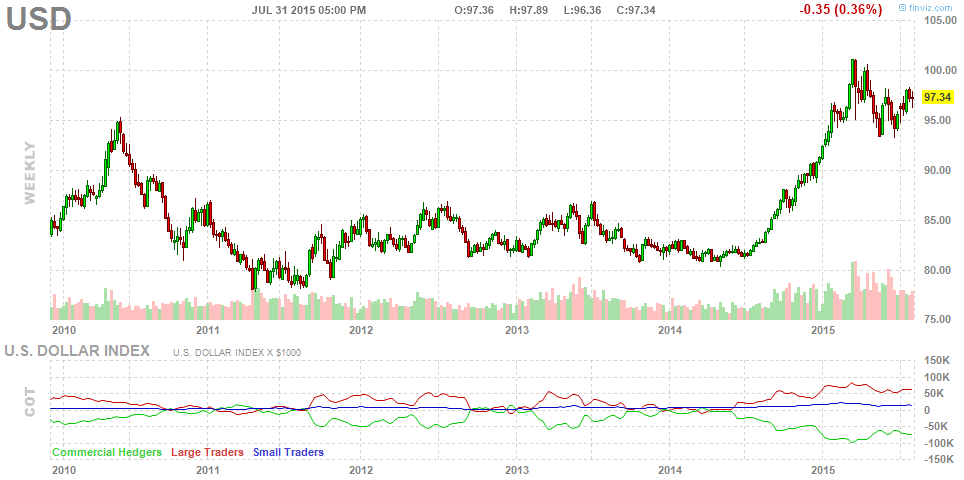
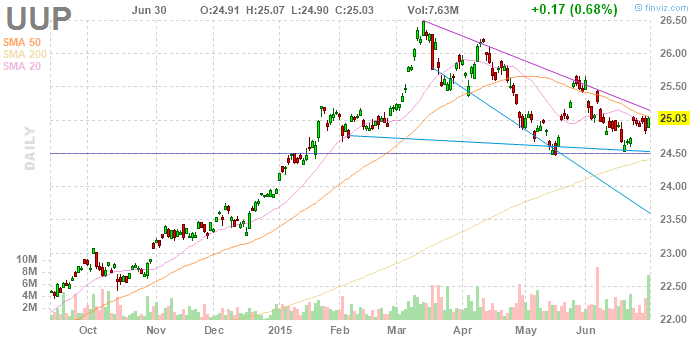
Here is the rally in US Dollar charted:

usd_fut_chart

Outlook

The fall in commodity prices should be a huge windfall for the Indian economy. However, the pace of reforms have come below expectations. The Monsoon Session of the parliament has been a disappointing mess. This has resulted in extended valuations in quality stocks. With a US rate-hike expected in September, we may see a bit of a wobble that might prove to be an excellent time to “buy the dip.”

Macro Update June 2015

US TREASURIES VS. GILT SPREAD

The spread between 10yr US Treasuries and Indian Gilts remained within a tight range this month.

ust-ind-10yr-spread.2011-01-18

Long-term bond yields continued their ascent:

ust-yield-curve.2015-06-01

INSTITUTIONAL INVESTMENTS

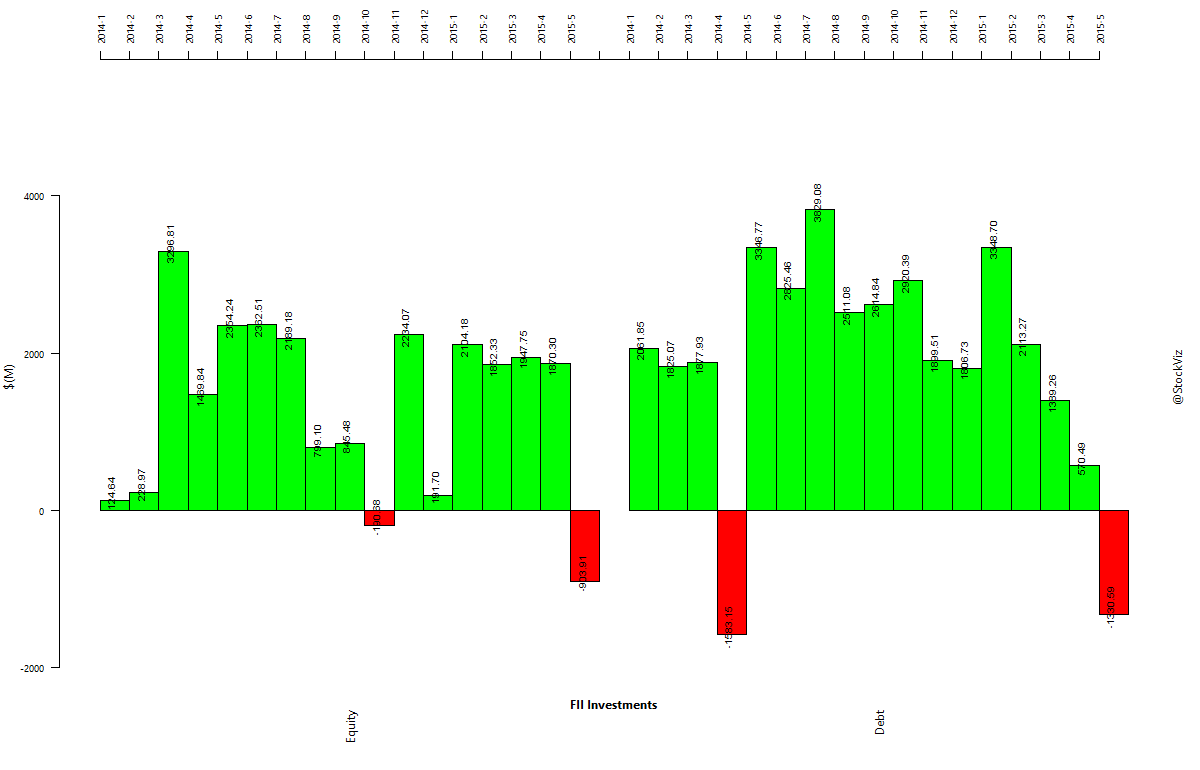
FIIs came back to the debt market but took money out of equities…

fii-investments.2014-01-01.2015-06-30

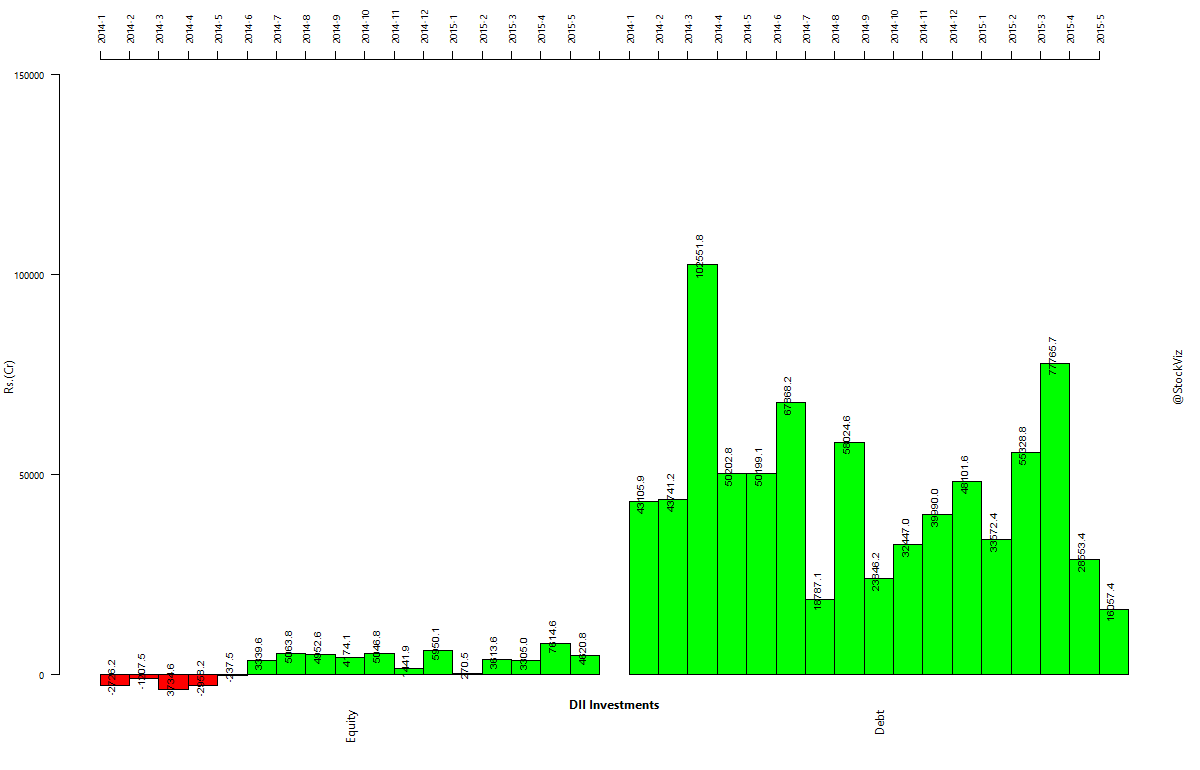
… while DIIs gulped down debt as well.

dii-investments.2014-01-01.2015-06-30

Oil

Oil futures remained flat.

wti-brent.2011-01-18

Gold

If all the uncertainties cannot move gold up, I am not sure what will.

gold.usd

Copper

After a brief period of enthusiasm, it looks like copper has given up on industrial growth again.

copper.usd

Dollar Index

Looks like the dollar index (DXY) has found a range.

Outlook

Although the Indian markets have shrugged off Grexit for now, nobody really knows the extent to which the contagion can spread. It’s basically a known unknown at this point.

With the monsoon expected to be normal and earnings to begin in earnest only by the end of July, the first couple of weeks of July is going to be driven by optimism.

Macro Update: Mayhem 2015

US TREASURIES VS. GILT SPREAD

The spread between 10yr US Treasuries and Indian Gilts remained within a tight range this month.

ust-ind-10yr-spread.2011-01-18

Long-term US bond yields leapt higher in May…

ust-yield-curve.2011-01-18

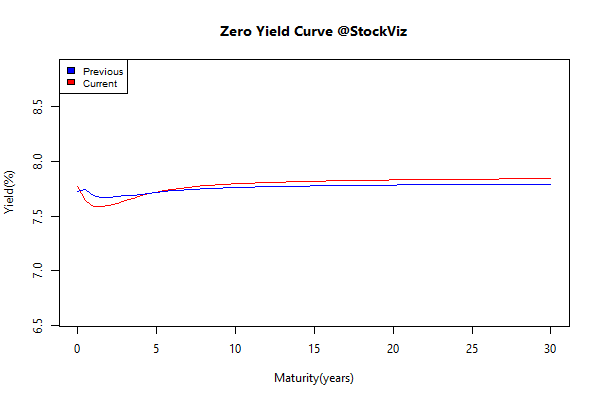
… and the spread was kept in check by Indian gilts moving in tandem.

INSTITUTIONAL INVESTMENTS

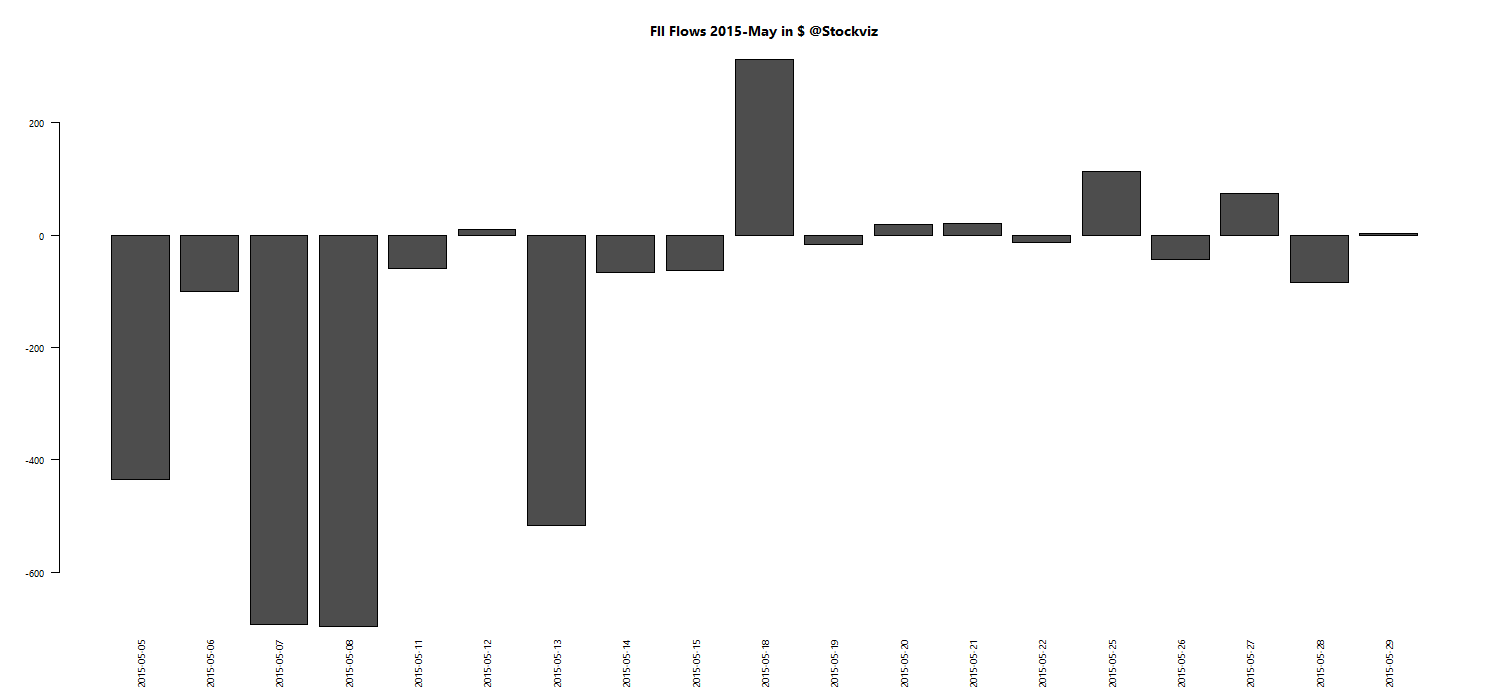
FPIs took an asston of money out of Indian markets because of regressive and retrograde tax demands. Huge outflows both in equity and bond markets.

fii-investments.2014-01-01.2015-05-30

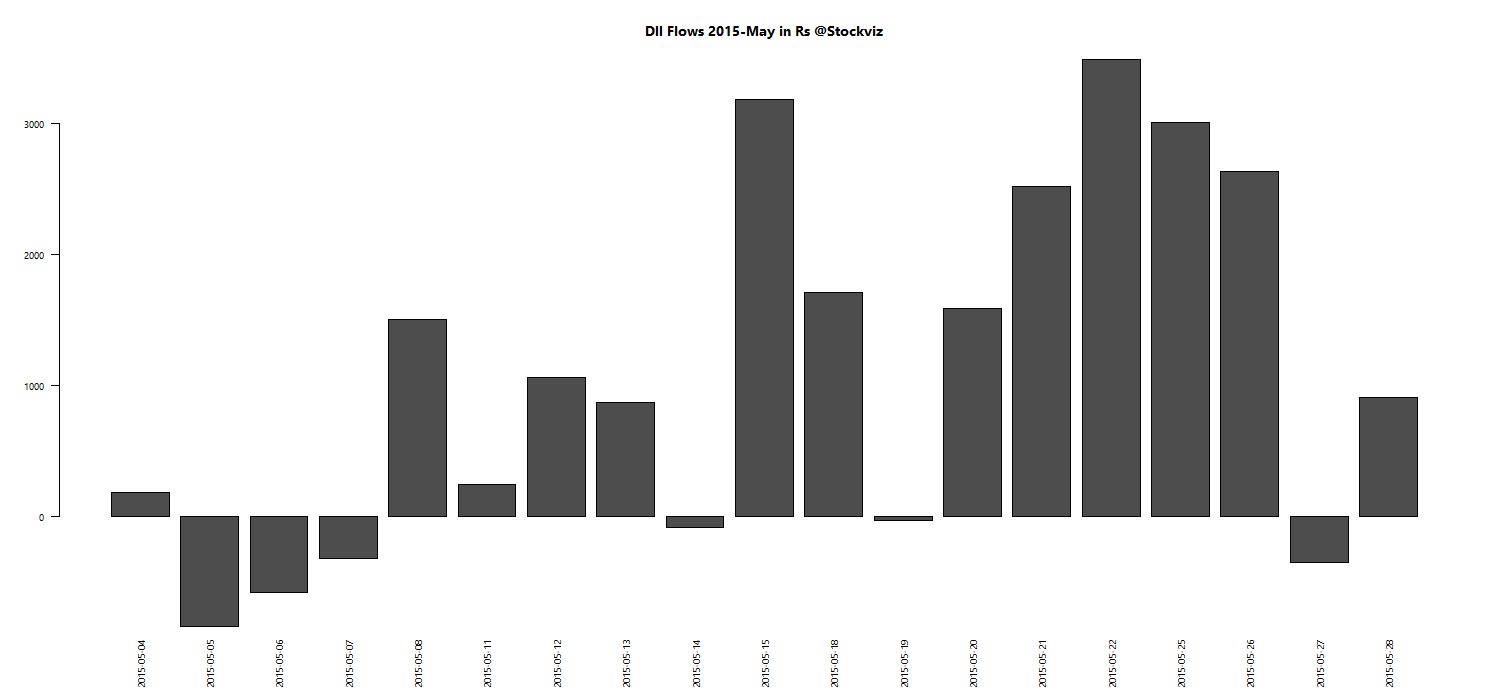
Domestic institutional investors tried to keep up but were helpless under the onslaught.

dii-investments.2014-01-01.2015-05-30

Lets zoom into what happened on a daily basis to get sense for how badly we shot ourselves on our foot:

fii-investments-monthly.2015-05-01.2015-05-30

dii-investments-monthly.2015-05-01.2015-05-30

DIIs pushed the buy button near the end of the month – after the FIIs had finished scaring the bejeebers out of the market.

Oil

Oil futures in Nymex seem to have trailed off for now.

wti-brent.2011-01-18

Gold

Gold seems to be headed lower. As rate hikes get factored in, expect precious metals to drop more in USD terms.

gold.usd

And it seems to have trailed off in INR terms after an early spurt in May.

Copper

Copper is supposed to be a bellwether for global manufacturing and that seems to be back at Dec’14 levels.

copper.usd

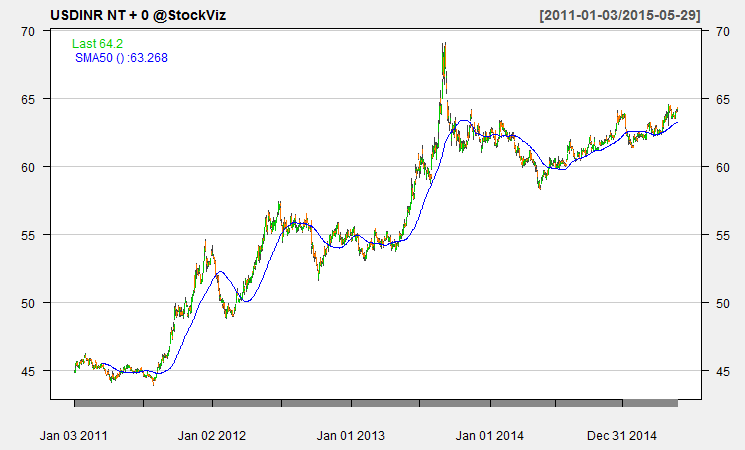
USDINR

The rupee continued to depreciate against the US dollar in May.

USDINR

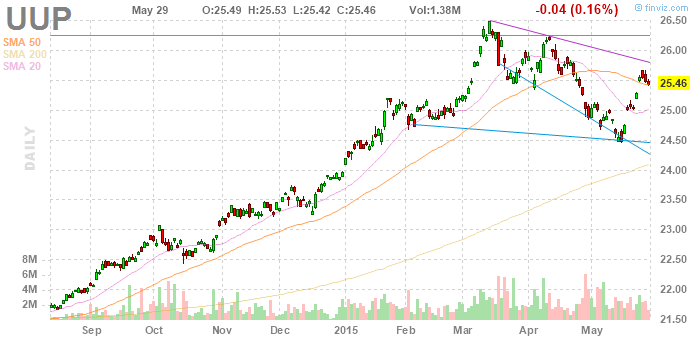
The Dollar Index (DXY) did a nice about turn.

Outlook

Here are some of the headlines this month from FT:

And while all this was being said and read, the Nifty went up 3% and our Momentum strategy was up 6% in May. (Monthly Recap) I am sure there is a lesson in market timing in there somewhere.

In terms of positioning your portfolio, the dollar is probably going to head higher since US rates are going to go up and Indian rates are going to go down. Oil usually goes in the opposite direction of the dollar. Gold in USD terms is probably going to head lower as rates normalize.