Tag: basic

Fundamental strategies

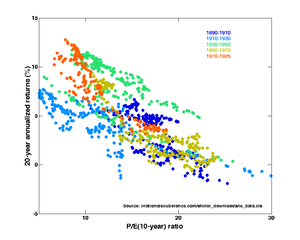
Price-Earnings ratios as a predictor of twenty...

Image via Wikipedia

We had a look at candle-sticks, the most popular technical here. Lets turn our attention to fundamental investing. To recap, fundamental investing is based on metrics that are intrinsic to a company. Investors can choose from a broad range of fundamental investing styles to fit their temperament:

Value

Value investing was pioneered by Ben Graham and David Dodd right about the time of the Great Depression. Value investors, typically, buy stocks that trade at a discount to book value, pay out high dividends or have low PE ratios. It involves buying stocks with a “margin of safety”: the discount at which a stock trades to its intrinsic value.

Some characteristics of companies with good value:

  • flexible cost structure: ability to reduce or increase costs depending on revenues
  • competitive moat: ability to maintain competitive advantages in order to protect long-term profits and market share
  • asset cushion: financial position to outlast a downturn
  • FCF driven dividend growth: dividends need to get paid out in cash. This could either be through free-cashflow or by higher gearing.
  • client base: a company should not be dependent on any one client for a large chunk of its business

In terms of performance, value investing is a lifestyle choice. There are periods where value investing underperforms the broader index. Also, just because something is “value” doesn’t mean that its market price cannot drop further (called the “value trap”).

For example, technology services companies such as HCL and Infosys are typical value plays.

Growth

Growth investors look for companies with strong growth potential. Growth stocks may appear over-valued while looking at standard PE or PB multiples, but the expectation of future earnings drive current prices higher.

Some questions that need to be answered while looking at growth stocks are:

  • scalability: how quickly can the company scale operations, sales and distribution to match customer expectations?
  • cost of capital: how expensive is it for the company to fund its growth
  • dilution: what is the probability that the company will have to dilute existing equity holders to raise capital?
  • path to profitability: how close is the company to break-even?

Chasing growth can be a volatile experience. A lot of future expectations are factored into the current price levels and any deviation from meeting those expectations can lead to sudden collapse in prices.

For example, stocks like IRB, GMR Infra trade at high PEs because the market expects a lot of growth in the near future.

Buy & Hold

Buy and Hold investing, as the name suggests, is investing over a long term, typically in excess of 5 years. It goes hand-in-hand with constant-dollar-investing on an index through ETFs or low-cost mutual funds – investors invest a fixed amount of money on a broad, low-cost basket of securities. The idea is that as long as the fundamentals of the economy is strong (over a long term), investors keep buying an index (more when the index falls and less when it rises).

Combined with dividend reinvestment, buy & hold investing is practical for passive investors and has yielded better results compared to active investing when taking into account transaction costs and management fees.

Enhanced by Zemanta

What are ETFs?

The Symbol of Indian Rupee approved by the Uni...

Image via Wikipedia

ETFs are fast becoming a popular choice for passive investors who would like to stay invested in the stock market without having to paying large fees to investment managers. One can think of an ETF as

  • a mutual fund that can be traded on the stock exchange as any stock
  • an index fund that tracks a popular index (Nifty 50, Junior Nifty, etc…)
  • a passive investment vehicle that doesn’t depend on a manager’s stock-picking ability

Essentially, an ETF will be a basket of stocks, much like a mutual fund. It will typically track an index with much lower fees compared to a mutual fund. And investors can trade in and out of ETFs on the stock market through their trading accounts.

Some of the popular ETFs in India are the NIFTYBEES (tracking the Nifty 50 index), JUNIORBEES (tracking the Junior Nifty) and the Bank ETFs KOTAKPSUBK & BANKBEES.

The three things to look out for while investing in ETFs is the total annual expense ratio (should be < 1%), tracking error (< 0.5% annualized) and liquidity (there should a fair amount of daily trading activity).

In the recent past, fund houses have tried to capitalize on sector specific ETFs with varying degree of success. For example, there are more than a dozen Gold ETFs listed in the NSE. However, the primary problem with commodity ETFs that don’t hold the physical underlying is that the tracking error tends to get compounded over a period of time and may not reflect the price actions accurately.

ETFs have traditionally worked great at tracking broad, liquid indexes and remain the preferred way to get passive market exposure.

Enhanced by Zemanta

Staying Alert

HANG ON TO YOUR WALLETS!

Image by SS&SS via Flickr

Most of investing literature revolves around buying decisions. However, in order to truly profit from the markets, it is important to know when to sell as well. An important part of knowing when to sell is keeping informed of actionable market actions in your portfolio, mainly done through what are known as “trailing” alerts.

A trailing alert typically gets triggered when a stock hits a price level that is relative to its previous close. For example, in order to protect my profits, I could set a trailing stop of 2% on DLF. Now if DLF drops below 2% from the previous close, you automatically exit out of the stock, thus monetizing whatever profit you had in that position or preventing more losses.

The trick is setting the percentage at a level that will pick up a true price drop as opposed to normal daily price fluctuations.

You can setup to receive alerts on SMS/email on StockViz by visiting http://stockviz.biz/alerts Here’s how I’ve setup mine:

image

As you can see, I’ve set both up and down trailing alerts for DLF so that I can monitor the stock closely, whereas I’m interested in only drops more than 5% in a day for Reliance and ONGC.

Stay alert & Stay sharp!

Enhanced by Zemanta

Candlesticks–light my fire

Office candlestick in brass, made by Skultuna ...

Image via Wikipedia

StockViz charts for individual stocks are what are known as candlestick charts. Candlestick charting first appeared sometime after 1850. Much of the credit for candlestick development and charting goes to a legendary rice trader named Homma from the town of Sakata. It is likely that his original ideas were modified and refined over many years of trading eventually resulting in the system of candlestick charting that we use today. Here’s a chart for RELIANCE on June 9th:

image

Unlike a straightforward line chart that you see in most places, a candlestick chart gives you a whole lot of information regarding the technicals of the stock. When you hover over one of the sticks, you should be able to see the High, Low, Open & Close prices of the day. There’s a wealth of information hidden in those values and the rest of the article shows you how to decipher them.

Basic idea

image

Each candlestick provides an easy-to-decipher picture of price action. Hollow candlesticks, where the close is greater than the open, indicate buying pressure. Filled candlesticks, where the close is less than the open, indicate selling pressure.

Generally speaking, the longer the body is, the more intense the buying or selling pressure. Conversely, short candlesticks indicate little price movement and represent consolidation.

After extended declines, long white candlesticks can mark a potential turning point or support level. If buying gets too aggressive after a long advance, it can lead to excessive bullishness. Conversely, after a long advance, a long black candlestick can foreshadow a turning point or mark a future resistance level. After a long decline a long black candlestick can indicate panic or capitulation.

Using shadows

Marubozu

Candlesticks without upper and lower shadows are called Marubozu brothers. A White Marubozu forms when the open equals the low and the close equals the high. This indicates that buyers controlled the price action from the first trade to the last trade. Black Marubozu form when the open equals the high and the close equals the low. This indicates that sellers controlled the price action from the first trade to the last trade.

Long & Short

Upper shadows represent the session high and lower shadows the session low. Candlesticks with short shadows indicate that most of the trading action was confined near the open and close. Candlestick with long shadows show that prices extended well past the open and close.

Candlesticks with a long upper shadow and short lower shadow indicate that buyers dominated during the session, and bid prices higher. However, sellers later forced prices down from their highs, and the weak close created a long upper shadow. Conversely, candlesticks with long lower shadows and short upper shadows indicate that sellers dominated during the session and drove prices lower. However, buyers later resurfaced to bid prices higher by the end of the session and the strong close created a long lower shadow.

Spinning tops

Candlesticks with a long upper shadow, long lower shadow and small real body are called spinning tops. Spinning tops represent indecision. The small real body shows little movement from open to close, and the shadows indicate that both bulls and bears were active during the session. Even though the session opened and closed with little change, prices moved significantly higher and lower in the meantime. Neither buyers nor sellers could gain the upper hand and the result was a standoff. After a long advance or long white candlestick, a spinning top indicates weakness among the bulls and a potential change or interruption in trend. After a long decline or long black candlestick, a spinning top indicates weakness among the bears and a potential change or interruption in trend.

Doji

Doji form when a security’s open and close are virtually equal. Doji convey a sense of indecision or tug-of-war between buyers and sellers. A doji that forms among candlesticks with long real bodies would be deemed significant.

As you can tell, candlesticks can be a powerful tool for technical analysts. For those who are interested in a deeper introduction, a hop over to stockcharts.com would be worthwhile.

Source: Introduction to Candlesticks

Enhanced by Zemanta

Technical vs. Fundamental investing

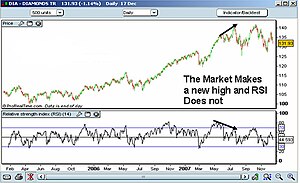
Example of RSI Indicator Divergence

Image via Wikipedia

We had briefly discussed stock and enterprise valuation metrics before. These metrics are collectively called termed “Fundamentals”, i.e., these multiples are intrinsic to the company and not dependent on the broader market. Fundamental investors invest on a stock looking at it’s valuation relative to its peers, its future earnings potential, free cashflow, dividends, etc. There is another breed of investors that trade based on a stock’s past market data, primarily price and trading volume.

Technical analysts examine what investors think about a particular stock and whether or not they have the wherewithal to back up their opinions; these two concepts are called psych (psychology) and supply/demand. They employ models based on price and volume transformations, such as the relative strength index (RSI), moving averages (SMA), price correlations, business & stock market cycles and recognition of chart patterns. The basic underlying premise is that:

  1. all relevant information is baked into the price & volume action of a stock,
  2. prices move in trends (up, down, or sideways), and
  3. history repeats (investors collectively repeat the behaviour of the investors before them)

Technical trading fits nicely into programmed trading – computers are way faster at calculating and executing trades than people. By removing fundamental metrics out of the picture and focusing on pure market driven computation, machines can act in a very quantitative and non-subjective fashion.

Technical analysis alone may not be the best option for most investors. No matter how strong the technicals are, fundamentals eventually catch up. The best approach to investing is one that combines both the approaches: shortlist stocks based on fundamentals and watch their technicals at regular intervals. Execute only when the technicals flash green (or red).

Enhanced by Zemanta