
Image via Wikipedia
StockViz charts for individual stocks are what are known as candlestick charts. Candlestick charting first appeared sometime after 1850. Much of the credit for candlestick development and charting goes to a legendary rice trader named Homma from the town of Sakata. It is likely that his original ideas were modified and refined over many years of trading eventually resulting in the system of candlestick charting that we use today. Here’s a chart for RELIANCE on June 9th:
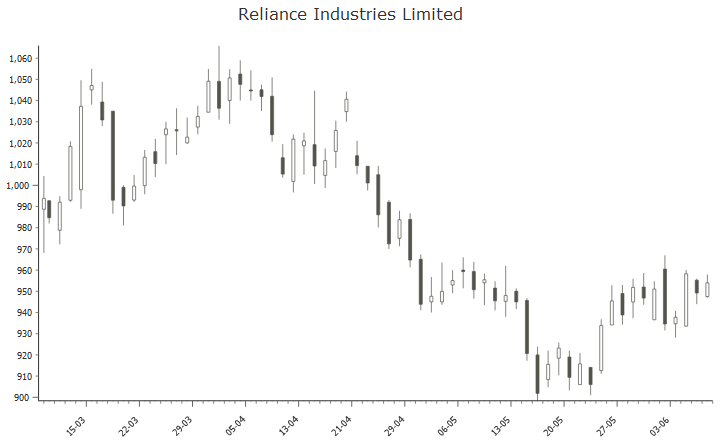
Unlike a straightforward line chart that you see in most places, a candlestick chart gives you a whole lot of information regarding the technicals of the stock. When you hover over one of the sticks, you should be able to see the High, Low, Open & Close prices of the day. There’s a wealth of information hidden in those values and the rest of the article shows you how to decipher them.
Basic idea

Each candlestick provides an easy-to-decipher picture of price action. Hollow candlesticks, where the close is greater than the open, indicate buying pressure. Filled candlesticks, where the close is less than the open, indicate selling pressure.
Generally speaking, the longer the body is, the more intense the buying or selling pressure. Conversely, short candlesticks indicate little price movement and represent consolidation.
After extended declines, long white candlesticks can mark a potential turning point or support level. If buying gets too aggressive after a long advance, it can lead to excessive bullishness. Conversely, after a long advance, a long black candlestick can foreshadow a turning point or mark a future resistance level. After a long decline a long black candlestick can indicate panic or capitulation.
Using shadows
Marubozu
Candlesticks without upper and lower shadows are called Marubozu brothers. A White Marubozu forms when the open equals the low and the close equals the high. This indicates that buyers controlled the price action from the first trade to the last trade. Black Marubozu form when the open equals the high and the close equals the low. This indicates that sellers controlled the price action from the first trade to the last trade.
Long & Short
Upper shadows represent the session high and lower shadows the session low. Candlesticks with short shadows indicate that most of the trading action was confined near the open and close. Candlestick with long shadows show that prices extended well past the open and close.
Candlesticks with a long upper shadow and short lower shadow indicate that buyers dominated during the session, and bid prices higher. However, sellers later forced prices down from their highs, and the weak close created a long upper shadow. Conversely, candlesticks with long lower shadows and short upper shadows indicate that sellers dominated during the session and drove prices lower. However, buyers later resurfaced to bid prices higher by the end of the session and the strong close created a long lower shadow.
Spinning tops
Candlesticks with a long upper shadow, long lower shadow and small real body are called spinning tops. Spinning tops represent indecision. The small real body shows little movement from open to close, and the shadows indicate that both bulls and bears were active during the session. Even though the session opened and closed with little change, prices moved significantly higher and lower in the meantime. Neither buyers nor sellers could gain the upper hand and the result was a standoff. After a long advance or long white candlestick, a spinning top indicates weakness among the bulls and a potential change or interruption in trend. After a long decline or long black candlestick, a spinning top indicates weakness among the bears and a potential change or interruption in trend.
Doji
Doji form when a security’s open and close are virtually equal. Doji convey a sense of indecision or tug-of-war between buyers and sellers. A doji that forms among candlesticks with long real bodies would be deemed significant.
As you can tell, candlesticks can be a powerful tool for technical analysts. For those who are interested in a deeper introduction, a hop over to stockcharts.com would be worthwhile.
Source: Introduction to Candlesticks
